
Abstract
Objective
Nonspecific neck pain (NSNP) has been associated with altered scapular kinematics, but the relationship remains controversial due to inconsistent findings. This study aimed to develop and validate a machine learning (ML) model for predicting NSNP based on scapular upward rotation (SUR) trajectory patterns using a simplified 2D approach.
Methods
A total of 332 public service office workers (240 with NSNP, 92 asymptomatic) participated. SUR was recorded using smartphone video and analyzed. Three kinematic variables were measured: horizontal displacement (HD), vertical displacement (VD), and horizontal-to-vertical ratio (HVR). Six ML algorithms were implemented and evaluated using leave-one-subject-out cross-validation (LOOCV) and multiple performance metrics. Partial dependence plots (PDPs) were generated to visualize relationships between movement parameters and NSNP probability.
Results
K-Nearest Neighbors and Support Vector Machine algorithms demonstrated good classification performance (area under the receiver operating characteristic curve (AUC): 0.879 and 0.827 in LOOCV; 0.873 and 0.866 in independent testing, respectively) in identifying NSNP based on scapular movement patterns. The remaining algorithms showed substantially lower performance (AUC range: 0.487–0.560). PDPs revealed nonlinear relationships between kinematic variables and NSNP probability. 2D plots identified specific combinations of horizontal and vertical displacement associated with lower NSNP risk (HD: 4.00–6.00 cm, VD: 6.00–10.00 cm).
Conclusions
ML analysis of SUR trajectories demonstrates powerful predictive capabilities for identifying NSNP. The nonlinear relationships and interaction effects revealed through this analysis help explain previously conflicting findings in the literature and provide quantitative targets for clinical assessment and intervention.
Keywords
Introduction
The neck and scapula are closely connected both biomechanically and neurologically.1–3 Muscles such as the levator scapulae and upper trapezius directly connect the cervical spine to the scapula. Muscles that control the scapula, including the levator scapulae (C3–4), rhomboid (C4–5), serratus anterior (C5–7), and lower trapezius (partially C3–4), are innervated by cervical nerves. 4 These structures may mutually influence nonspecific neck pain (NSNP) and movement impairments, with dysfunction in one region potentially affecting the other due to their close anatomical and neurological connections.2,35–7 Therefore, NSNP and altered scapular kinematics demonstrates a significant biomechanical relationship, particularly in the context of scapular upward rotation (SUR) patterns.5,8 Recent studies have shown that patients with NSNP often exhibit distinct alterations in scapular movement patterns compared to healthy individuals. 9 The relationship between NSNP and scapular dysfunction has been extensively documented, with evidence suggesting that altered scapular kinematics may both contribute to and result from cervical spine disorders.1,5 Research indicates that SUR plays a crucial role in maintaining optimal cervical spine mechanics and may serve as a key indicator of neck dysfunction. 10 Understanding this relationship has become increasingly important for both diagnostic and therapeutic purposes in clinical practice.
Traditional methods of measuring SUR have relied on three-dimensional motion capture systems and electromagnetic tracking devices.11,12 These conventional approaches, while providing comprehensive data, present significant challenges in both research and clinical settings due to their complexity and cost.13,14 Historically, research has predominantly focused on scapulohumeral rhythm, where scapular motion is measured in relation to humeral movement.12,15 This emphasis on the coupled motion between the humerus and scapula, while important, has limited our understanding of isolated scapular movement patterns. Furthermore, there is a notable lack of research examining normal patterns of independent SUR without reference to humeral position.1,16 Traditional measurement techniques often struggle to account for the dynamic characteristics of scapular movement, particularly during functional activities, as they are typically based on predetermined humeral elevation angles rather than natural scapular motion patterns. 14 The limitations of these methods have created a notable gap between research capabilities and clinical applicability, highlighting the need for more accessible and practical measurement approaches that can capture isolated scapular movement patterns.
The dynamic feature of SUR presents unique challenges in measurement due to the continuous shifting of the center of rotation during movement.17,18 This phenomenon makes traditional fixed-axis rotation measurements potentially inaccurate or incomplete. Additionally, it is difficult to track scapular movement during shoulder motion because the scapula is covered by soft tissue. 19 By focusing on the trajectory of movement through acromion marker tracking, we can capture the true nature of SUR motion while accounting for this dynamic center of rotation. 16 This approach provides a more accurate representation of scapular kinematics while simplifying the measurement process into trackable X and Y coordinates. The trajectory-based method also offers the advantage of capturing the continuous nature of scapular movement rather than discrete positional measurements. Beyond traditional motion capture systems, emerging multimodal approaches have explored sensor fusion techniques combining video analysis with myoelectric and inertial sensors for enhanced movement pattern recognition.20,21 These sophisticated methods, including attention-based spatiotemporal feature extraction and transient electromyographic signal processing, offer comprehensive biomechanical analysis capabilities but require specialized equipment and complex protocols that may limit clinical accessibility. Our smartphone-based video analysis represents a complementary approach prioritizing clinical feasibility while capturing essential kinematic patterns relevant to NSNP assessment.
Given the complexity of scapular trajectory patterns and their potential clinical significance, advanced analytical approaches are needed to extract meaningful patterns from these movement data. Recent advances in machine learning (ML) have demonstrated promising results in analyzing biomechanical data and predicting musculoskeletal conditions.22,23 Various studies have successfully applied ML algorithms to classify NSNP based on cervical spine movement patterns and craniocervical posture. 24 However, despite the established relationship between scapular kinematics and NSNP,9,10 no studies have yet investigated the potential of using SUR patterns for NSNP prediction through ML approaches. While several studies have applied ML to various aspects of movement analysis, the application of artificial intelligence to analyze scapular trajectory patterns represents a novel approach that could potentially bridge the gap between complex biomechanical analysis and clinical decision-making.25,26 Our innovative approach of using ML algorithms to analyze 2D trajectory data of SUR for NSNP prediction offers a unique combination of clinical practicality and analytical sophistication, addressing a significant gap in current research and clinical practice.
The primary aim of this study is to develop and validate a ML model for predicting NSNP based on SUR trajectory patterns. Additionally, we seek to establish normative data for optimal scapular movement patterns and identify specific trajectory characteristics that may indicate dysfunction. By creating a more accessible and accurate method of analyzing scapular movement, we aim to enhance both clinical assessment capabilities and therapeutic outcome measures. This research represents a significant step forward in understanding the relationship between SUR kinematics and NSNP, while providing clinicians with practical tools for assessment and treatment planning.
Methods
Participants
A total of 340 public service office workers (PSOWs) were screened for eligibility, of whom 240 had NSNP (Figure 1). All participants had used computers in office environments for more than two years. This cross-sectional study was conducted between February 2023 and June 2024. Data collection and kinematic measurements were performed in the health management rooms of participating public service offices. All assessments were conducted in standardized clinical environments within the workplace health facilities to ensure consistent measurement conditions and participant convenience. Participants with NSNP were included if they 1 reported an average neck pain intensity over the previous four weeks greater than 3 out of 10 on a Numerical Rating Scale (NRS) and 2 had experienced neck pain for more than three months. 22 Asymptomatic individuals were eligible if they had no history of neck pain requiring treatment by clinician or healthcare practitioner within the past two years. Exclusion criteria for all participants included a history of spinal surgery, traumatic history of onset, rheumatological conditions, cervical radiculopathy or myelopathy, signs of central hyperexcitability, current or chronic respiratory conditions, or ongoing compensation claims related to injury. Pain location was assessed through structured verbal questioning, where participants categorized their neck pain as left-sided, right-sided, or bilateral. This three-category classification was selected to identify broad directional pain patterns. The PSOW data resulting from mandated musculoskeletal risk factor assessments were utilized to analyze risk factors associated with musculoskeletal disorders in public service offices. These assessments, legally required under occupational health and safety regulations to prevent work-related musculoskeletal disorders, included systematic evaluation of neck pain symptoms, functional limitations, work-related postural risk factors, and standardized demographic and occupational health questionnaires. The Institutional Review Board waived the requirement for explicit informed consent before the queries and analyses (1041849-202412-SB-267-01) because of the study's reliance on preexisting data. For a comprehensive statistical evaluation of the contribution of NSNP based on up to six variables, a sample size of at least 60 participants was required in accordance with the heuristic guideline of maintaining one variable per 10 events. To ensure adequate sample size for ML model stability, we conducted a prediction instability analysis across varying sample sizes (10%, 30%, 50%, 70%, and 90% of the total dataset). 27 The analysis demonstrated that prediction instability decreased substantially as sample size increased, with our final sample of 332 participants (664 shoulder observations) providing stable predictions across all six ML algorithms tested. Bootstrap analysis with 100 iterations confirmed that sample sizes above 70% of our dataset achieved acceptable prediction stability (instability < 0.15 standard deviation), validating the adequacy of our sample size for reliable ML model performance (Figure 2).

Flowchart of study design and machine learning process.
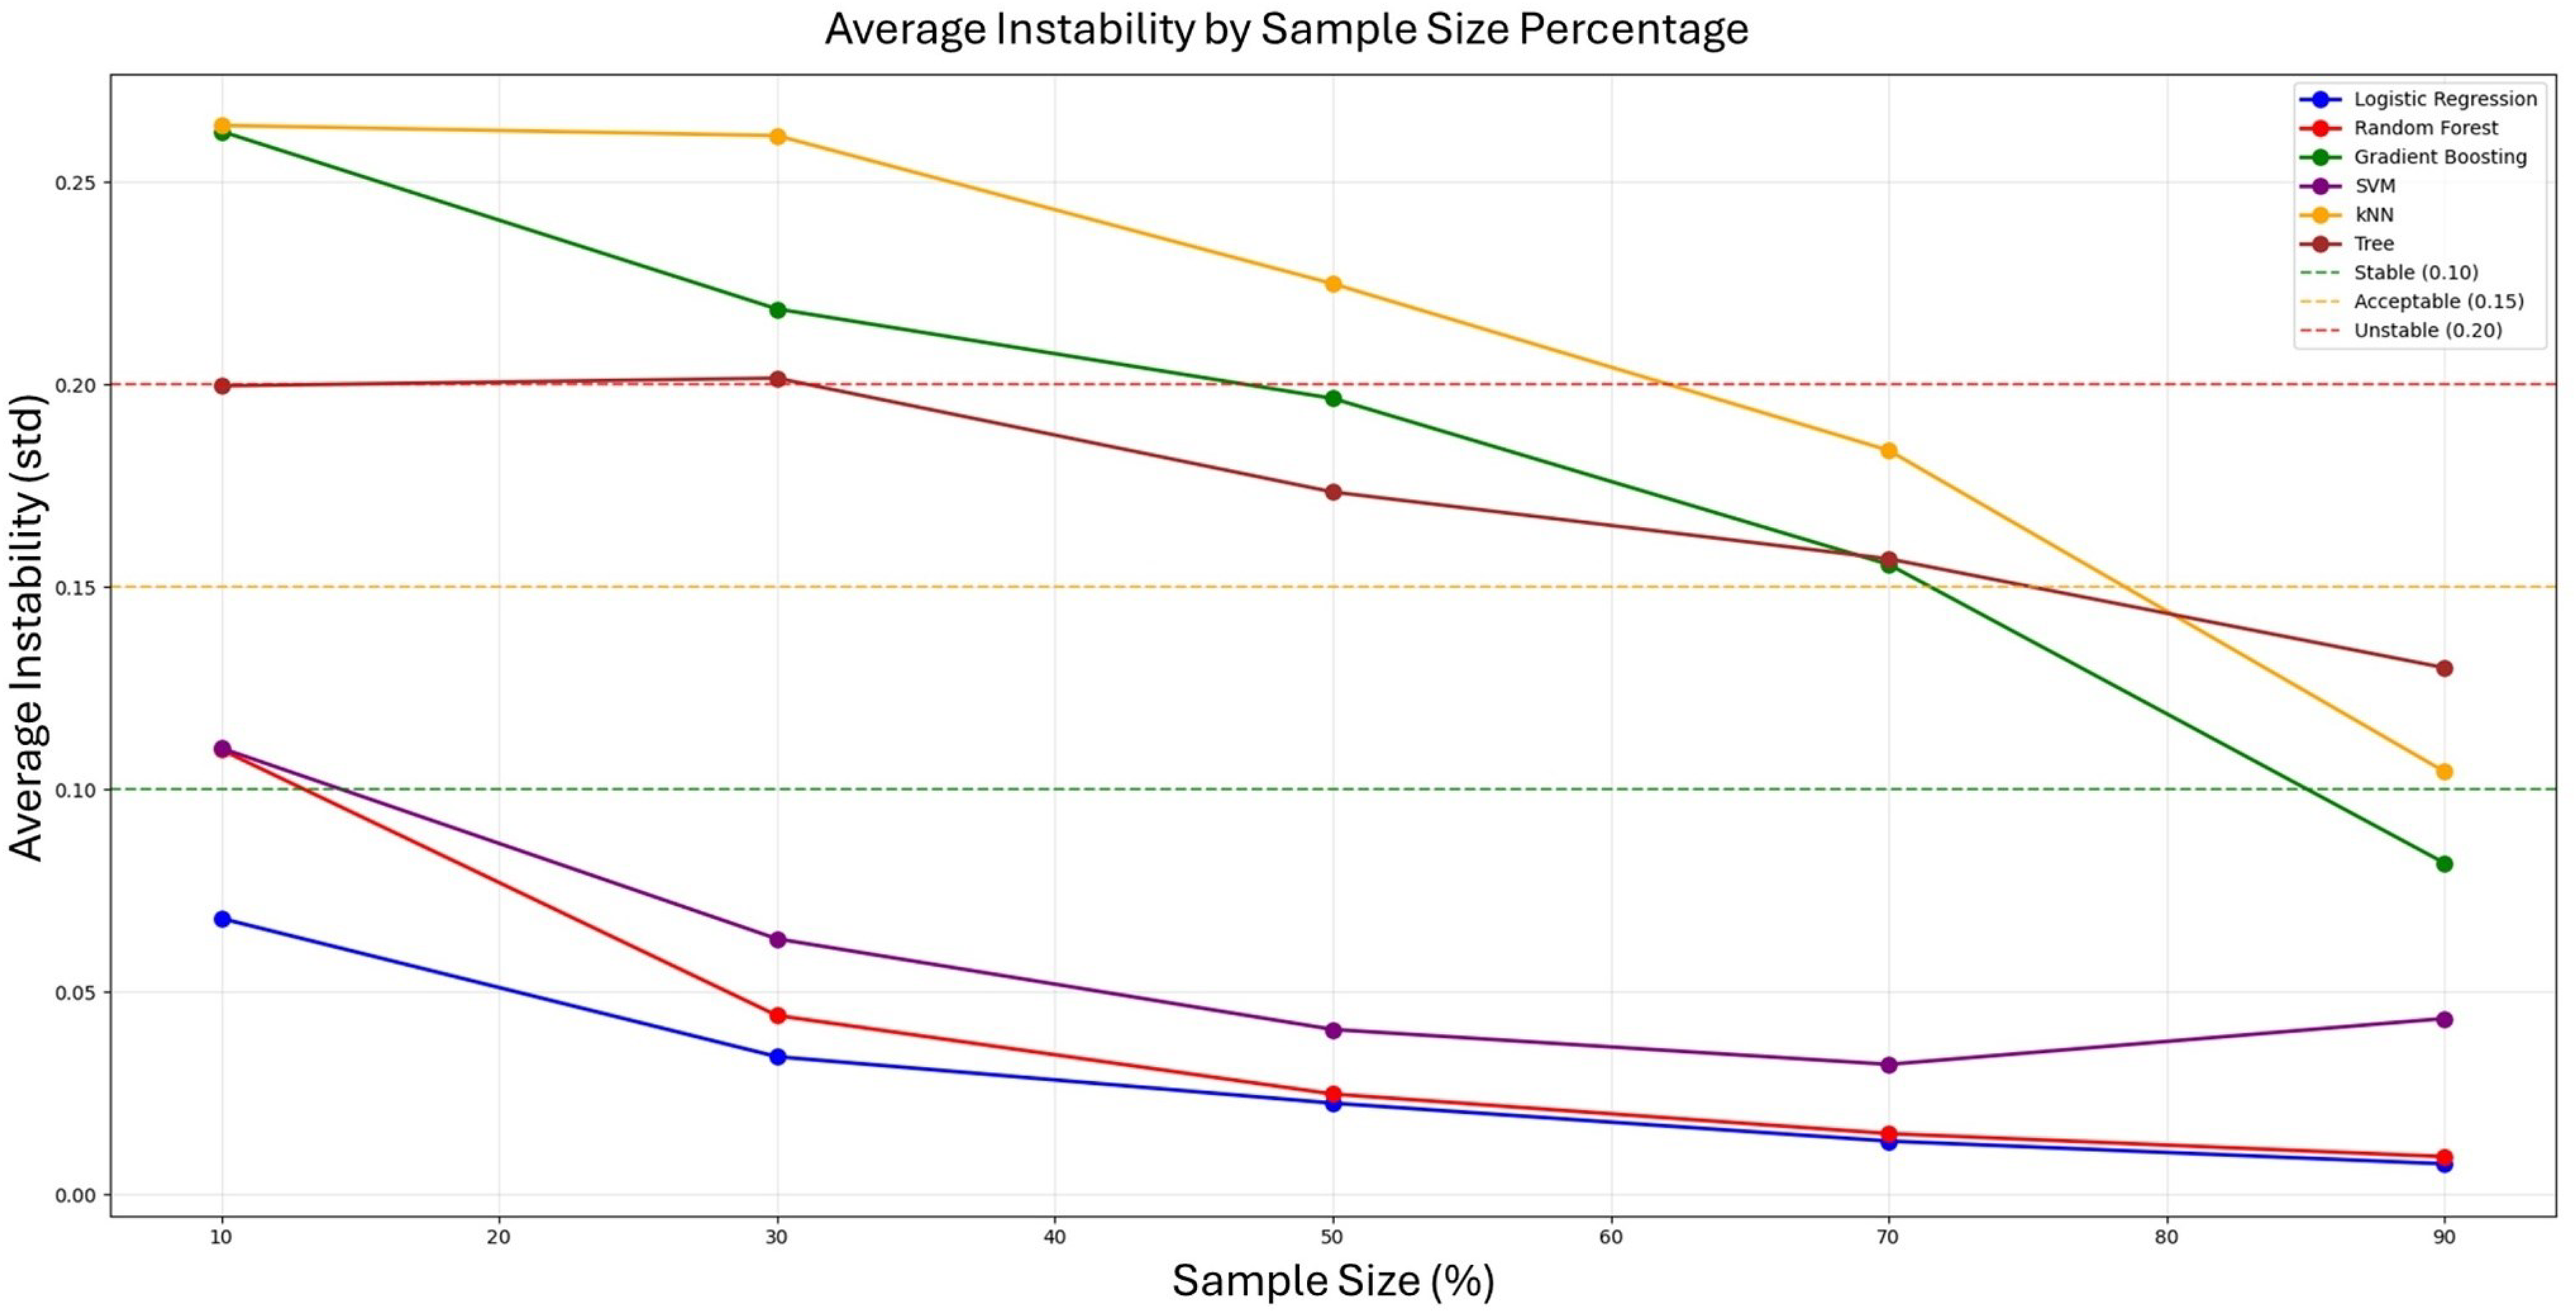
Prediction instability analysis across varying sample sizes for six machine learning algorithms.
Kinematic measurements using 2D video analysis
One smartphone (Galaxy S20; Samsung Inc., Seoul, Korea) with a video recording application (4 K, 3840 × 2160 pixels at 60 fps) was placed on a tripod positioned 150 cm behind the participant's chair at a height of 100 cm. The video data were transferred to Kinovea® software (version 0.8.15; Kinovea, Bordeaux, France) for analysis. In Kinovea, movement was detected and tracked through the use of automated tracking markers (Figure 3). 28 The process began with the user positioning a tracking marker on the acromion process, which initiated the detection of the coordinate system and enabled the commencement of analytical procedures. The landmarking of acromion process was performed manually by an experienced physical therapist with over five years of clinical experience.

Scapular upward rotation measurement procedure and trajectory analysis: (A) the starting position with the participant seated upright and the tracking marker positioned on the acromion, (B) the continuous tracking of the acromion marker during the SUR movement, (C) the measurement of HD and VD by comparing the starting point and end point of the acromion marker, and (D) the actual tracked trajectory plot obtained through Kinovea software, demonstrating the vertical and horizontal movements.
We tracked the acromion marker trajectory and extracted three key measurements. During data processing, these markers were tracked manually within the Kinovea software by the same researchers who were educated and trained for tracking protocol to ensure consistency in trajectory analysis. We measured the horizontal displacement (HD), vertical displacement (VD), and calculated the horizontal-to-vertical ratio (HVR) of the acromion marker during SUR (Figure 3). Each participant performed three repetitions of SUR in both sides, and the average values for each side were calculated. The HD and VD were measured in centimeters (cm), representing the maximum displacement along the X-axis and Y-axis, respectively. The HVR was calculated by dividing HD by VD (HD/VD), providing a normalized measure of movement pattern that is less dependent on individual anthropometric differences.
Due to the continuously shifting instantaneous center of rotation during SUR movement (Figure 4), we employed acromion trajectory analysis to capture this dynamic characteristic. Rather than measuring rotation around a predetermined fixed axis, this approach tracks the actual path of acromion movement, providing a more accurate representation of functional scapular motion patterns. Furthermore, while the verbal cue “move your acromion toward the earlobe” theoretically should be performed as SUR, participants may demonstrate various movement strategies. Some individuals may primarily use scapular elevation with limited horizontal displacement (restricted X-axis movement), while others may be unable to generate adequate movement amplitude. By tracking the acromion trajectory, we can intuitively assess how participants actually execute the SUR movement and identify different movement patterns that may be associated with neck pain dysfunction. To ensure measurement reliability, intrarater reliability was assessed for the kinematic measurements. The same experienced physical therapist repeated measurements on all participants, demonstrating excellent reliability for both horizontal displacement (ICC(3,1) = 0.916, 95% CI [0.897–0.932]) and vertical displacement (ICC(3,1) = 0.947, 95% CI [0.935–0.957]). While our single-marker trajectory approach differs from comprehensive International Society of Biomechanics standards for shoulder joint kinematics, which typically employ multimarker stereophotogrammetric systems to define anatomical reference frames and three-dimensional joint coordinate systems, 11 it provides a clinically accessible method for capturing scapular movement patterns relevant to NSNP assessment. This simplified approach prioritizes clinical feasibility and real-world applicability while maintaining excellent measurement reliability, though validation against established biomechanical standards remains necessary for future research.

Theoretical acromion trajectories during scapular upward rotation: (A) acromion trajectory when the root of spine serves as a fixed center of rotation, and (B) acromion trajectory when the center of rotation shifts along the scapular spine during movement, demonstrating the dynamic nature of scapular motion.
Procedure
Each participant was positioned on an adjustable stool, with the height calibrated to align with their popliteal crease. A global goniometer was used to ensure proper positioning with 90° angles at both the hips and knees, while the ankles were maintained in a plantar grade orientation. Participants were instructed to sit in their natural posture, avoid shifting their position on the seat, maintain normal breathing patterns, and direct their gaze forward. Prior to data collection, participants underwent a familiarization process. They were given a verbal cue to move their acromion toward the earlobe, simulating SUR. This movement pattern was practiced three times to ensure participants understood the required motion and could perform it consistently. Participants performed three repetitions of SUR. Both shoulders were tested independently using this protocol.
Data source and collection
Demographic and clinical information including age, sex, neck pain intensity, and the direction of pain were collected from all participants. For those with NSNP, pain intensity was quantified using a 10-cm NRS, where 0 represented “no pain” and 10 represented “worst imaginable pain.” The direction of pain (left, right, or bilateral) was also documented. Kinematic data were analyzed using Kinovea software. For each SUR movement, the maximum displacement (HD and VD) along both the horizontal (X-axis) and vertical (Y-axis) planes was measured. The HVR was calculated by dividing the X-axis value by the Y-axis value (X/Y). An increasing ratio value indicated a greater proportion of horizontal movement relative to vertical movement during SUR.
ML approaches and statistical analysis
Data preparation
This study employed supervised ML techniques. We utilized Orange data mining software (Orange3-3.38.1, Ljubljana, Slovenia) and Python (Version 3.6.15; Python Software Foundation) for modeling and statistical analysis. The dataset comprised 340 participants, from which we excluded eight cases with missing values to ensure data integrity, resulting in a final sample of 332 participants. Since both shoulders were measured for each participant, the complete dataset contained 664 data. Five predictor features were included in the analysis: sex, age, HD, VD, and HVR. The target variable was the presence of NSNP, which was determined based on a NRS score, with scores >3 classified as NSNP. Following standard ML protocols, we partitioned the dataset into three subsets: a training set comprising 399 observations (60%), a validation set of 132 observations (20%), and a test set containing 133 observations (20%) (Figure 1). This stratified splitting approach ensured proportional representation of both NSNP and asymptomatic cases across all subsets.
ML analysis: NSNP classification
We implemented six ML algorithms to classify participants with and without NSNP based on SUR trajectory patterns. Support Vector Machine (SVM) with radial basis function kernel was employed for its effectiveness with nonlinear decision boundaries. Extreme Gradient Boosting Classifier (XGBoost) was utilized for its sequential ensemble approach that builds upon previous tree errors. Random Forest was selected for its ability to reduce overfitting through averaging multiple decision trees. Lasso Logistic Regression was incorporated for its feature selection capability through regularization. Decision Tree was chosen for its interpretability and ability to model non-linear relationships. Additionally, k-Nearest Neighbors (kNN) was included for its instance-based learning approach that classifies based on proximity to training samples.
Each algorithm underwent leave-one-subject-out cross-validation (LOOCV) during the training phase to ensure robust performance evaluation and mitigate overfitting risks. The validation set was utilized for hyperparameter tuning through comprehensive grid search optimization. Grid search was performed across predefined parameter ranges selected based on established ML best practices and computational feasibility. For kNN, we evaluated n_neighbors (3, 5, 7, 9, 11), weights (“uniform,” “distance”), and metric (“euclidean,” “manhattan”). SVM parameters included C (0.1, 1.0, 10.0), kernel (“linear,” “rbf,” “poly”), and gamma ('scale,” “auto,” 0.1, 1.0). Decision Tree optimization covered max_depth (None, 3, 5, 7, 10), min_samples_split (2, 5, 10), and min_samples_leaf (1, 2, 4). Random Forest parameters included n_estimators (50, 100, 200), max_depth (None, 10, 20, 30), min_samples_split (2, 5, 10), and min_samples_leaf (1, 2, 4). XGBoost parameters included n_estimators (50, 100, 200), max_depth (3, 5, 6, 8), learning_rate (0.01, 0.1, 0.2, 0.3), subsample (0.8, 0.9, 1.0), colsample_bytree (0.8, 0.9, 1.0), and reg_lambda (0, 1, 2). Logistic Regression evaluated C (0.001, 0.01, 0.1, 1.0, 10.0) and penalty (“l1,” “l2”). The optimal parameters identified were: kNN (n_neighbors = 9, weights='distance’, metric='euclidean’), SVM (C = 1.0, kernel='linear’, gamma='scale’), Decision Tree (max_depth = None, min_samples_split = 2, min_samples_leaf = 1), Random Forest (n_estimators = 50, max_depth = None, min_samples_split = 5, min_samples_leaf = 4), XGBoost (n_estimators = 50, max_depth = 3, learning_rate = 0.01, subsample = 0.9, colsample_bytree = 1.0, reg_lambda = 0), and Logistic Regression (C = 10.0, penalty='l2’). The test set, comprising data not exposed during training or validation phases, provided an unbiased evaluation of the final model performance.
Model performance evaluation
We assessed model performance using multiple metrics to capture different aspects of classification quality. Area under the receiver operating characteristic curve (AUC) was calculated to evaluate the model's ability to discriminate between NSNP and non-NSNP cases across various threshold settings. Accuracy was measured as the proportion of correctly classified instances among the total number of instances. F1 score was computed as the harmonic mean of precision and recall to balance these two metrics. Precision (positive predictive value) was calculated as the ratio of true positives to all positive predictions, indicating the model's ability to avoid false positives. Recall (sensitivity) was determined as the ratio of true positives to all actual positives, representing the model's ability to identify all positive cases. Matthews Correlation Coefficient (MCC) was included as a balanced measure of binary classification quality that accounts for different class sizes.
These metrics were calculated for each model on both the validation and test sets. We categorized model performance based on AUC values: excellent (≥0.9), good (0.8–0.9), fair (0.7–0.8), and poor (<0.7). 29
Partial dependence plots
For algorithms demonstrating “good” performance (AUC ≥ 0.8), we generated partial dependence plots (PDPs) to visualize the relationship between individual predictors and the likelihood of NSNP classification.30,31 These plots illustrate the marginal effect of each feature on the predicted outcome after accounting for the average effects of all other features.
One-dimensional PDPs were created for each of the three kinematic variables (HD, VD, and HVR) to examine their individual relationships with NSNP probability. Additionally, 2D PDPs were generated to explore the interaction between HD and VD in relation to NSNP classification. These visualizations provided insights into the complex relationships between SUR trajectory patterns and NSNP, highlighting specific threshold values and interaction patterns.
Statistical analysis
Descriptive statistics were calculated for all participant characteristics and kinematic variables. Continuous variables are presented as mean ± standard deviation, while categorical variables are presented as frequencies and percentages. For between-group comparisons of participants with and without NSNP, independent t-tests were employed for continuous variables (age, work duration, horizontal displacement, vertical displacement, and horizontal-to-vertical ratio), while chi-square tests was used for categorical variables (sex). The alpha level was set at 0.05 for all statistical comparisons, with p-values < .05 considered statistically significant.
Results
Participant characteristics
A total of 332 participants (664 shoulder observations) were included in the final analysis. The demographic and clinical characteristics of participants with and without NSNP are presented in Table 1. Participants with NSNP (n = 240) were slightly younger than those without NSNP (n = 92) (p = .012). There was a significant gender disparity between groups, with females being more prevalent in both groups but especially in the NSNP group (p < .001). As expected, the NRS score was significantly higher in the NSNP group (p < .001). The NSNP group had a shorter work duration compared to the non-NSNP group (p = .002).
Participants’ characteristics.

Note: Data are presented as mean ± standard deviation for continuous variables and n (%) for categorical variables. NSNP: nonspecific neck pain; NRS: numerical rating scale; HD: horizontal displacement; SUR: scapular upward rotation; VD: vertical displacement; HVR: horizontal-to-vertical ratio.
Regarding SUR trajectory variables, HD during SUR was significantly lower in the NSNP group (p = .021). However, VD and HVR (p = .224) showed no statistically significant differences between groups. Among participants with NSNP, pain was reported as bilateral in the majority of cases (n = 274), with unilateral right (n = 119) and left (n = 87) pain reported less frequently.
ML model classification performance
The performance metrics of the six ML models applied using LOOCV and independent test sets are summarized in Table 2. In the LOOCV, kNN achieved the highest AUC (0.879), followed by SVM with an AUC of 0.827. Both models demonstrated “good” performance based on our predefined classification criteria (AUC 0.8–0.9). Among the remaining algorithms, XGBoost showed moderate performance with an AUC of 0.731, while Decision Tree achieved an AUC of 0.714. Random Forest and Lasso Logistic Regression demonstrated lower discriminative ability with AUC values of 0.662 and 0.539, respectively.
For classifying groups between with and without NSNP, performance metrics of six machine learning algorithms in the training and test dataset.

AUC: area under curve; CA: classification accuracy; Prec: precision; MCC: Matthews correlation coefficient; kNN: k-nearest neighbors.
This performance hierarchy was maintained in the independent test set, where both kNN and SVM sustained “good” classification performance with AUC values of 0.873 and 0.866, respectively. These models also achieved the highest accuracy (kNN: 0.850, SVM: 0.872), F1 scores (kNN: 0.851, SVM: 0.860), precision (kNN: 0.853, SVM: 0.875), recall (kNN: 0.850, SVM: 0.872), and MCC (kNN: 0.598, SVM: 0.625). The consistent performance between LOOCV and independent testing suggests robust generalizability of these two models.
The other algorithms demonstrated considerably poorer discriminative ability in the test set, with AUC values ranging from 0.487 (Decision Tree) to 0.560 (Random Forest), indicating “poor” classification performance according to our criteria.
PDP analysis
Given their superior performance, we generated PDPs for the kNN and SVM models to visualize and interpret how individual features and their interactions influenced classification of participants with and without NSNP (Figures 5 and 6). These plots reveal important clinical insights regarding the relationship between scapular kinematics and NSNP.
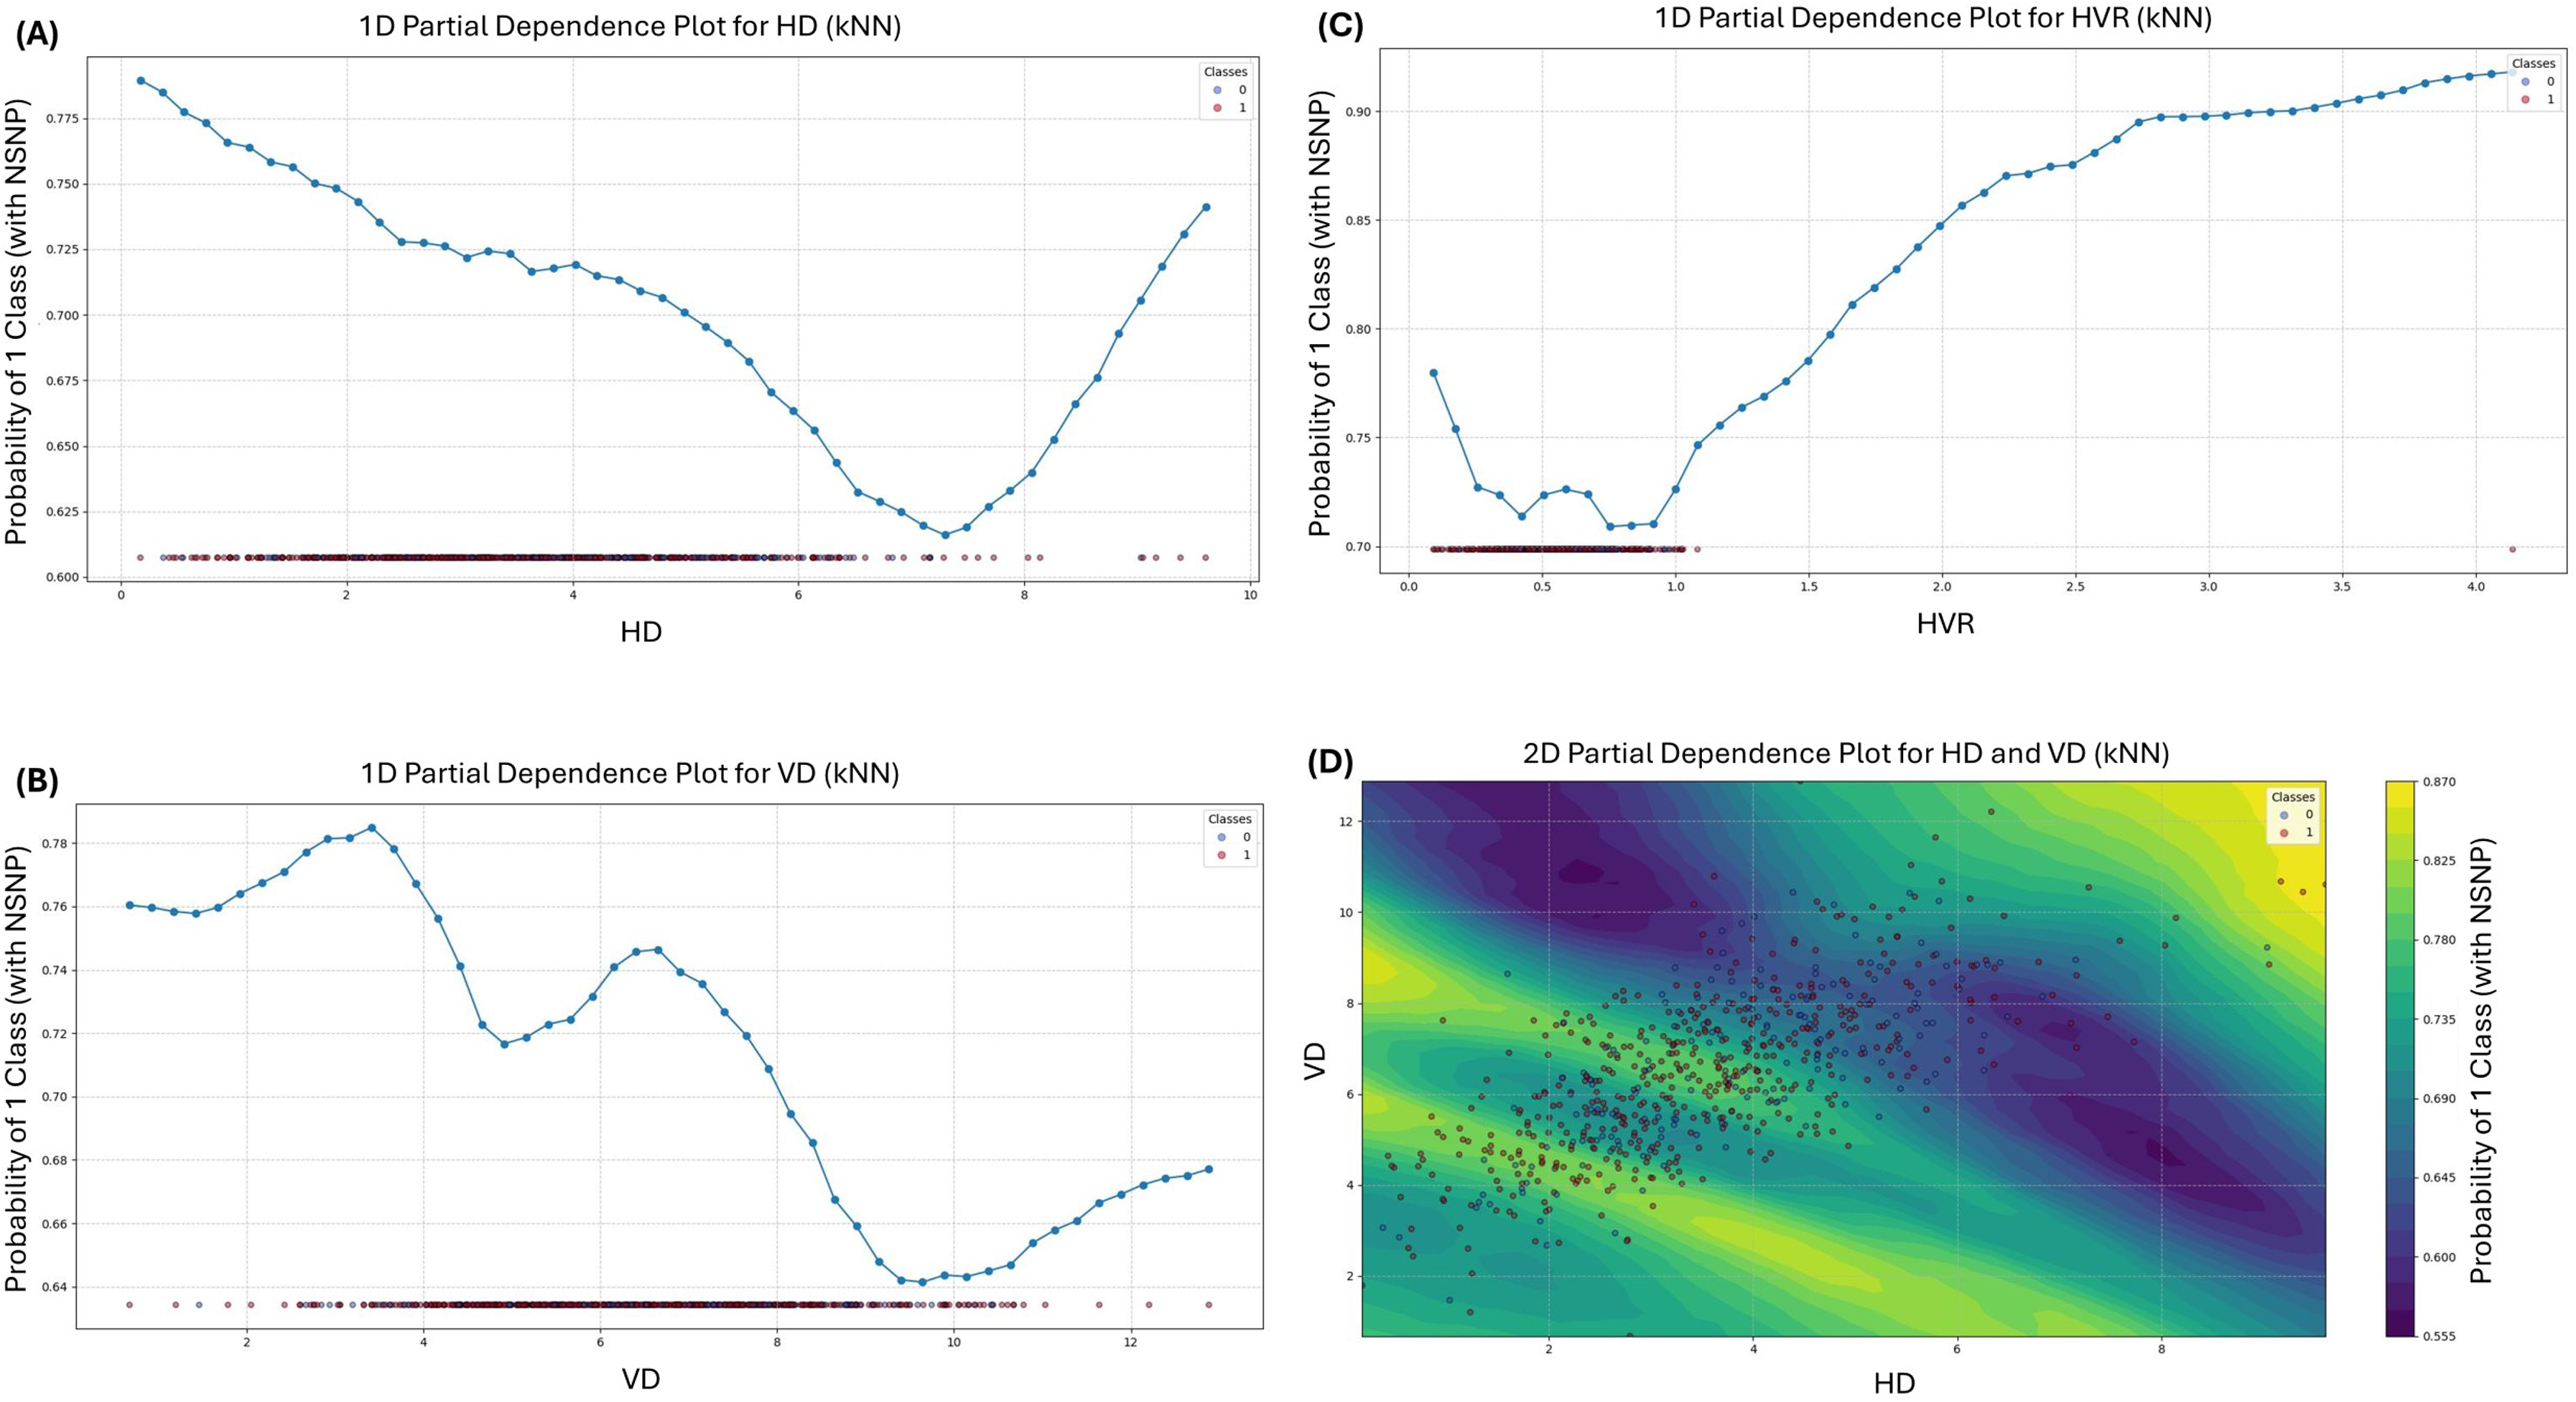
Partial dependence plots of scapular kinematic variables in kNN algorithm: (A) PDP for HD using the kNN, (B) PDP for VD using the kNN, (C) PDP for HVR using the kNN, and (D) 2D PDP between HD and VD using the kNN.

Partial dependence plots of scapular kinematic variables in SVM algorithm: (A) PDP for HD using the SVM, (B) PDP for VD using the SVM, (C) PDP for HVR using the SVM, and (D) 2D PDP between HD and VD using the SVM.
One-dimensional PDPs
The one-dimensional PDPs for HD using the kNN model revealed a nonlinear relationship with NSNP probability. The probability of NSNP classification was highest at very low values of HD (<1.00 cm) and gradually decreased until reaching its minimum at 7.43 cm, before increasing again at values >7.43 cm. This U-shaped relationship suggests that both extremely limited and excessive horizontal movement during SUR may be associated with increased NSNP risk. The SVM model showed a different pattern for HD, with the highest probability of NSNP at 2.26 cm, gradually decreasing as HD increased. This consistent finding across different algorithms strengthens the evidence for an inverse relationship between HD values of 4.00–6.00 cm and NSNP probability.
For VD, the kNN model demonstrated a complex relationship with NSNP probability. The plot revealed an initial increase in NSNP probability as VD increased from 1.75 cm to 3.42 cm, followed by a decrease until 4.85 cm, then another increase until 6.85 cm, and finally a decrease beyond this point. This multimodal pattern indicates that specific ranges of vertical scapular movement may be associated with different levels of NSNP risk. The SVM model's VD plot showed a somewhat different pattern, with NSNP probability increasing as VD increased from very low values to 3.75 cm, remaining relatively stable between 4.25 and 7.00 cm, then increasing to peak at 10.26 cm before decreasing at higher values.
The HVR plots showed the most consistent relationship across both models. The kNN model demonstrated a clear monotonic increase in NSNP probability as HVR increased beyond 1.05, with the steepest increase occurring between HVR values of 1.05 and 2.35. The SVM model showed a different pattern, with the highest NSNP probability at 0.38, then a consistent decrease as HVR increased, with the lowest probabilities occurring at HVR values between 2.45 and 3.35.
2D PDPs
The 2D PDPs illustrate how combinations of horizontal and vertical displacement interact to influence NSNP probability. The kNN model's 2D PDP shows a complex pattern of NSNP risk distribution. Notably, the regions with HD between 4.00–6.00 cm and VD between 6.00 and 10.00 cm demonstrate relatively lower NSNP risk compared to other movement combinations. This suggests that HD values of 4.00–6.00 cm combined with HD values of 4.00–6.00 cm during SUR may be associated with reduced neck pain risk.
The SVM model's 2D PDP revealed a clearer pattern with two distinct peaks of elevated NSNP probability: one centered at low VD (4.00–5.00 cm) combined with low HD (1.00–2.00 cm), and another at high VD (10.00–12.00 cm) with mid-range HD (5.00–6.00 cm). These two specific movement pattern combinations appear to have the strongest association with increased NSNP risk according to the SVM model.
Discussion
The relationship between scapular kinematics and NSNP has been controversial in prior research. While previous investigations primarily focused on cervical spine movements to classify or predict NSNP,22,24,32 the present study employed ML algorithms utilizing SUR trajectories to successfully predict NSNP. Our model demonstrated high predictive performance (AUC of 0.827–0.879 in LOOCV and 0.866–0.873 in independent testing), providing robust evidence that scapular kinematics are a critical and independent factor to consider in NSNP assessment. These findings offer valuable clinical insights, emphasizing that scapular movement analysis should be integrated into clinical practice and could significantly enhance targeted rehabilitation protocols for NSNP patients.
Our model's predictive performance aligns favorably when compared to recent ML studies. Kang et al. (2023) employed ensemble learning methods using image-based posture data and achieved an accuracy of 87%, precision of 92%, recall of 80.3%, and AUC of 0.878. 32 Hwang et al. (2024), utilizing cervical kinematics and postural data, reported a comparable best model performance with an AUC of 0.892, accuracy of 85%, and F1-score of 0.832. 24 Additionally, Liew et al. (2022) compared logistic regression with ML (XGBoost), noting that XGBoost improved prediction performance significantly (AUC: XGBoost = 0.726 vs. logistic regression = 0.623). 29 Our study, exclusively based on scapular trajectories, demonstrated comparable or superior performance, underscoring the predictive power of scapular kinematics independent of cervical measures.
Prior studies have reported inconsistent findings regarding scapular kinematics in individuals with NSNP. While some studies identified significant differences in scapular movement patterns between symptomatic and asymptomatic individuals,9,10 others failed to establish clear associations. 1 The one-dimensional PDPs from this study may help explain these conflicting results by revealing nonlinear relationships between movement parameters and NSNP probability. For HD, the kNN model revealed a U-shaped relationship with NSNP probability, which was highest at very low HD values, decreased until reaching its minimum at approximately 7.43 cm, and increased again at higher values. Similarly, for VD, the kNN model demonstrated multiple inflection points in NSNP probability across the range of movement. These nonlinear patterns suggest that traditional statistical methods assuming linear relationships may fail to detect significant associations, potentially explaining the inconsistent findings in previous research.
The complex relationships observed in the one-dimensional PDPs highlight the importance of using ML approaches for biomechanical analysis. Traditional linear statistical methods, such as logistic or linear regression, 29 assume linearity and additive relationships among variables, often oversimplifying the multifactorial nature of scapular dyskinesis. By contrast, ML approaches can capture intricate patterns within data without linearity assumptions. Previous research has highlighted substantial variability in scapular kinematic patterns even among asymptomatic individuals. 33 This inherent variability further complicates traditional linear approaches, which often rely on simplified scapulohumeral rhythm ratios (such as the commonly cited 2:1 ratio) that inadequately address the subtle interactions among scapular movements. The 2D PDPs from this study further illustrate the value of ML in capturing complex interaction effects between movement parameters. The 2D PDP for the kNN model revealed that specific combinations of horizontal and vertical displacement were associated with lower NSNP risk, particularly regions with HD between 4.00 and 6.00 cm and VD between 6.00 and 10.00 cm. Conversely, the SVM model's 2D PDP identified two distinct regions of elevated NSNP probability: one at low VD combined with low HD, and another at high VD with mid-range HD. These interaction patterns would likely be missed by traditional statistical methods that examine variables in isolation or assume additive effects. The ability to identify these specific movement pattern combinations represents a significant advantage of ML approaches in biomechanical analysis.
Cervical and scapular muscles collectively influence the movement of the scapulothoracic joint. However, previous studies primarily assessed scapular motion relative to humeral movement, inherently confounding scapular kinematics with glenohumeral joint motion.12,13,33 Since scapular movements at the scapulothoracic joint are not purely rotational—due to the continuous shifting of the rotation axis—it is methodologically inaccurate to characterize these motions solely as rotations around a fixed axis. 17 The trajectory-based analysis employed in this study provides a more precise representation of dynamic scapular motion by capturing continuous positional changes. This method allows for detecting subtle deviations in scapular control that single-angle measures may overlook, offering a more accurate understanding of scapular kinematics relevant to NSNP. Moreover, Sahrmann (2010) described several scapular movement impairment syndromes—such as scapular downward rotation, elevation, and adduction syndromes that represent nonlinear, complex interactions of multiple biomechanical factors.34,35 Traditional statistical approaches may fail to capture these multidimensional and interactive syndromes due to their restrictive assumptions and linear frameworks. ML techniques effectively handle these multidimensional complexities, capturing subtle, nonlinear relationships that better reflect clinical realities.
Clinically, the findings from the 2D PDPs offer valuable guidance for assessment and intervention. The identification of specific movement pattern combinations associated with lower NSNP risk (HD values of 4.00–6.00 cm combined with VD between 6.00 and 10.00 cm) provides quantitative targets for therapeutic interventions. Rehabilitation programs can be designed to promote these optimal movement patterns while addressing the high-risk patterns identified in the analysis. Furthermore, the nonlinear relationships revealed in the one-dimensional PDPs suggest that both restricted and excessive movement in certain directions may increase NSNP risk, highlighting the importance of restoring balanced scapular control rather than simply increasing movement range. The trajectory-based approach used in this study offers practical advantages for clinical implementation. By tracking the movement of a single point (the acromion) in two dimensions, this method simplifies the measurement process while still capturing clinically relevant information. This approach could be more feasible for routine clinical assessment compared to complex three-dimensional motion analysis systems. Future research could focus on developing standardized protocols for measuring and interpreting these trajectory patterns in clinical settings.
Several study limitations warrant discussion. First, we did not collect anthropometric measurements (height, weight, shoulder dimensions, or scapular length), which prevented normalization of kinematic data for individual body size differences. The use of absolute displacement measurements (cm) may have been influenced by interindividual anatomical variations, potentially affecting the generalizability of our findings. Future studies should incorporate anthropometric normalization to control for these confounding factors. While the inclusion of HVR as a ratio-based variable partially addresses this concern by providing relative movement patterns independent of absolute displacement magnitudes, comprehensive anthropometric normalization would strengthen the validity of kinematic analysis. Second, the sample consisted primarily of office workers, limiting generalizability to populations such as athletes or manual laborers. Future validation studies across diverse populations will be essential to establish the clinical utility and generalizability of this ML approach for NSNP prediction in different demographic and occupational contexts. Third, 2D trajectory analyses cannot fully capture comprehensive three-dimensional scapular motions, including internal/external rotations and anterior/posterior tilts. This omission may have led to incomplete characterization of scapular dysfunction patterns, as these rotational components are crucial for optimal glenohumeral mechanics and cervical spine postural control. Future studies should incorporate 3D motion analysis to validate our findings against comprehensive scapular kinematics. Fourth, our cross-sectional design precludes causal inference; thus, prospective longitudinal studies are needed to verify the temporal relationships between scapular dysfunction and NSNP. It remains unclear whether altered SUR trajectories represent a cause, consequence, or merely a concurrent manifestation of NSNP, which significantly limits our ability to establish therapeutic targets or preventive strategies based on these findings. Fifth, the assessment of pain location used a simplified categorical approach rather than validated pain mapping tools, which may have limited our ability to capture more detailed pain distribution patterns. Fifth, we did not collect potentially relevant confounding variables such as body mass index, physical activity level, or lifestyle factors that may influence both scapular kinematics and NSNP development, limiting our ability to control for these potential confounders in the ML models. Furthermore, other biomechanical factors known to influence NSNP, including cervical spine alignment parameters, hand dominance effects, and upper limb positioning during assessment, were not systematically evaluated or controlled for in our analysis. The exclusion of these variables may have resulted in incomplete characterization of the multifactorial nature of NSNP and potential oversight of important feature interactions that could influence model performance and clinical interpretation. Finally, although the ML model demonstrated robust predictive validity internally, external validation with independent datasets is necessary to confirm broader generalizability and practical clinical applicability.
Conclusion
The ML analysis of SUR trajectories demonstrates powerful predictive capabilities for identifying NSNP. The nonlinear relationships and interaction effects revealed through this analysis help explain previously conflicting findings in the literature and provide quantitative targets for clinical assessment and intervention. Future research should focus on validating these findings in diverse populations, developing clinically feasible assessment tools based on these trajectory patterns, and evaluating the effectiveness of targeted interventions aimed at normalizing identified movement impairments.
Footnotes
List of abbreviations
Acknowledgments
We would like to thank all participants in our study for their active participation and cooperation.
ORCID iDs
Ethical approval
The present study conformed to the ethical guidelines of the 1975 Declarations of Helsinki. The Yonsei University Mirae Campus Institutional Review Board waived the requirement for explicit informed consent before the queries and analyses (1041849-202412-SB-267-01) because of the study's reliance on preexisting data.
Authors’ contributions
UJH and OYK contributed to conceptualization, methodology, writing—original draft and visualization; OYK and HIY contributed to supervision and project administration; HIY contributed to data curation, validation, and software; UJH contributed to data curation and formal analysis.
Funding
The authors received no financial support for the research, authorship, and/or publication of this article.
Declaration of conflicting interests
The authors declared no potential conflicts of interest with respect to the research, authorship, and/or publication of this article.
Availability of data and materials
The datasets analyzed during the current study are available from the corresponding author on reasonable request.
Guarantor
Ui-jae Hwang.