
Abstract
Background
Sudden sensorineural hearing loss (SSNHL) has increasingly become a critical public health concern worldwide, with limited access to health knowledge among Chinese patients. TikTok is considered one of the most popular short-video platforms for health education information in China. However, there remains a lack of scientific investigation and evaluation for the quality of these videos.
Objective
The study aimed to examine the quality and content coverage of the short videos about SSNHL on TikTok as one of the most significant information sources for Chinese.
Methods
We retrieved 215 TikTok videos by comprehensive ranking with the Chinese search term “SSNHL” on 1 June 2025. Video sources, audience engagement, and video content were extracted. Two independent researchers evaluated the information of each video using m-DISCERN, Global Quality Score (GQS), Goobie's coding scheme, Journal of the American Medical Association (JAMA), and Video Information and Quality Index (VIQI). Besides, spearman correlation analysis was conducted.
Results
A total of 174 TikTok videos were ultimately included, 157 from healthcare, and 17 from nonhealthcare. The median video lengths were 50 s (healthcare) and 70 s (nonhealthcare). Videos from healthcare source gained higher overall audience engagement except comments. The majority of the video style was medical questions and answers (51.7%), while the most common video background was medical scenario (90.3%). Video uploaders were predominantly from first-tier cities (45.4%). Videos from healthcare showed more scores on the median m-DISCERN, GQS, JAMA, and VIQI than videos from nonhealthcare. The GQS and VIQI score positively correlated with metrics such as likes, shares and collections (p < .001), but the correlation was slight in most cases.
Conclusion
Videos from healthcare performed better than nonhealthcare, at the video quality of SSNHL-related knowledge. However, the overall quality and content coverage from both sources were unsatisfying. Despite some limited positive correlations between video quality and audience engagement, it suggests that individuals should be vigilant when discerning health-related information on TikTok.
Keywords
Introduction
Sudden sensorineural hearing loss (SSNHL) is a common otologic emergency often of unknown cause and characterized by a rapid, significant, usually one-sided sensorineural hearing impairment occurring within 72 h. 1 It was estimated the annual incidence ranged from 5 to 30 per 100,000 individuals, 2 while the prevalence was 3.7% with a higher prevalence in individuals aged 15–25 years and males. 3 Without prompt intervention, SSNHL could cause permanent hearing impairment and cognitive-emotional disorders, emphasizing the necessity for early recognition and management. 4
Public awareness of SSNHL, including its etiology, symptoms, diagnosis and management, is vital to facilitate timely medical care, improve treatment adherence, and optimize disease prognosis. 5 Effective patient education can equip individuals with knowledge of risk factors, prevention strategies, and lifestyle adjustments, directly improving hearing and recovery outcomes. 6 However, limited access to healthcare resources often prevents SSNHL patients from receiving detailed education or personalized care plans. 7 Consequently, online platforms, particularly social media and video-sharing sites, are increasingly used to seek detailed health information.
Video-based platforms have emerged as key health information communication channels due to their accessibility and engrossing formats. 8 Short videos can enhance public health literacy skills and promote positive health behaviors. 9 It was reported that over 60% respondents in China have used online videos as primary sources for seeking health information. 10 Nevertheless, the proliferation of medical content raises concerns about quality and reliability, as misleading information would result in wrong decisions and negative consequences.7,11
TikTok, founded in September 2016 with its vast global reach and high user engagement, has the promising potential for public health education, achieving over 176,000 comments and 1.7 million likes on related content.10,12 Lack of professional backgrounds, disparities in creator expertise, uncertified uploaders and inadequate platform regulation can lead to the spread of misleading content, thereby confusing patients and endangering public health.13,14 The situation necessitates rigorous evaluation of the effectiveness in conveying accurate SSNHL-related information.
In terms of the hearing issues, YouTube content has been examined for the video information about tinnitus. 15 The studies regarding the quality assessment of SSNHL-related online information remain absent, except for the research by Liam et al. in 2022. 16 However, they solely focused on patient education websites and suggested SSNHL-related online resources varied in quality and required improvement. Our study aims to assess the quality and content coverage of SSNHL-related videos on TikTok and further guide the public in accessing trustworthy information, while offering actionable recommendations to content creators and platform administrators for enhancing online health dissemination.
Materials and methods
Ethical statement
This study involved no human specimens, animal subjects or clinical datasets. All data and information involved in our secondary analysis was publicly available at the time of data collection on TikTok videos without any personal privacy implications and active interaction with users. Therefore, individual consent was not required for use. Our study was approved by the institutional review board of Huadong Hospital affiliated to Fudan University, China (No. 2025K338). This study conformed to TikTok user guidelines.
Search strategy and data collection
Using the Chinese term SSNHL as the keyword without any filtering condition, we searched and retrieved 215 TikTok videos according to comprehensive ranking on 1 June 2025. Prior to each search, we systematically logged out of all previous accounts, completely cleared the search history and registered new accounts for this study. The procedure was conducted to minimize potential bias arising from algorithmically personalized recommendations for the neutrality of the search results.
We excluded the videos published less than seven days, since the metrics of likes and comments for such recent uploads could result in unstable data and inaccurate audience engagement. Other Exclusion criteria included videos not presented in Chinese, duplicate videos, similar videos, irrelevant videos and videos without dobbing, resulting in the eligible TikTok videos included for further analysis (seen in Figure 1).

Search strategy and flowchart of this study.
For each video included in the analysis, comprehensive characteristics were documented and extracted within a structured spreadsheet to facilitate an integrated analysis of video performance and audience engagement. The video characteristics encompassed title, length, upload date, and duration (the days since release), as well as engagement metrics, including likes, likes/30 days, comments, comments/30 days, shares, shares/30 days, collections, collections/30 days. Additionally, the characteristics of uploaders were recorded: account name, author total likes, followings, followers, certification status, geographical location. To ascertain their authenticity, the uploaders with certification status underwent rigorous validation procedures via the examination of official verification badge (displayed as “V” mark on TikTok), the corresponding hospital/department/organization/association websites, and the work environment.
Video classification
The videos were divided into two groups based on the source: (1) healthcare practitioners or agencies and (2) nonhealthcare practitioners or agencies. Healthcare practitioners or agencies were further divided: (1) senior physicians, (2) junior physicians and (3) health institutions; nonhealthcare practitioners or agencies were further divided: (1) patients, (2) science communicators (Table 1). The video style was classified into physician solo narration, patient experience sharing, as well as question and answer, while the video background was classified into medical scenarios, life scenarios and PowerPoint or animation. Based on the video content, the videos were categorized into seven groups: (1) definition, (2) epidemiology, (3) etiology, (4) symptoms and (5) diagnosis, (6) treatment/prevention and (7) prognosis. To quantify regional heterogeneity, we split the videos into five groups: (1) first-tier cities, (2) emerging first-tier cities, (3) second-tier cities, (4) third-tier cities, and (5) fourth-tier cities according to the geographical location of city administrative levels in China. 17 The scoring criteria included commercial resource concentration, urban hub connectivity, urban population activity, new economy competitiveness and future flexibility. The details for city categorization are present in Table 2.
Categorization of video sources.

SSNHL: sudden sensorineural hearing loss.
Categorization of Chinese city administrative levels (2024).

Note: The categorization was based on commercial resource concentration, urban hub connectivity, urban population activity, new economy competitiveness and future flexibility.
Assessments of video quality
Prior to assessment, all researchers rigorously reviewed the scoring criteria of five instruments used in our study, including modified DISCERN (m-DISCERN), Global Quality Score (GQS), Goobie's coding scheme, the Journal of the American Medical Association (JAMA) benchmarks, and Video Information and Quality Index (VIQI). Two researchers (TN and YJ) independently assessed the video quality via these five instruments between 8 and 17 June 2025. The discrepancies of scoring between two researchers were resolved through discussion and consultation with a third arbitrator (ZH), if the scores of two researchers were inconsistent. Then the arbitrator made the final decision. The reliability of scoring was also quantified using Cohen's kappa coefficient (κ). The intervals of Cohen coefficient κ indicated: > 0.80, consistent; 0.61–0.80, substantial; 0.41–0.60, moderate; ≤ 0.40, poor. 18
The m-DISCERN instrument was derived from the original DISCERN developed by Singh et al. and consisted of five items including the clarity of aims, credible sources, impartially presented information, supplementary sources listed for reference and uncertainty mentioned. 19 Each item followed dichotomous scoring 0–1, and the total scores ranging 0–5 reflected the reliability degree; the higher the score, the more excellent reliability. The GQS instrument was a validated 5-point scale developed by Bernard et al. for evaluation of website and video quality. 20 The instrument quantified content value across dimensions including accuracy, structure, and usefulness, with scores anchored at 1 (poor) and 5 (superior). Higher GQS scores indicated better educational effectiveness. The detailed standards of GQS scoring are provided in Table 3.
The detailed standards of Global Quality Scale (GQS) scoring for the quality assessment of SSNHL-related short videos on TikTok.
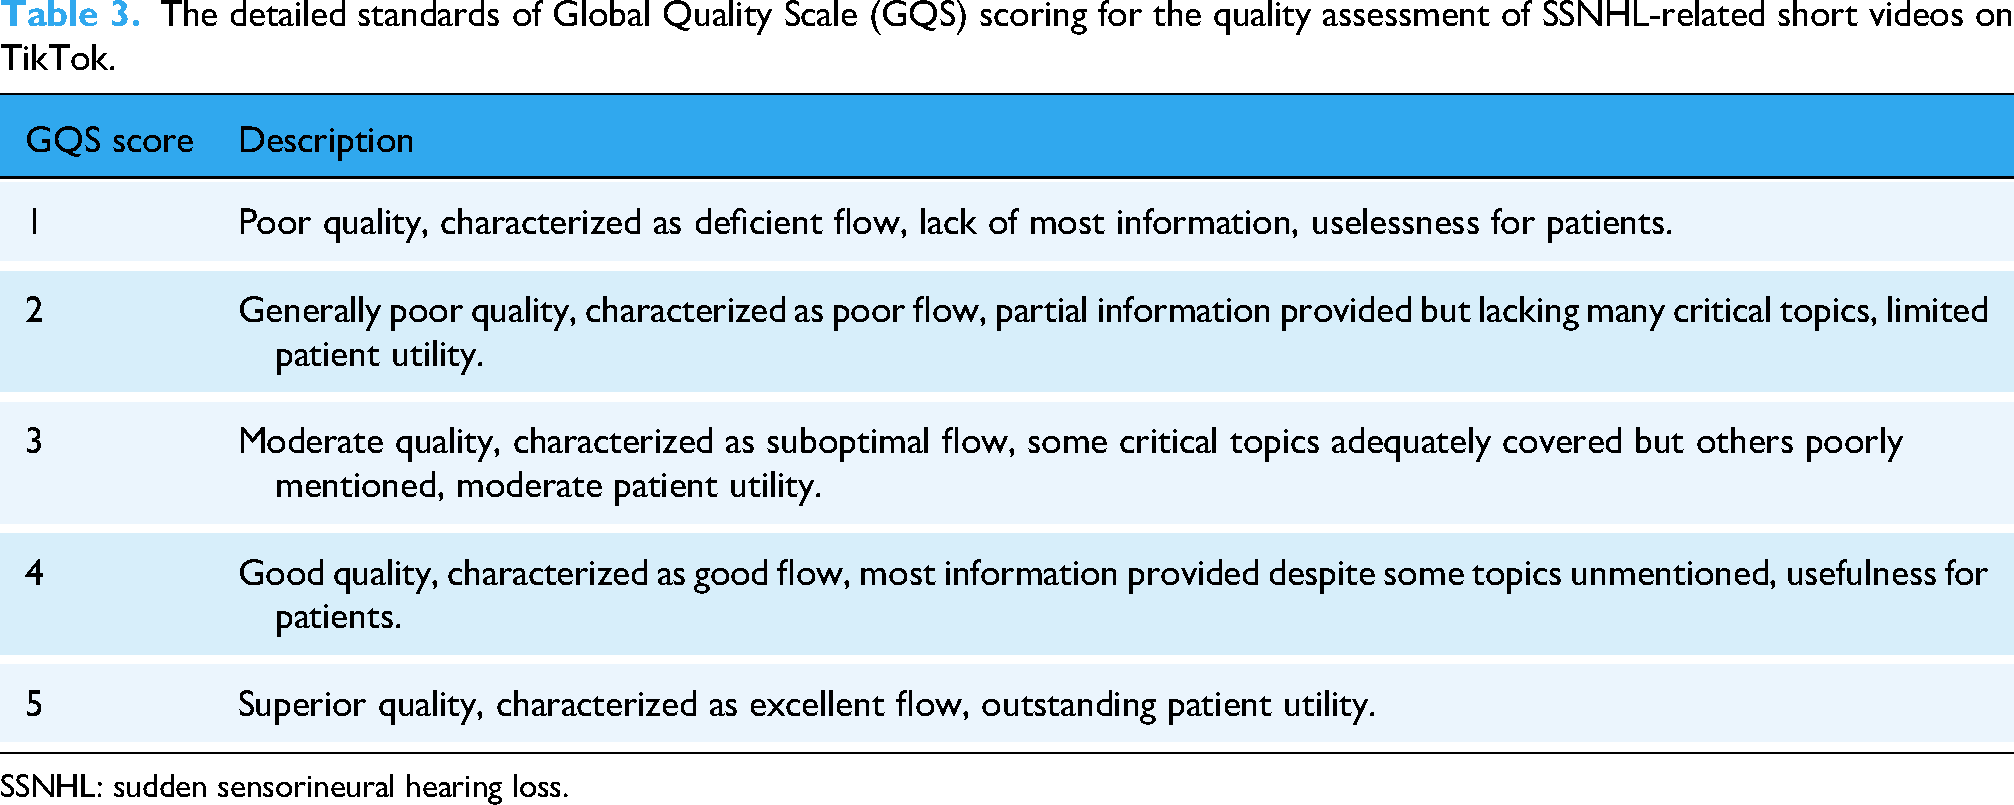
SSNHL: sudden sensorineural hearing loss.
The video content coverage was evaluated using Goobie's coding scheme to assess disease definition, symptoms/signs, risk factors, diagnostic evaluation, therapeutic management, and clinical outcomes. 21 Each of the six aspects was scored: 0 = content absent, 0.5 = minimal content, 1 = partial content, 1.5 = substantial content and 2 = comprehensive coverage. The transparency and reliability of video content was assessed using JAMA benchmarks. 22 The instrument evaluates four essential parameters: authorship, including authors, contributors, credentials and affiliations; source attribution, references and copyright information; currency, including website ownership, sponsorship, underwriting, advertising, commercial funding support and potential conflicts of interest; disclosure of posted and updated dates. Each parameter scored 1 point toward a maximum total score of 4, and the video transparency and reliability were positively correlated with the total score. The VIQI instrument was employed to evaluate the educational utility of video from four domains: information flow, content accuracy, production quality (including image, animation, interview, captions and summary) as well as consistency between title and content. The scores of each domain range from 1 to 5, with the higher score indicating superior educational value. These standardized instruments above corresponded to current methodology and were validated in previous multimedia medical education research.23–25
Statistical methods
The statistical analyses in this study were performed using IBM SPSS 25.0 (IBM Corp). Firstly, the Shapiro–Wilk test was used to judge the normality of quantitative data, with the data expressed as median, interquartile range (IQR) and min–max values due to nonnormally distribution. Quantitative data were analyzed using nonparametric tests (Mann–Whitney U for two groups, Kruskal–Wallis with Dunn's post hoc for over three groups) to elucidate the differences. Secondly, categorical data were reported in terms of frequency and percentage and compared using Chi-square test, or Fisher's exact test, or continuity correction. Lastly, Spearman correlation analyses were conducted to uncover the link among m-DISCERN, GQS, Goobie, JAMA and VIQI instruments as well as between these five instruments and audience engagement. The intervals of correlation coefficient r indicated: r > 0, positive correlation; r < 0, negative correlation; |r|≤0.2, no correlation; |r|=0.21–0.40, slight correlation; |r|=0.41–0.60, moderate correlation; |r|=0.61–0.80, strong correlation. 26 Statistical significance for all analyses was defined as two-tailed p < .05.
Results
Video characteristics and sources
Our study ultimately included 174 TikTok videos for further analysis, after excluding one video recorded not in Chinese, two duplicates, 24 similarities, seven irrelevance and seven videos without dubbing. The TikTok videos were uploaded from 19 May 2022 to 21 May 2025, with 196,261 likes, 30,537 comments, 76,117 shares, and 61,377 collections. The median length of videos was 51 s (IQR (25th-75th): 35–77; min–max: 11–1041), and the SSNHL videos had a median duration of 219.5 days (IQR (25th–75th): 88–495.5; min–max: 11–1839), exhibiting considerable variation. Of the 174 videos, 157 (90.3%) were produced by the healthcare practitioners or agencies, while the remaining 17 (9.7%) posted by the nonhealthcare group. The highest proportion of TikTok videos were from senior physicians (n = 135, 77.6%), followed by patients (n = 14, 8.0%), junior physicians (n = 13, 7.5%), health institutions (n = 9, 5.2%) and science communicators (n = 3, 1.7%) in Figure 2. The videos uploaded by the healthcare group had significantly more likes/30 days, shares/30 days, collections, and collections/30 days compared to others from the nonhealthcare group. The details of likes, likes/30 days, comments, comments/30 days, shares, shares/30 days, collections, collections/30 days are shown in Table 4.

Sources of SSNHL-related short videos on TikTok.
Characteristics of SSNHL-related short videos on TikTok.

Note: SSNHL: sudden sensorineural hearing loss.
p-values were calculated through Mann–Whitney U test.
IQR = P25–P75.
Range = Min–Max.
In terms of video style, question and answer was the most frequent on the total (51.7%) and the healthcare group (56.7%), while the nonhealthcare group focused on patient experience sharing (88.2%). Regarding the video background, medical scenery was predominant on the total (90.8%) and the healthcare group (97.4%), while the nonhealthcare group tended to provide videos within life scenery (52.9%). Prognosis was the most popular content accounting for 60.9%, followed by treatment/prevention (54.6%), etiology (38.5%), symptom (34.5%), diagnosis (21.3%), definition (18.4%) and epidemiology (7.5%). There was no statistically significant difference in the distribution of video content between the healthcare and nonhealthcare group (p > .05). The other details are shown in Table 5.
Distribution of video styles, backgrounds, and content categories.

Note: aChi-squared test.
Continuity correction.
Fisher's exact test.
Video uploaders
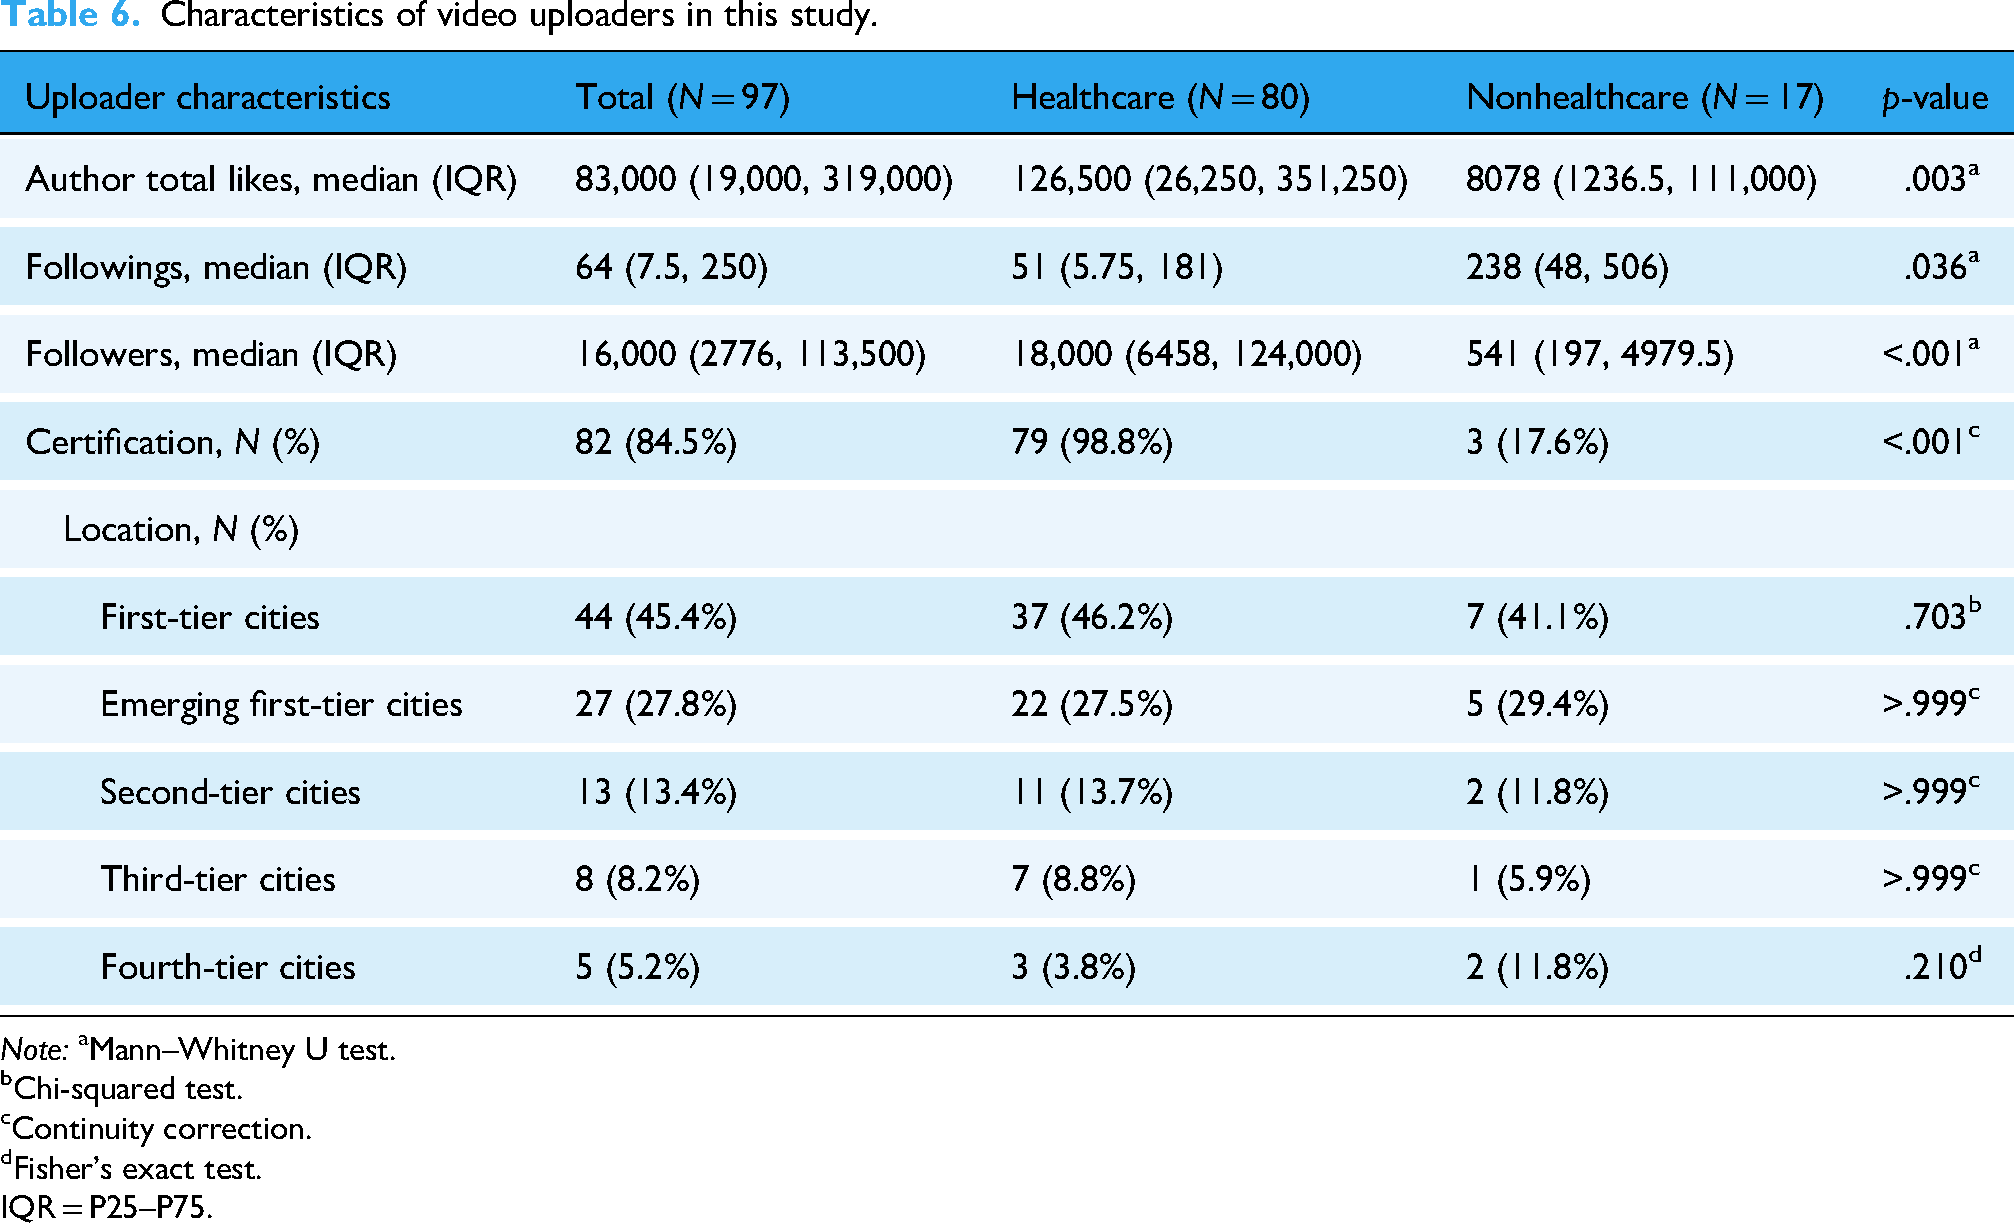
There were 80 healthcare and 17 nonhealthcare uploaders on TikTok in our study. Healthcare authors achieved more total likes and followers than nonhealthcare authors, with the median of 126,500 (IQR: 19,000–319,000) and 18,000 (IQR: 6458–124,000), respectively, and there were statistically significant differences (p < .05). Additionally, statistically significant difference was observed in followings between healthcare and nonhealthcare authors (p = .036). Most of the healthcare uploaders possessed the verification status (98.8%). The uploaders from first-tier cities contributed largest number of videos (45.4%), followed by emerging first-tier cities (27.8%), second-tier cities (13.4%), third-tier cities (8.2%) and fourth-tier cities (5.2%). There was no statistically significant difference in the distribution of geographical location between the healthcare and nonhealthcare group (p > .05). The characteristics of video uploaders for details are presented in Table 6.
Characteristics of video uploaders in this study.
Note: aMann–Whitney U test.
Chi-squared test.
Continuity correction.
Fisher's exact test.
IQR = P25–P75.
Video quality
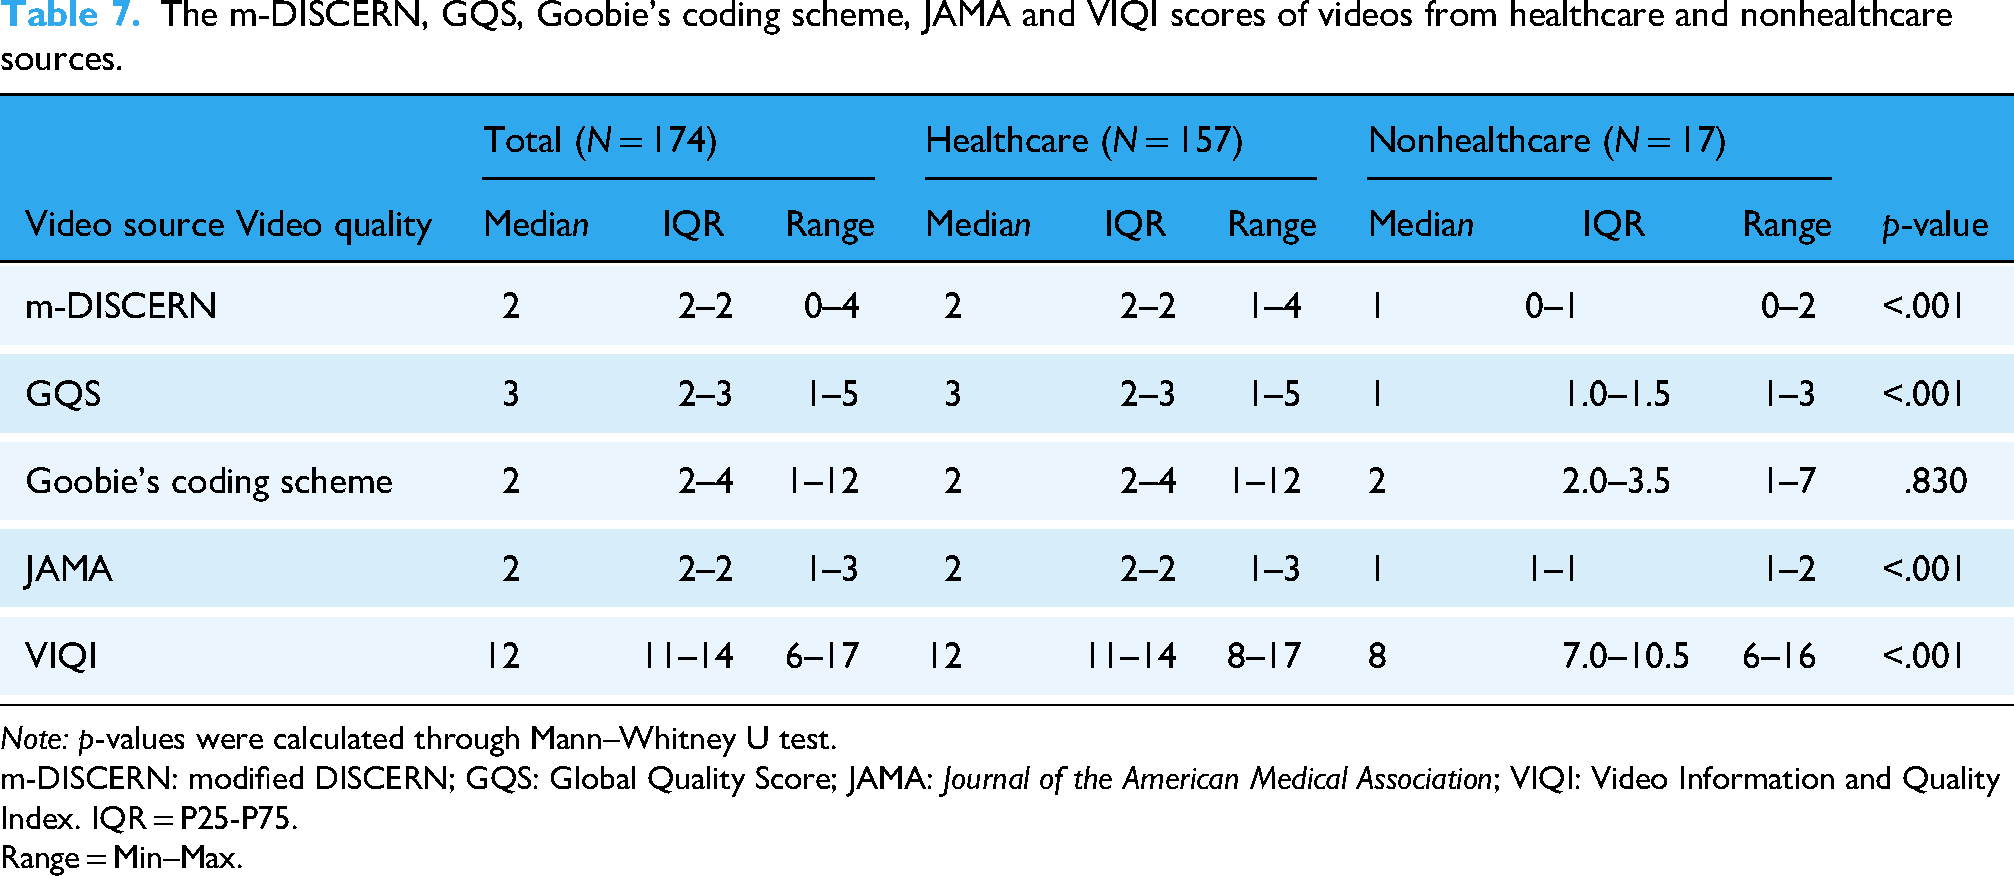
The scores from two researchers had substantial interobserver reliability (κ value = 0.76). The overall median m-DISCERN, GQS, Goobie's coding scheme, JAMA and VIQI scores for SSNHL-related TikTok videos were 2 (IQR 2–2), 3 (IQR 2–3), 2 (IQR 2–4), 2 (IQR 2–2), and 12 (IQR 11–14), respectively. Regarding the video sources, the healthcare group scored higher m-DISCERN, GQS, JAMA and VIQI scores than the nonhealthcare group (p < .001) (Table 7), and junior physicians JAMA scores were significantly better than senior physicians (p = .031) ( Table 8 ). Videos from uploaders with certification generally outperformed noncertification in m-DISCERN, GQS, JAMA and VIQI scores (Table 9).
The m-DISCERN, GQS, Goobie's coding scheme, JAMA and VIQI scores of videos from healthcare and nonhealthcare sources.
Note: p-values were calculated through Mann–Whitney U test.
m-DISCERN: modified DISCERN; GQS: Global Quality Score; JAMA: Journal of the American Medical Association; VIQI: Video Information and Quality Index. IQR = P25-P75.
Range = Min–Max.
The m-DISCERN, GQS, Goobie's coding scheme, JAMA and VIQI scores of videos from senior physician and junior physician sources.

Note: p-values were calculated through Mann–Whitney U test.
m-DISCERN: modified DISCERN; GQS: Global Quality Score; JAMA: Journal of the American Medical Association; VIQI: Video Information and Quality Index.
IQR = P25–P75.
Range = Min–Max.
The m-DISCERN, GQS, Goobie's coding scheme, JAMA and VIQI scores of videos from uploaders with certification and noncertification.

Note: p-values were calculated through Mann–Whitney U test.
m-DISCERN: modified DISCERN; GQS: Global Quality Score; JAMA: Journal of the American Medical Association; VIQI: Video Information and Quality Index.
IQR = P25–P75.
Range = Min–Max.
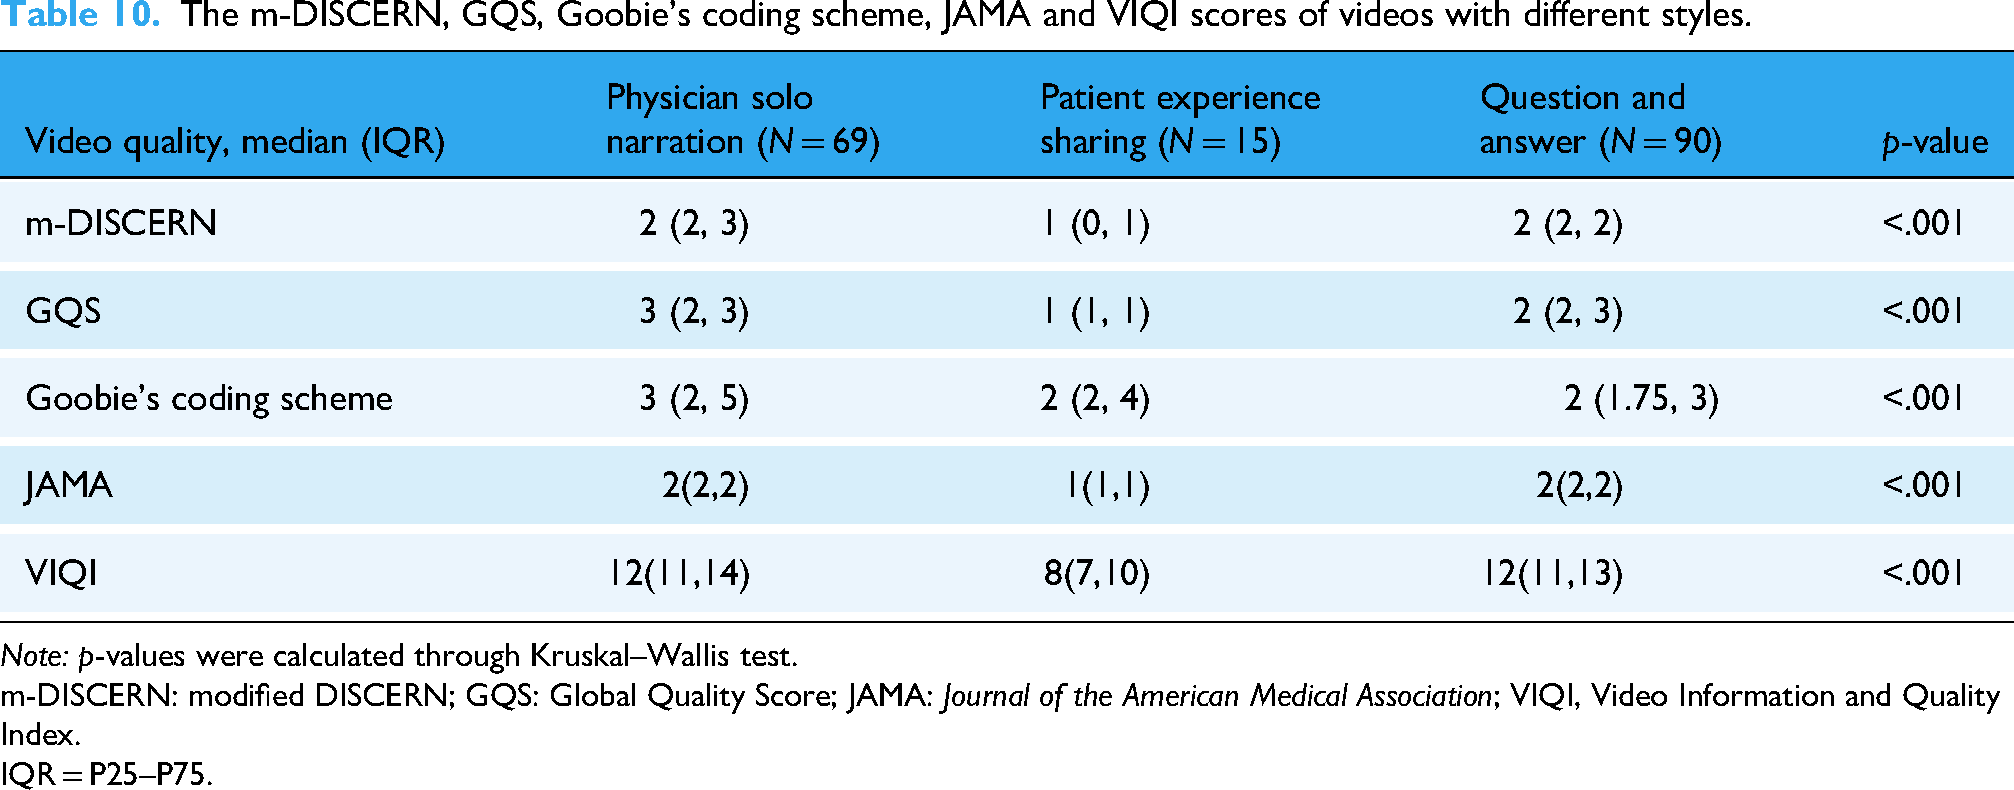
Compared to patient experience sharing, videos in forms of physician solo narration and question and answer generally achieved higher m-DISCERN, GQS, JAMA and VIQI scores with statistically significant differences (p < .05). The physician solo narration videos scored more m-DISCERN, GQS, and Goobie's coding scheme scores than question and answer (p < .001) (Table 10). The median m-DISCERN and JAMA scores of medical scenario videos were better than life scenario and PowerPoint or animation (p < .05), and the medical scenario videos also scored higher GQS and VIQI scores than Life scenario videos (p < .001). There was no statistically significant difference in median Goobie scores among three video backgrounds (Table 11). In terms of city administrative levels, JAMA scores indicated that videos from uploaders in first-tier cities, emerging first-tier cities, second-tier cities, and third-tier cities published more reliable videos than those in fourth-tier cities (p < .05). No statistically significant difference was observed among other groups and in other scales (p > .05) (Table 12).
The m-DISCERN, GQS, Goobie's coding scheme, JAMA and VIQI scores of videos with different styles.
Note: p-values were calculated through Kruskal–Wallis test.
m-DISCERN: modified DISCERN; GQS: Global Quality Score; JAMA: Journal of the American Medical Association; VIQI, Video Information and Quality Index.
IQR = P25–P75.
The m-DISCERN, GQS, Goobie's coding scheme, JAMA and VIQI scores of videos with different backgrounds.

Note: p-values were calculated through Kruskal–Wallis test.
m-DISCERN: modified DISCERN; GQS: Global Quality Score; JAMA: Journal of the American Medical Association; VIQI: Video Information and Quality Index.
IQR = P25–P75.
The m-DISCERN, GQS, Goobie's coding scheme, JAMA and VIQI scores of videos from uploaders in different city tiers.

Note: p-values were calculated through Kruskal–Wallis test.
m-DISCERN: modified DISCERN; GQS: Global Quality Score; JAMA: Journal of the American Medical Association; VIQI: Video Information and Quality Index.
IQR = P25–P75.
Correlation analysis
Spearman correlation analyses were performed due to nonnormally distributed data. The results showed statistically positive correlations between m-DISCERN score and GQS (r = 0.570, p < .001), Goobie's coding scheme (r = 0.268, p < .001), JAMA (r = 0.623, p < .001), VIQI (r = 0.440, p < .001) score. Likewise, GQS score was positively correlated with Goobie's coding scheme (r = 0.413, p < .001), JAMA (r = 0.503, p < .001), and VIQI (r = 0.586, p < .001) score; JAMA score was significantly correlated with VIQI (r = 0.495, p < .001) score (Figure 3).
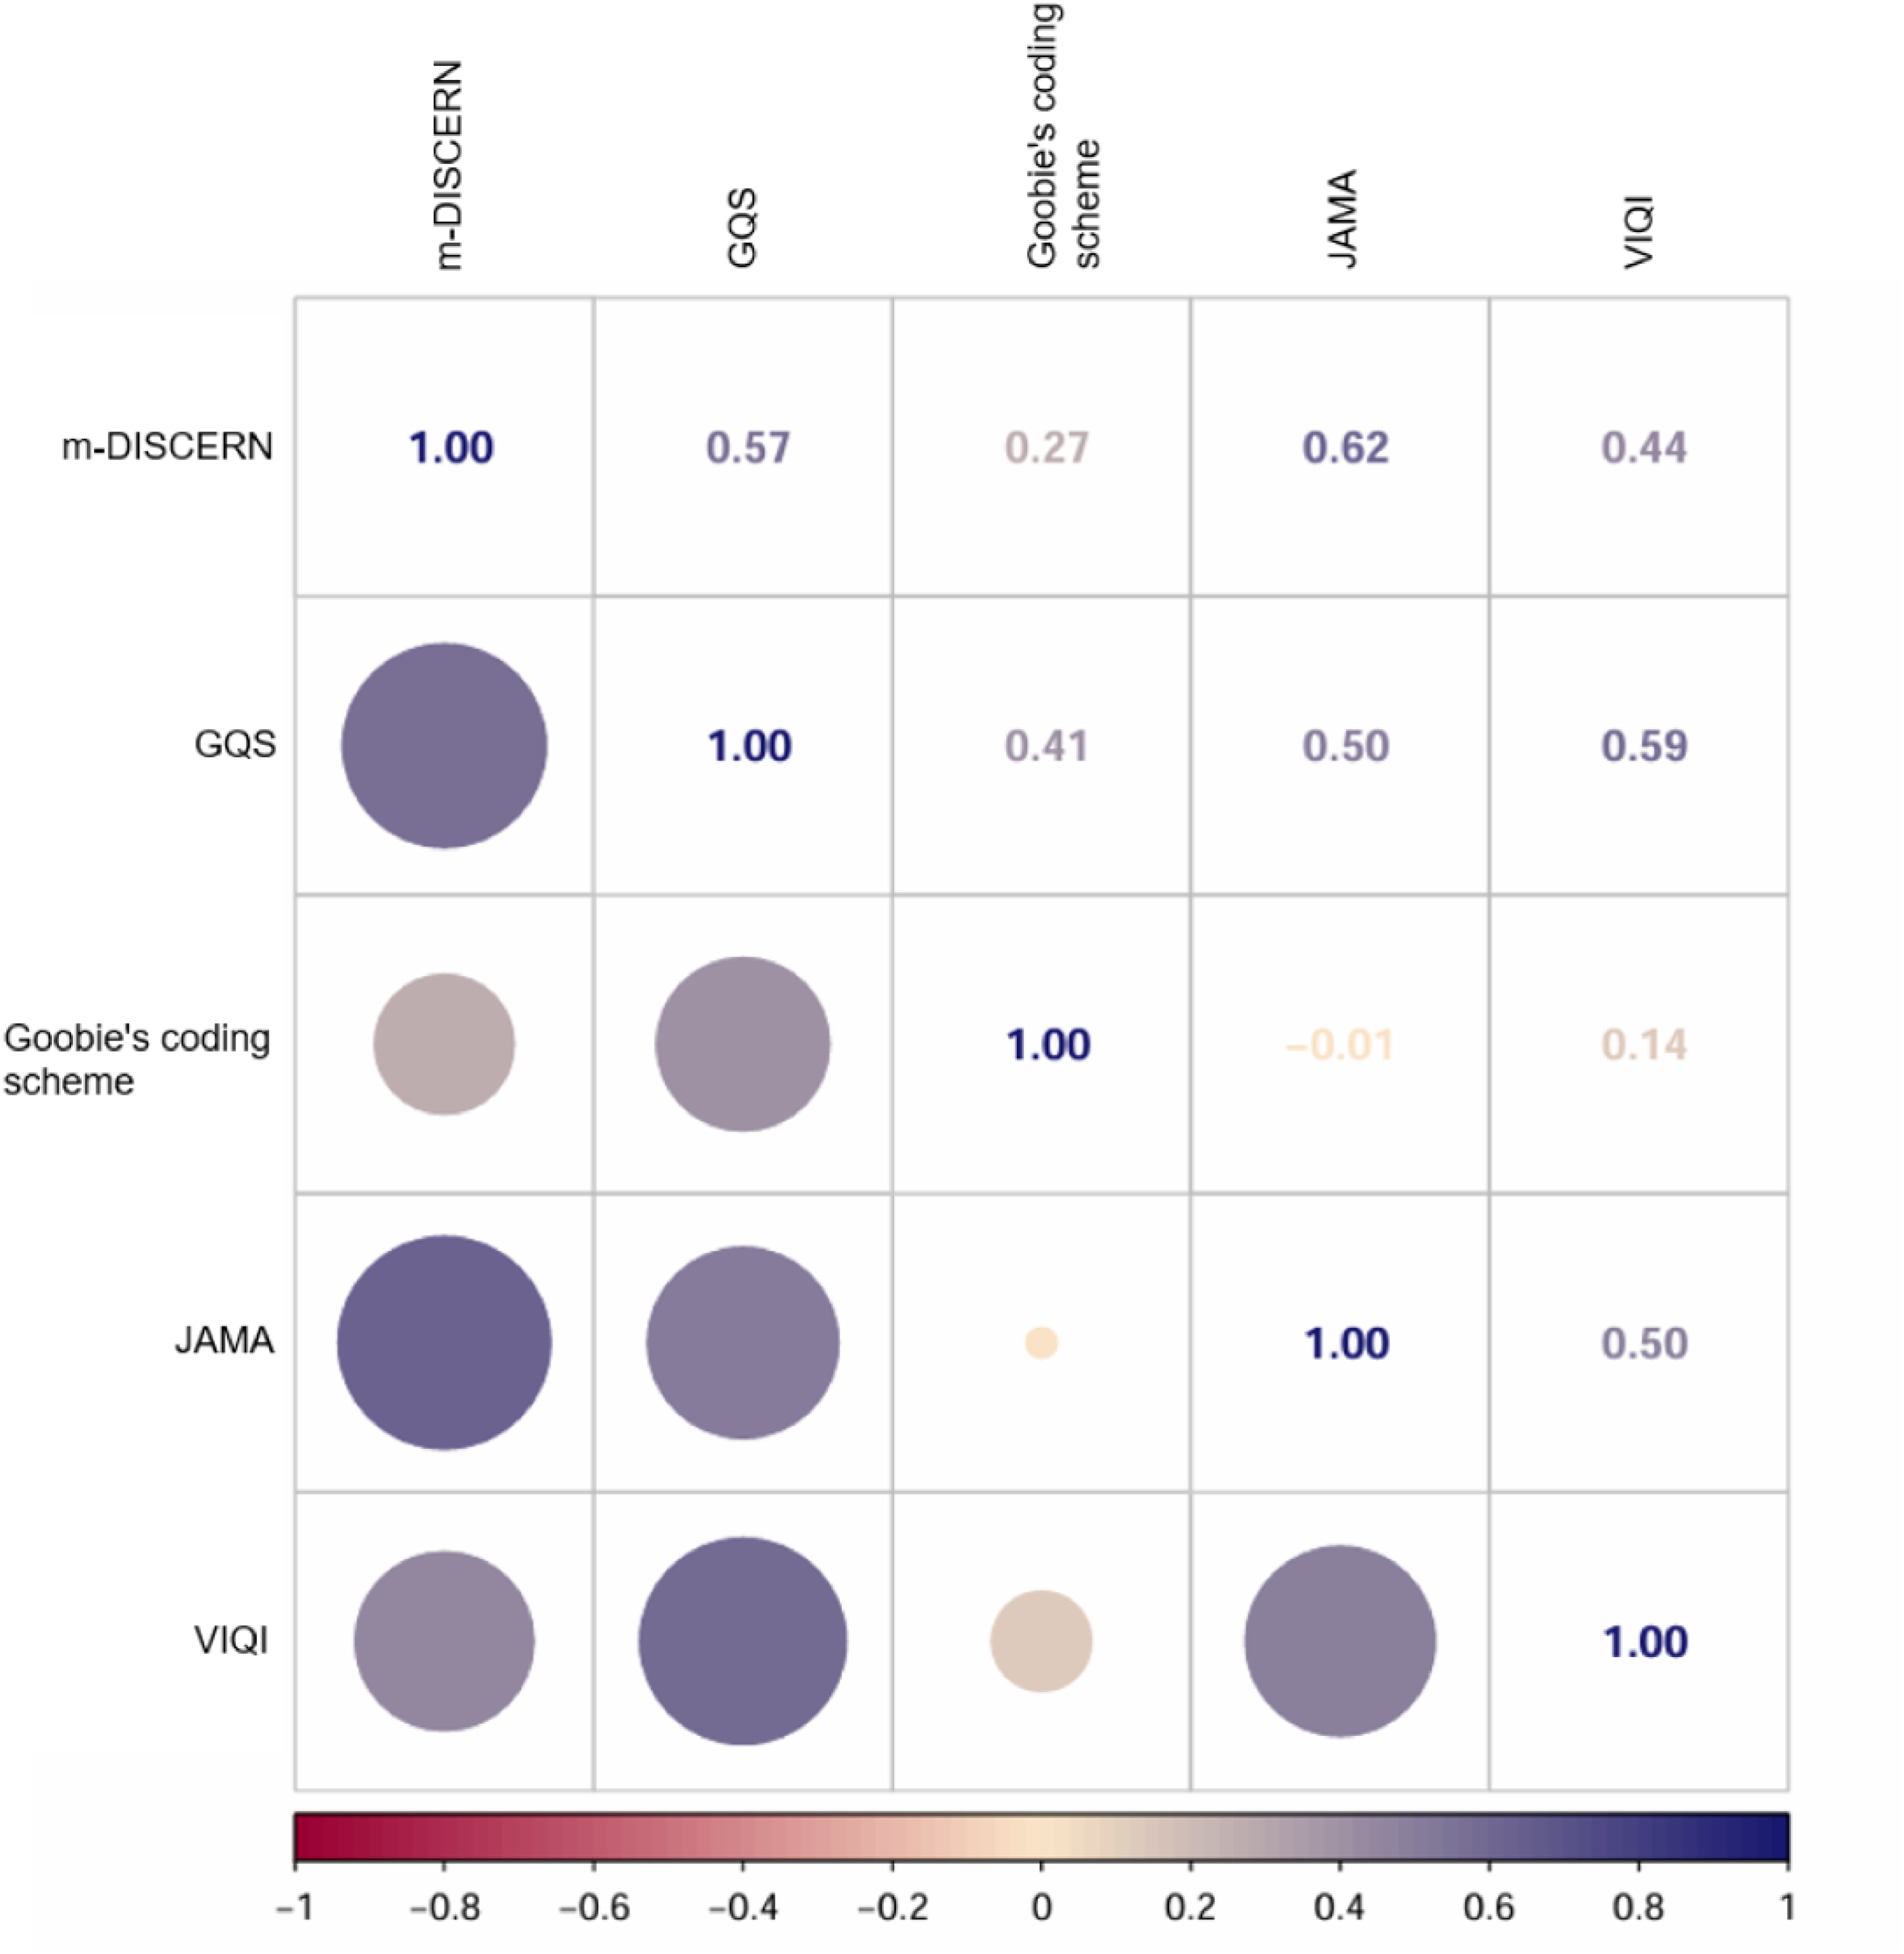
Spearman correlation analysis among m-DISCERN, GQS, Goobie's coding scheme, JAMA and VIQI scores.
The following variables between scale score and audience engagement revealed positive correlations. Moderate correlations included GQS and shares (r = 0.446, p < .001), and slight correlations included m-DISCERN and shares (r = 0.284, p < .001), m-DISCERN and shares/30 days (r = 0.231, p = .002), m-DISCERN and collections (r = 0.269, p < .001), GQS and likes (r = 0.352, p < .001), GQS and shares/30 days (r = 0.331, p < .001), GQS and collections (r = 0.396, p < .001), GQS and collections/30 days (r = 0.229, p = .002), JAMA and likes/30 days (r = 0.206, p = .007), JAMA and shares (r = 0.233, p = .002), JAMA and shares/30 days (r = 0.262, p < .001), JAMA and collections (r = 0.276, p < .001), JAMA and collections/30 days (r = 0.291, p < .001), VIQI and likes (r = 0.342, p < .001), VIQI and shares (r = 0.355, p < .001), VIQI and shares/30 days (r = 0.259, p = .001), VIQI and collections (r = 0.361, p < .001) (Figure 4).

Spearman correlation analysis between the scores and audience engagement. m-DISCERN: modified DISCERN; GQS: Global Quality Score; JAMA: Journal of the American Medical Association; VIQI: Video Information and Quality Index.
Discussion
Principal findings
As the critical information carrier for public health education, the increasing usage of social media in medical education has effectively eliminated the physical barriers that traditionally hindered access to healthcare resources.27,28 Approximately 70% American adults were reported to take the Internet as the primary source of their health information, 29 and the similar situation occurred in China during the era of online videos. The rapid development of TikTok provides a convenient and efficient method of integrating health education into short videos.30,31 The overall quality of these videos varied and therefore raised public significant concerns about misleading information. Our study investigated the quality of SSNHL-related short videos. The majority (157/174, 90.2%) of SSNHL-related TikTok videos was produced by healthcare source, but the quality and reliability were not satisfying as expected, suggesting constrained practical applicability. Besides, the positive correlations between video quality and audience engagement were limited. This indicates that high engagement can be achieved despite even low-quality videos, as audience attention is likely captured by nonproduction variables including celebrity involvement, resonance, and music. The results provided several valuable observations.
Audience engagement and quality of short videos about SSNHL
Our results indicated the 174 SSNHL-related videos on TikTok garnered 196,261 likes, 30,537 comments, 76,117 shares, and 61,377 collections in our study, demonstrating the platform's viability for health communication. The number of likes, likes/30 days, comments, comments/30 days, shares, shares/30 days, collections, collections/30 days for a short video could mirror the popularity to some degree. 32 Compared to nonhealthcare loaders, videos produced by healthcare loaders tended to be of more popularity, probably due to recognition for authority and professionalism. And healthcare uploaders exhibited comparatively superior video production quality. However, the overall quality and reliability of SSNHL-related videos from TikTok were unsatisfying, although a large proportion of the videos were posted by healthcare (90.2%) and certified (84.5%) uploaders under strict verification rules. Especially according to Goobie's coding scheme, the videos from healthcare and nonhealthcare uploaders were considered as homogeneously poor in content comprehensiveness, consistent with the findings of Wang et al. 10 Consequently, the quality of videos produced by medical professionals could also be inadequate. The constraints, including video brevity constrained by length limits, superficial content coverage and inadequate source attribution contributed to the finding. Notably, the transparency (evaluated by JAMA benchmarks) of videos uploaded by junior physicians were marginally superior to those from senior physicians, suggesting professional rank does not inherently predict excellence. The identification of “unsatisfying quality” could prevent inaccurate or outdated information from misleading patient education and hindering patient outcomes. 33 Obviously, it is critical to incentivize senior clinical experts to facilitate the generation of evidence-based authoritative content. The recent multimethod analysis on tonsillectomy-related YouTube video content affirmed the potential role of human experts and artificial intelligence (AI) in the identification of low-quality video content. 33 And by employing AI as a supportive tool, low-quality video content could be more efficiently identified and flagged, which would reduce patient exposure to misinformation. Future research should focus on developing more effective methods for the selection of low-quality video content to ensure scientific clinical decision-making.
To further characterize the videos, we classified them according to four dimensions: content coverage, presentation style, background and the administrative level of uploaders’ cities. Results revealed that the completeness of content coverage was insufficient, most of which focused on prognosis, followed by treatment/prevention and symptoms. The prognosis of SSNHL was highlighted for significance, closely related to early detection and timely management. 34 In terms of video style and background, medical questions and answers predominated, typically presented within medical scenarios like physician solo narration. Videos featuring medical scenarios or healthcare practitioners are more authoritative, thus more likely to gain the trust from audience. 35 One of the drawbacks of these videos is the limitation of the visual content amount, and PowerPoint or animation could make up for the drawback to a certain extent. 36 Therefore, incorporating a few easily understandable PowerPoint or animations into videos of medical scenarios presents a potentially effective method for conveying high-quality medical information.
There were 45.4% (44/97) uploaders from first-tier cities, 54.0% (94/174) videos produced from uploaders in first-tier cities, and primarily from healthcare sources. The higher the city tier, the greater the volume of videos generated. Videos originating from uploaders in fourth-tier cities demonstrated inferior transparency (evaluated by JAMA benchmarks) than those in higher-tier cities, which was consistent with the recognized disparity in healthcare resource distribution across China's urban hierarchy. However, the observed overall difference in quality, understandability and usefulness was not significant, suggesting the magnitude of the disparity could not inherently justify the common practice of patients bypassing regional healthcare options in favor of seeking care exclusively in major metropolitan centers under the presumption of substantially superior healthcare quality. The reflexive pursuit of resources in top-tier cities carries potential delays in initiating treatment and the optimal therapeutic intervention, leading to poorer clinical outcomes despite the eventual access to elite institutions. 37
Correlation among instruments and between instruments and flow
The correlation analyses of these five instruments demonstrated moderate or strong positive correlation among m-DISCERN, GQS, JAMA and VIQI scores, indicating that there existed great convergent validity. The finding is generally consistent with prior research about neurorehabilitation videos for multiple sclerosis on YouTube. 38 We found that Goobie's coding scheme showed generally low correlations with the other four instruments (m-DISCERN, GQS, JAMA, and VIQI), indicating that Goobie's coding scheme could be less suitable in evaluating the quality of short videos. The discrepancy could be attributed to the fact that Goobie's coding scheme was originally developed in assessing longer videos that are more likely to enhance content coverage and video quality simultaneously. 21 Compared with the other four instruments, Goobie's coding scheme placed more emphasis on measuring content coverage. The results also suggested the content coverage was not always related to the overall quality of the videos.
Our study demonstrated that the relationship between audience engagement and the quality of videos was not strong, except the moderate association between GQS and shares. The finding aligns with previous research on TikTok and Bilibili video quality evaluation, 39 and the negative correlations between audience engagement and video quality were also reported in some studies.40,41 Perhaps, the popularity of the videos could not fully reflect the quality, and the audience failed to precisely distinguish the videos of low-quality and high-quality. Therefore, audience should be vigilant rather than attributing credibility uncritically based solely on flow. To effectively address the issue, the platform must reform algorithmic governance frameworks that prioritize scientific rigor: implement weighted value assignment for evidence-based content in recommendation systems; establish the evaluation system that prioritizes scientific validity and takes flow as a secondary consideration; mandate peer-validated reviews on the content of videos before publication.
Strengths and limitations
We selected TikTok as our sole research platform. TikTok operates as a short-form video platform, resulting in high user retention and rapid content dissemination. So far, TikTok is one of the largest and most popular short-video platforms in China, with the highest audience engagement. 42 Secondly, TikTok content uploaders routinely facilitate video fragmentations, segmenting longer videos into serialized short videos, thereby increasing the number of videos and providing a sufficient sample size for our study. 26 Thirdly, TikTok has stricter certification requirements compared to other platforms (such as Bilibili) and constrains the engagement of resident physicians, primary healthcare practitioners, and medical students to enhance the authority of videos. Therefore, TikTok was selected as the paradigmatic platform for this study. Our study used five validated instruments of m-DISCERN, GQS, Goobie's coding scheme, JAMA, and VIQI to evaluate the multidimensional quality variations of SSNHL-related short videos on the TikTok platform. Each instrument targets defined core dimensions: m-DISCERN overviews the content reliability, 19 GQS rates the educational effectiveness, 20 Goobie's coding scheme checks content comprehensiveness, 21 JAMA verifies video transparency, 22 and VIQI measures the impact of audience engagement and educational value. 43 The results provided valuable insights into SSNHL-related video content and emphasized the significance of prompt improvement for its content, to ensure the quality of medical knowledge dissemination and enhance public health communication.
There are also several limitations in our study. The instruments for video evaluation remain to be refined despite their wide application. Although we had used five instruments and three well-trained doctors to rate the score, potential systematic bias remains unavoidable. Secondly, certain data (such as the views and negative opinions of TikTok videos) are unavailable due to the platform restrictions. Thirdly, the generalizability of our findings might be constrained by heterogeneous platforms or linguistic environment, so it is necessary to conduct future studies in YouTube, Bilibili platforms and other countries. Finally, our study is cross-sectional and future longitudinal studies are warranted to examine the changes of short-video quality with social development and algorithmic refinement.
Conclusion
The study uses five validated instruments to evaluate the quality of SSNHL-related short video on Chinese TikTok. In general, videos from healthcare entities demonstrate greater flow and superior quality relative to nonhealthcare, but the overall quality and content coverage remains suboptimal. The limited correlations between audience engagement and video quality necessitate resisting reliance on flow as a sole criterion. Given the urgency of SSNHL, viewers identifying misleading information, experts producing more videos of high-quality, the platform reforming algorithmic frameworks and prioritizing scientific rigor are essential for promoting public health education.
Footnotes
Abbreviations
Acknowledgments
The authors express appreciation to the video uploaders and participants on TikTok. The authors acknowledge the reviewers of the manuscript.
Ethical approval
This study involved no human specimens, animal subjects or clinical datasets. All data and information involved in our secondary analysis was publicly available at the time of data collection on TikTok videos without any personal privacy implications and active interaction with users. Therefore, individual consent was not required for use. Our study was approved by the institutional review board of Huadong Hospital affiliated to Fudan University, China (No. 2025K338). This study conformed to TikTok user guidelines.
Author contributions
TN conceived and designed the study; SY, JR, GD, and ZL collected the data; TN, YJ, and ZH reviewed and scored the videos; YH, JZ, and HX analyzed the data; TN wrote the original draft; TN, YJ, and ZH reviewed and edited the manuscript.
Generative AI statement
The authors declare that no Generative AI tools were used in the development or editing of this article.
Funding
The authors disclosed receipt of the following financial support for the research, authorship, and/or publication of this article: This work was supported by the Science and Technology Innovation Plan of Shanghai Science and Technology Commission (Grant No. 20Y11902300).
Declaration of conflicting interests
The authors declared no potential conflicts of interest with respect to the research, authorship, and/or publication of this article.
Data availability statement
The data from TikTok were anonymized to ensure participant privacy. Requests for data access can be directed to the corresponding author (Guarantor Zhao Han) upon request for legitimate research purposes, privacy protection and data sharing policies.