
Abstract
Objectives
Thalassemia trait (TT) screening in resource-limited settings is hampered by reliance on expensive and complex tests. This study aimed to develop and validate a highly accessible machine learning-based tool using only routine blood parameters to accurately differentiate TT from non-TT and its major subtypes.
Methods
The retrospective study included 987 individuals (221 α-TT, 211 β-TT and 555 non-TT) from two medical centers. Seven machine learning methods—Logistic Regression, Gaussian Naive Bayes, Decision Tree, Random Forest, Multilayer Perceptron, XGBoost, and CatBoost—were employed to develop diagnostic models, which were evaluated using accuracy, sensitivity, specificity, AUC, PPV, NPV, and F1 score.
Results
The CatBoost model emerged as superior for differentiating TT from non-TT, achieving an AUC of 0.976, accuracy of 0.940, and specificity of 0.981. It also outperformed other models in distinguishing α-TT from β-TT (AUC = 0.842). Critically, this high-performance model was successfully deployed as a user-friendly WeChat mini-program AI Lab, for real-world clinical application.
Conclusion
The deployed ML-based AI Lab represents a robust, interpretable, and scalable tool poised to enhance TT screening efficiency and accessibility, particularly in underserved healthcare environments.
Keywords
Introduction
Thalassemia trait (TT) is a hereditary hemolytic anemia caused by a mutation or deletion in the red blood cell genes that leads to impaired globin production. 1 TT can be classified into α-TT and β-TT based on the type of gene involved, which affects different peptide chains in hemoglobin synthesis. 2 Many individuals with thalassemia may exhibit no obvious clinical symptoms or only mild anemia, often discovered incidentally during routine health check-ups or other health investigations. 3 Unfortunately, these cases are frequently overlooked, and if the individual's health deteriorates or concurrent diseases manifest, the symptoms of anemia may worsen.4–6 Pregnant women, a crucial demographic for anemia screening, currently rely on invasive techniques such as amniocentesis, chorionic villus sampling, and cord blood puncture for prenatal diagnosis, which pose certain risks including potential miscarriage. 7 Therefore, early screening and prevention of thalassemia are crucial in preventing the birth of children with severe forms of the disorder. Current TT detection methods rely heavily on manual inspection of red blood cell parameters for initial screening, complemented by hemoglobin electrophoresis and genetic testing for diagnostic confirmation, along with iron studies to differentiate from iron deficiency anemia.8,9 However, conducting hemoglobin electrophoresis and genetic testing necessitates a high level of expertise from laboratory staff, creating challenges for healthcare facilities in rural and underprivileged areas, ultimately impeding accurate thalassemia diagnosis.10,11 Furthermore, the comprehensive testing panel imposes a financial burden on individuals undergoing screening. These diagnostic challenges, particularly pronounced in resource-limited regions, underscore an urgent and unmet clinical need for a simplified, cost-effective, and widely applicable screening methodology. This approach aims to enhance the efficiency of thalassemia screening and diagnosis, facilitating early intervention to prevent the transmission of the disorder.
Artificial Intelligence (AI) combines human-like intelligence with advanced computational power, fostering innovative and novel problem-solving approaches.12,13 AI has proven instrumental in developing models for TT identification, exhibiting exceptional diagnostic accuracy. Popular machine learning techniques include Decision Tree (DT), Artificial Neural Network (ANN), K-Nearest Neighbor (KNN), Random Forest (RF), Support Vector Machine (SVM), among others.14–16 Compared to traditional statistical methods, machine learning shows superior generalization capabilities. Enabling effective handling of vast datasets and being widely used in different fields. 17 This technical advantage highlights its significant applicability in a variety of medical scenarios. 18 In the field of TT research, several studies have made notable progress. Early research applied simple statistical and machine learning methods such as KNN, SVM, and ANN for performing preliminary analyses on clinical and hematological data. Amendolia et al. 19 were among the first to validate the effectiveness of ANNs in distinguishing α-TT and β-TT carriers based on blood parameters. Wongseree et al. 20 explored the application of genetic programming (GP) in thalassemia classification, providing a novel perspective for developing automated diagnostic tools in this field. Early models, however, were simple, limited in feature processing and learning capacity, and analyzed only a narrow range of data, leaving model performance insufficiently validated.
To deepen research, recent years have seen broader investigations into machine learning for diagnosing thalassemia, with efforts to bridge AI and medicine by developing accessible tools for clinical applications. Fu et al. 21 used SVM to distinguish between thalassemia and non-thalassemia in adult patients, achieving a commendable average area under the curve (AUC) of 0.76 and an average error rate of 0.26. Aarzoo et al. 22 combined red blood cell indices with various machine learning algorithms to detect β-TT in pregnant women. Zhang et al. 23 applied five machine learning methods to differentiate between iron deficiency anemia and thalassemia, with the RF model exhibiting high sensitivity and specificity in cross-laboratory validation.
In addition to these efforts, the state-of-the-art in this field has been significantly advanced by recent studies leveraging multi-modal data and more complex algorithms. For instance, Nasir et al. 24 demonstrated that by combining CBC with High-Performance Liquid Chromatography (HPLC) data, models like XGBoost can achieve over 99% accuracy in the multiclass classification of both major and minor thalassemia subtypes. Their subsequent work further confirmed that deep learning models can attain similarly high performance, particularly when trained on large, high-quality private datasets. 25 AI has rapidly advanced in the diagnosis of thalassemia, with researchers innovatively applying machine learning approaches to this area. Machine learning provides a feasible strategy for creating cost-effective and user-friendly intelligent models, offering significant contributions to clinical research.26,27 This study aims to develop and validate a reliable ML-based method for distinguishing between TT and non-TT, fully exploring potential relationships between different features to achieve robust generalization and favorable performance in internal testing. Our aim is to develop an online algorithm using red blood cell parameters that all automated cell counters can provide, enabling TT diagnosis and differentiation between α-TT and β-TT, especially accessible for use in rural areas.
Patients and methods
Patients
Inclusion and exclusion criteria
This study was carried out according to the protocol which was reviewed and approved by the Medical Ethics Committee of The Affiliated Dazu's Hospital of Chongqing Medical University (Approval No. DZ2024-06-097). The Medical Ethics Committee approved this study protocol and waived the obligation for informed consent because of the retrospective nature of the study.
For this retrospective study, we retrieved data from individuals who underwent TT screening between January 2017 and May 2025. The data were sourced from the Laboratory Information Systems (LIS) of the First Affiliated Hospital of Chongqing Medical University and the Affiliated Dazu's Hospital of Chongqing Medical University. The retrieved dataset encompassed routine blood examination results and relevant clinical information for each patient.
The inclusion criteria for the study population were as follows: (1) Age range between 12 and 60 years; (2) Criteria based on the presence of microcytic hypochromic anemia or suspected anemia (MCV < 80 fL, MCH < 27 pg, or Hb < 110 g/L for females; Hb < 120 g/L for males); (3) Pregnant women and their spouses attending the prenatal screening clinic.
The exclusion criteria were designed to create a clean cohort for analysis and included: (1) Patients with incomplete or missing data for the seven key erythrocyte indices; (2) Patients with a confirmed diagnosis of iron deficiency anemia (IDA). The diagnosis of IDA was based on iron studies, primarily serum ferritin levels < 15 μg/L, where available in the clinical records; (3) Coexistence of other known hematological disorders (e.g., hemoglobinopathies other than thalassemia, myelodysplastic syndromes), active inflammation (defined as a C-reactive protein [CRP] level > 10 mg/L), or other acute and chronic conditions known to significantly impact hematopoiesis; and (4) Individuals with severe anemia (defined as Hb < 70 g/L).
In the study, a total of 987 cases in the study cohort were analyzed (Figure 1). Among them, there were 432 positive cases (TT group) with 154 males and 278 females, and 555 negative cases (non-TT group) with 164 males and 391 females. The positive cases consisted of 221 α-TT and 211 β-TT.

Schematic diagram of patient enrollment. Basic information and laboratory test results were collected from 987 patients meeting the inclusion criteria at the First Affiliated Hospital of Chongqing Medical University and the Affiliated Dazu's Hospital of Chongqing Medical University from January 2017 to May 2025. Among these, 555 cases were non-TT, 221 cases were α-TT, and 211 cases were β-TT. The entire dataset was used for model development and validation, employing a stratified 5-fold cross-validation and Bootstrap resampling strategy as described in the methods.

Comparison of machine learning performance metrics for internal testing of non-TT, TT, α-TT, β-TT diagnostics. (a) Performance metrics for the TT versus non-TT classification task. (b) Performance metrics for the α-TT versus β-TT sub-classification task.
Sample collection
Detection of routine blood parameters
Peripheral blood was taken using EDTA anticoagulated blood collection tubes, and erythrocyte parameters were measured using a fully automated hematology analyzer (SysmexXN9000, Japan). The following parameters were measured: hemoglobin (Hb), hematocrit (HCT), mean corpuscular hemoglobin (MCH), mean corpuscular hemoglobin concentration (MCHC), mean corpuscular volume (MCV), red blood cells (RBC), red cell distribution width (RDW-CV).
Detection of TT genes
In the TT gene analysis, this study included the detection of both α-globin and β-globin gene mutation sites. Whole blood DNA was extracted using the magnetic bead method (Lab-Aid 820, Xiamen Baiwei, China). Gene mutations were identified through PCR-reverse dot blot hybridization, covering three α-globin gene mutations and 17 β-globin gene mutations. Gene deletions were detected using Gap-PCR (YN-H48, Yaneng BIOSCience, China). These genetic tests have been validated in the literature as reliable [26] and are routinely used in our clinical practice.
Data preprocessing
The study involved 987 patients, comprising 318 males and 669 females, of which there were 555 non-thalassemic, 221 α-TT, and 211 β-TT patients. Each participant in the initial dataset was characterized by 7 features and 1 label column. Data preprocessing, modeling, evaluation, statistical analysis, and feature analysis were conducted using Python (version 3.11) and the open-source Python machine learning library scikit-learn (version 1.4.0).
Model construction and validation process
The development and validation of the diagnostic models followed a rigorous, multi-stage protocol designed to preclude data leakage and ensure an unbiased estimation of generalization performance. Initially, the complete cohort of 987 patient cases was definitively partitioned into a training set (80%, n = 790) and a hold-out internal testing set (20%, n = 197), employing a stratified random split to preserve the proportional representation of diagnostic classes. This validation set was then sequestered and remained entirely unused throughout all phases of model development and optimization.
All subsequent procedures, including model training and hyperparameter tuning, were performed exclusively on the training set. A suite of seven distinct machine learning algorithms was benchmarked: Logistic Regression (LR), Gaussian Naive Bayes (GNB), DT, RF, Multilayer Perceptron (MLP), XGBoost (XGB), and CatBoost (CATB). We selected a suite of seven algorithms to span a range of model complexity and interpretability, from traditional logistic regression to advanced gradient boosting ensembles. For each algorithm, hyperparameters were tuned via a randomized grid search embedded within a stratified five-fold cross-validation framework on the training data. The Area Under the Receiver Operating Characteristic Curve (AUC) was specified as the primary optimization metric.
Upon identification of the optimal hyperparameters for each algorithm, a final model was retrained on the entire training set. This finalized model was subsequently evaluated a single time on the internal testing cohort to assess its definitive performance. To derive robust estimates of the performance metrics and their corresponding 95% confidence intervals, predictions on the validation set were subjected to bootstrap resampling (n = 1000 iterations). This comprehensive development and validation pipeline was identically and independently applied to both classification tasks: (1) the discrimination of TT from non-TT, and (2) the sub-classification of α-TT versus β-TT.
Benchmarking against traditional diagnostic indices
To contextualize the diagnostic performance and quantify the incremental utility of the proposed machine learning models, a comparative benchmark analysis was performed against four established screening indices. These indices, primarily designed to differentiate TT from iron deficiency anemia, were computed for each individual within the internal testing cohort. Specifically, the following indices were evaluated:


Subsequently, each index was utilized for the binary classification of participants into ‘TT’ or ‘non-TT’ categories based on their respective predefined discriminant thresholds: < 13 for the Mentzer Index, < 0 for the England & Fraser Index, < 1530 for the Shine & Lal Index, and <220 for the RDWI. The diagnostic efficacy of each index was then systematically assessed using a consistent set of performance metrics, including accuracy, sensitivity, specificity, positive predictive value (PPV), negative predictive value (NPV), F1-score, and the area under the receiver operating characteristic curve (AUC), thereby enabling a direct comparison with the machine learning models.
Statistical analysis
Baseline demographic and clinical characteristics of the study cohorts were compared to delineate the composition of the clinical groups.
Continuous variables are presented as mean ± standard deviation (SD). The assumption of normality for each continuous variable was first evaluated using the Shapiro-Wilk test. For normally distributed variables, intergroup comparisons between two independent groups (e.g., TT vs. non-TT; α-TT vs. β-TT) were performed using Student's t-test for independent samples. Conversely, for variables that did not adhere to a normal distribution, the non-parametric Mann‒Whitney U test was employed.
Categorical variables, such as sex, are summarized as frequencies and percentages (n, %). Differences between groups for these variables were assessed using Pearson's Chi-squared (χ²) test. In instances where the expected frequency within any cell of the contingency table was below 5, Fisher's exact test was utilized as the statistically appropriate alternative.
For all analyses, a two-sided p-value less than .05 was considered to indicate statistical significance.
Results
Patient characteristics
A total of 987 patients who met the enrollment criteria, consisting of 555 non-TT patients and 432 TT patients, were included in this study. All seven variables used were measurable via routine blood tests. Initially, the attributes of patients diagnosed with non-TT and TT in the dataset were analyzed. Significant differences were observed in MCH, MCHC, MCV, RBC, and RDW-CV, while no significant differences were found in Hb and Hct between the two clinical groups (Table 1).
Demographic characteristics and distribution of erythrocyte parameters in non-TT and TT groups of different cohorts.

*p < .001.
Among the 432 TT patients, there were 221 α-TT patients and 211 β-TT patients. Next, statistical analysis was conducted on the data from patients diagnosed with α-TT and β-TT in the dataset. Marked differences were observed in Hb, Hct, MCH, MCHC, and MCV between the two clinical groups, whereas no significant differences were detected in RBC and RDW-CV (Table 2).
Demographic characteristics and distribution of erythrocyte parameters in α-TT and β-TT groups of different cohorts.
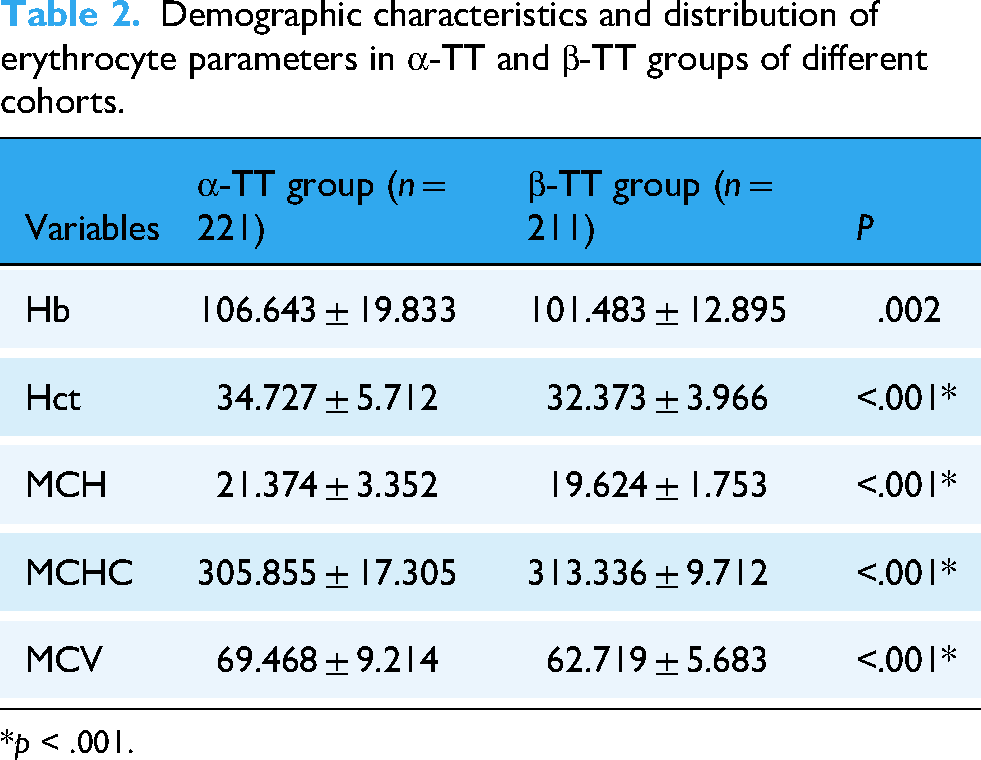
*p < .001.
Model performance and benchmark comparison for TT versus non-TT discrimination
All seven machine learning models exhibited high discriminative capacity for TT screening, with AUC values uniformly exceeding 0.94 on the hold-out validation set (Table 3, Figures 2(a) and 3(a)). The CATB model yielded the optimal performance, achieving a maximal AUC of 0.976 (95% CI: 0.951–0.993). This was complemented by a high specificity of 0.981 and an overall accuracy of 0.940, indicating a robust ability to correctly identify non-TT individuals. The performance of other advanced ensemble models, such as XGBoost (AUC = 0.972), also approached this leading benchmark, underscoring the suitability of gradient boosting architectures for this clinical task.

Comparative performance of machine learning models on the internal testing cohort. The figure displays the Receiver Operating Characteristic (ROC) curves and Precision-Recall (PR) curves for all seven machine learning models, evaluated on the hold-out internal testing cohort. (a) ROC curves for the TT versus non-TT classification task. The legend shows the Area Under the Curve (AUC) with its 95% confidence interval for each model. (b) ROC curves for the α-TT versus β-TT sub-classification task. (c) PR curves for the TT versus non-TT classification task. The legend shows the Average Precision (AP) for each model. The dashed line represents the no-skill baseline, corresponding to the prevalence of the positive class. (d) PR curves for the α-TT versus β-TT sub-classification task.
Diagnostic performance metrics of different models for non-TT, TT, in internal testing cohort.
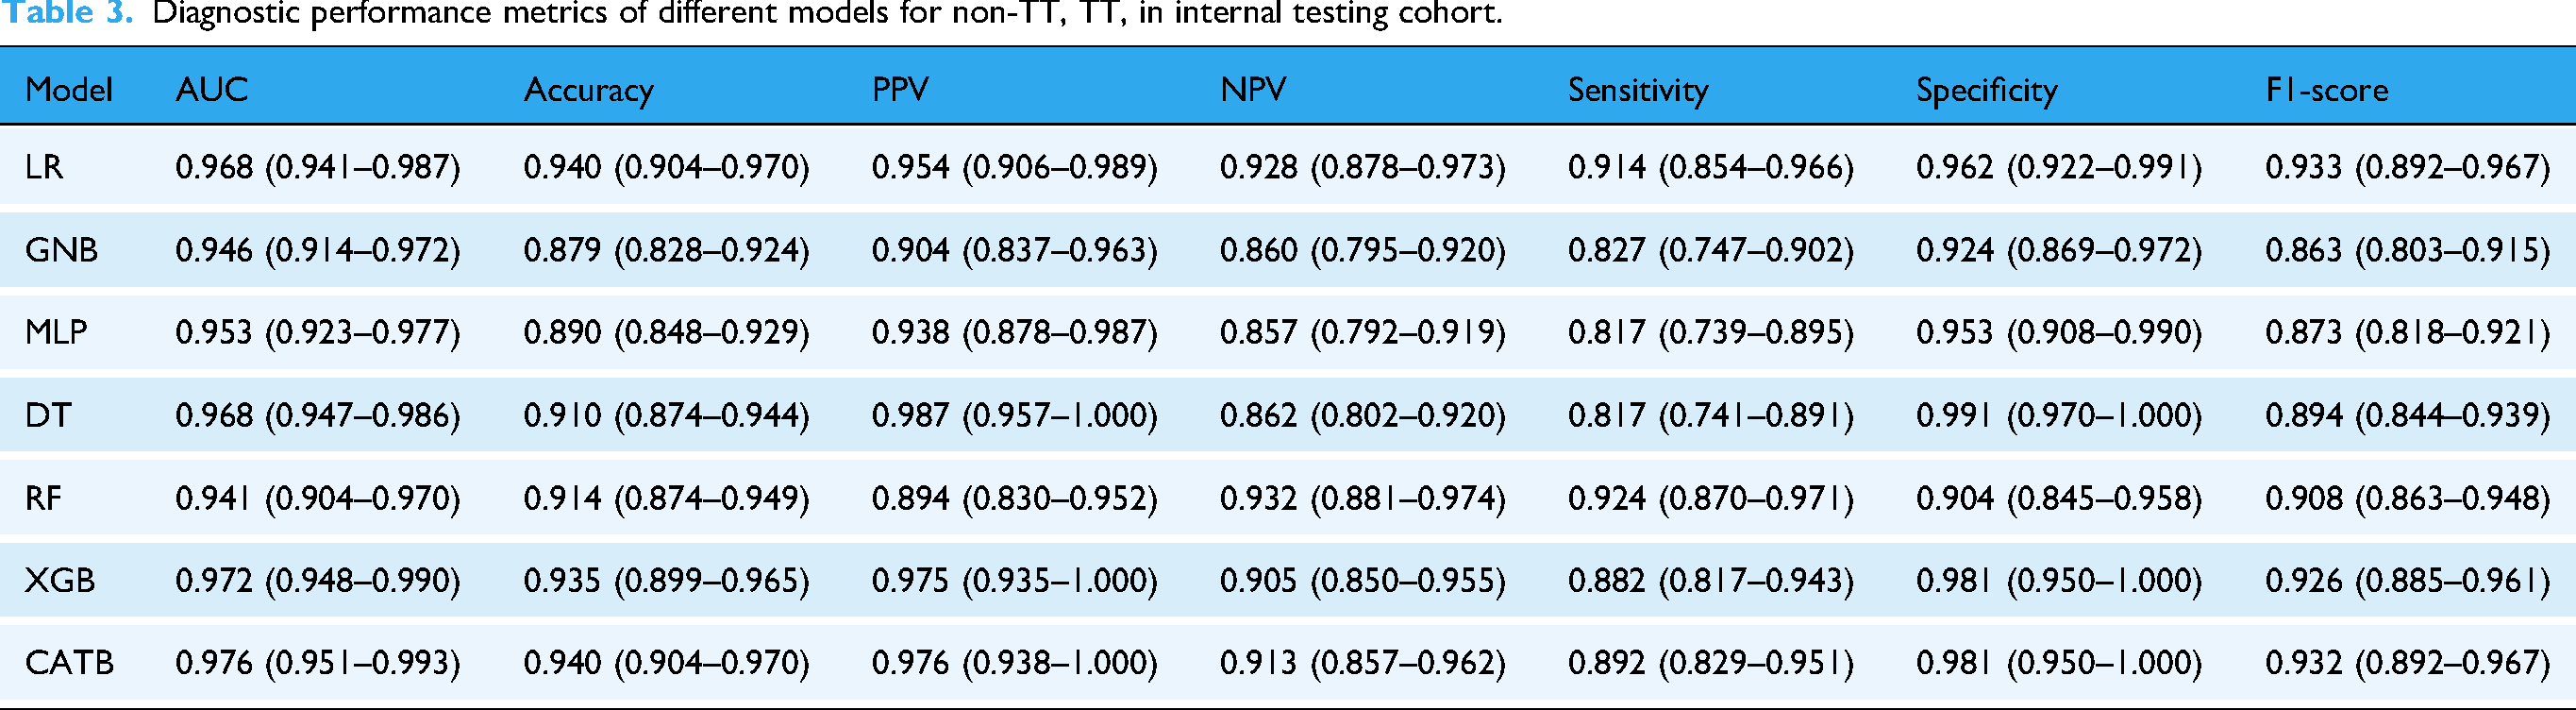
Critically, all machine learning models substantially outperformed the four traditional screening indices, which were constrained by a suboptimal trade-off between sensitivity and specificity (Table 4). To ascertain the model's clinical generalizability, a stratified performance analysis of the premier CATB model was conducted. The model maintained high and consistent performance across all sex and age strata, demonstrating its robustness and the absence of demographic bias for this diagnostic task (Table S4 in the supplementary materials).
Performance of traditional diagnostic indices for the TT versus non-TT classification task.

Model performance in differentiating α-TT and β-TT
The discrimination between α-TT and β-TT represented a substantially more challenging classification task, as evidenced by a general attenuation in performance metrics across all evaluated models (Table 5, Figures 2(b) and 3(b)). Nevertheless, the advanced ensemble methods again demonstrated superior efficacy. The CATB model, in particular, significantly outperformed all other algorithms, achieving a maximal AUC of 0.842 (95% CI: 0.751–0.917), which was coupled with a leading accuracy of 0.782 and an F1-score of 0.730.
Diagnostic performance metrics of different models for α-TT, β-TT, in internal testing cohort.
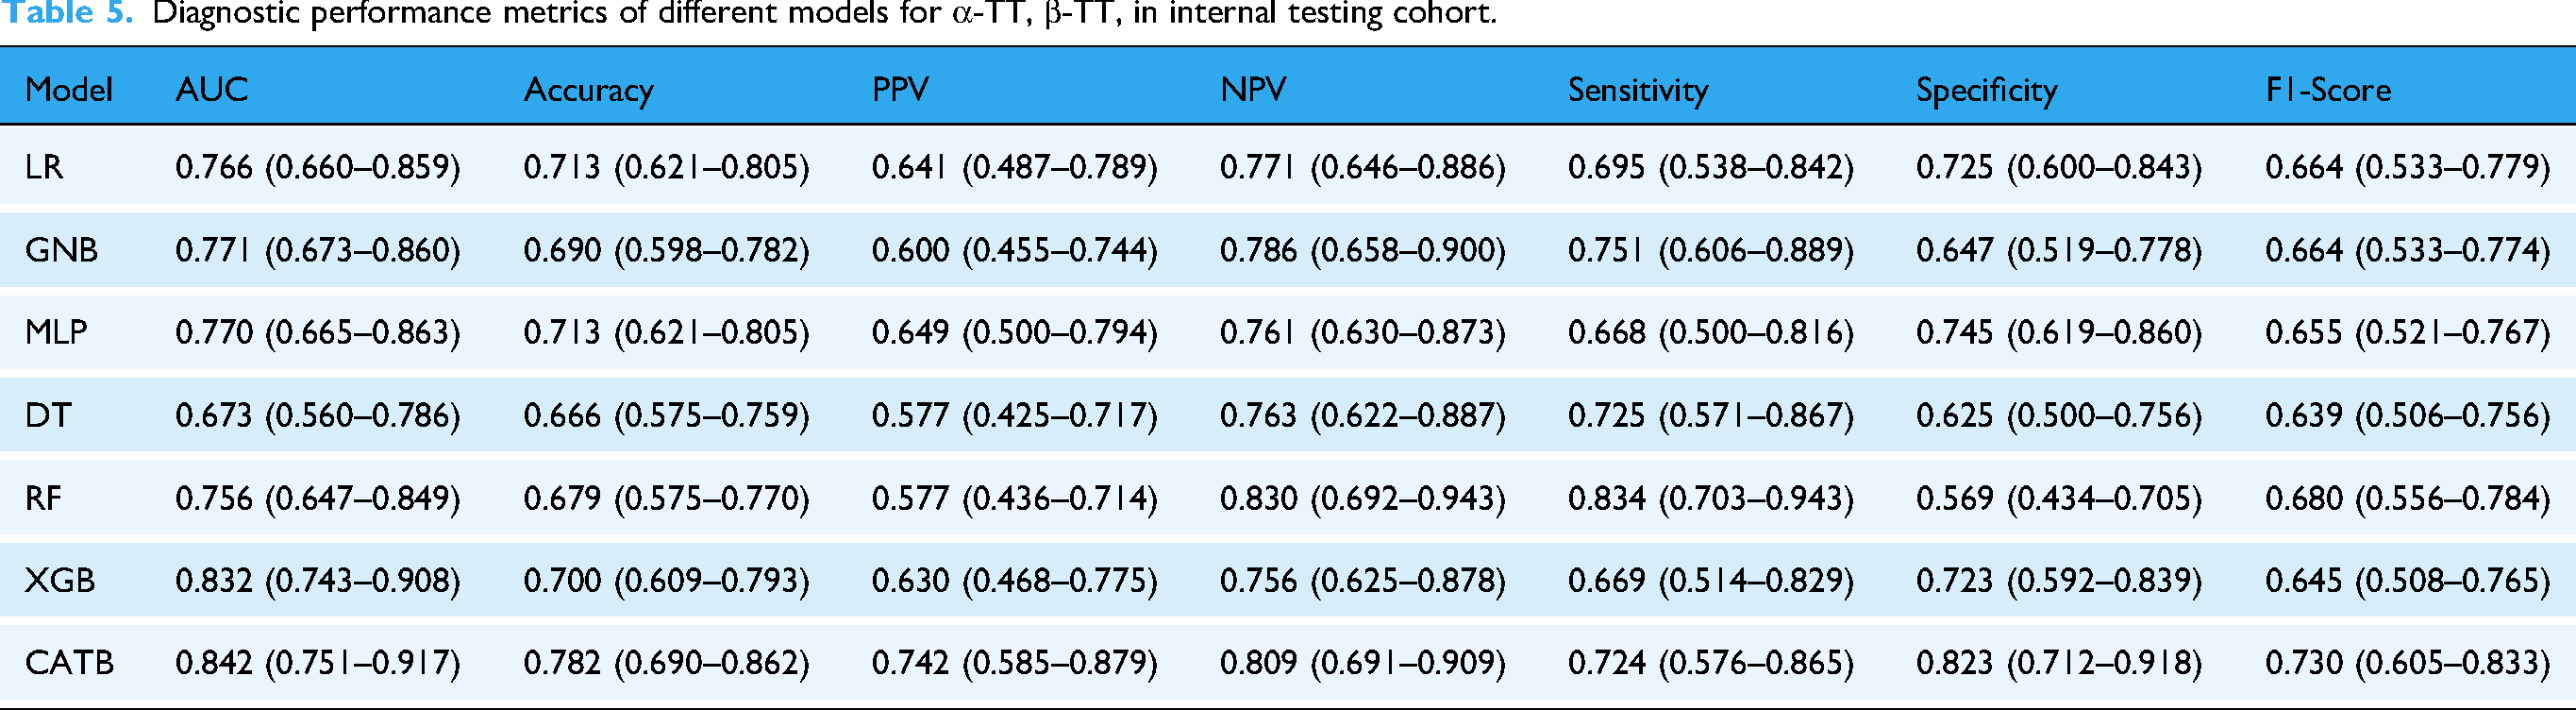
This performance disparity highlights that the nuanced hematological distinctions between α-TT and β-TT necessitate the capacity of sophisticated models to capture complex, non-linear inter-variable relationships, a capability not present in simpler models such as the DT (AUC = 0.673). Intriguingly, the stratified performance analysis of the CATB model yielded a clinically significant insight. While its efficacy was invariant to sex, a notable heterogeneity was observed across age strata (Table S5 in the supplementary materials). This finding is not interpreted as an intrinsic model bias but rather as a reflection of an underlying clinical reality wherein the hematological distinctions between these subtypes are less pronounced in younger individuals. This observation itself constitutes a novel finding that warrants further investigation.
Elucidation of model decision-making via interpretability analysis
To elucidate the underpinnings of the model's decision-making process and verify its alignment with clinical pathophysiology, we conducted an interpretability analysis using SHapley Additive exPlanations (SHAP) and Partial Dependence Plots (PDPs). Global feature importance analysis revealed that the model prioritized diagnostically relevant hematological parameters (A and 4B). For the primary task of discriminating TT from non-TT, MCV, RBC, and MCH were identified as the most salient predictors. For the sub-classification of α-TT versus β-TT, MCV, Hct, and MCHC were the principal determinants.
To delineate how these prioritized features influenced predictions, analysis of SHAP summary plots and PDPs demonstrated that the model had autonomously learned established clinical heuristics (Figures 4 and 5). In the TT versus non-TT task, the model consistently associated lower MCV and MCH values with higher RBC counts as strong indicators of TT, thereby recapitulating the cardinal hematological signature of microcytic anemia with compensatory erythrocytosis. Specifically, the PDP for MCV delineated a clear threshold effect, with the predicted probability for TT escalating sharply as MCV decreased below 80 fL (Figure 5(a)).

Visualization of SHAP values plot for CatBoost, the top-performing machine learning model. (a‒b) Global feature importance analysis for the two classification tasks. The beeswarm summary plots (left) show the distribution of SHAP values for each feature, indicating both the magnitude and direction of their impact. The bar plots (right) rank the features by their mean absolute SHAP value. Panel (a) corresponds to the TT versus non-TT task, and panel (b) corresponds to the α-TT versus β-TT task. (c‒e) Local, patient-specific explanations using SHAP force plots for three representative cases from the testing cohort. These plots illustrate how individual feature values push the model's prediction from a baseline towards the final output. The cases shown are: (c) a non-TT patient (d) an α-TT patient, and (e) a β-TT patient.
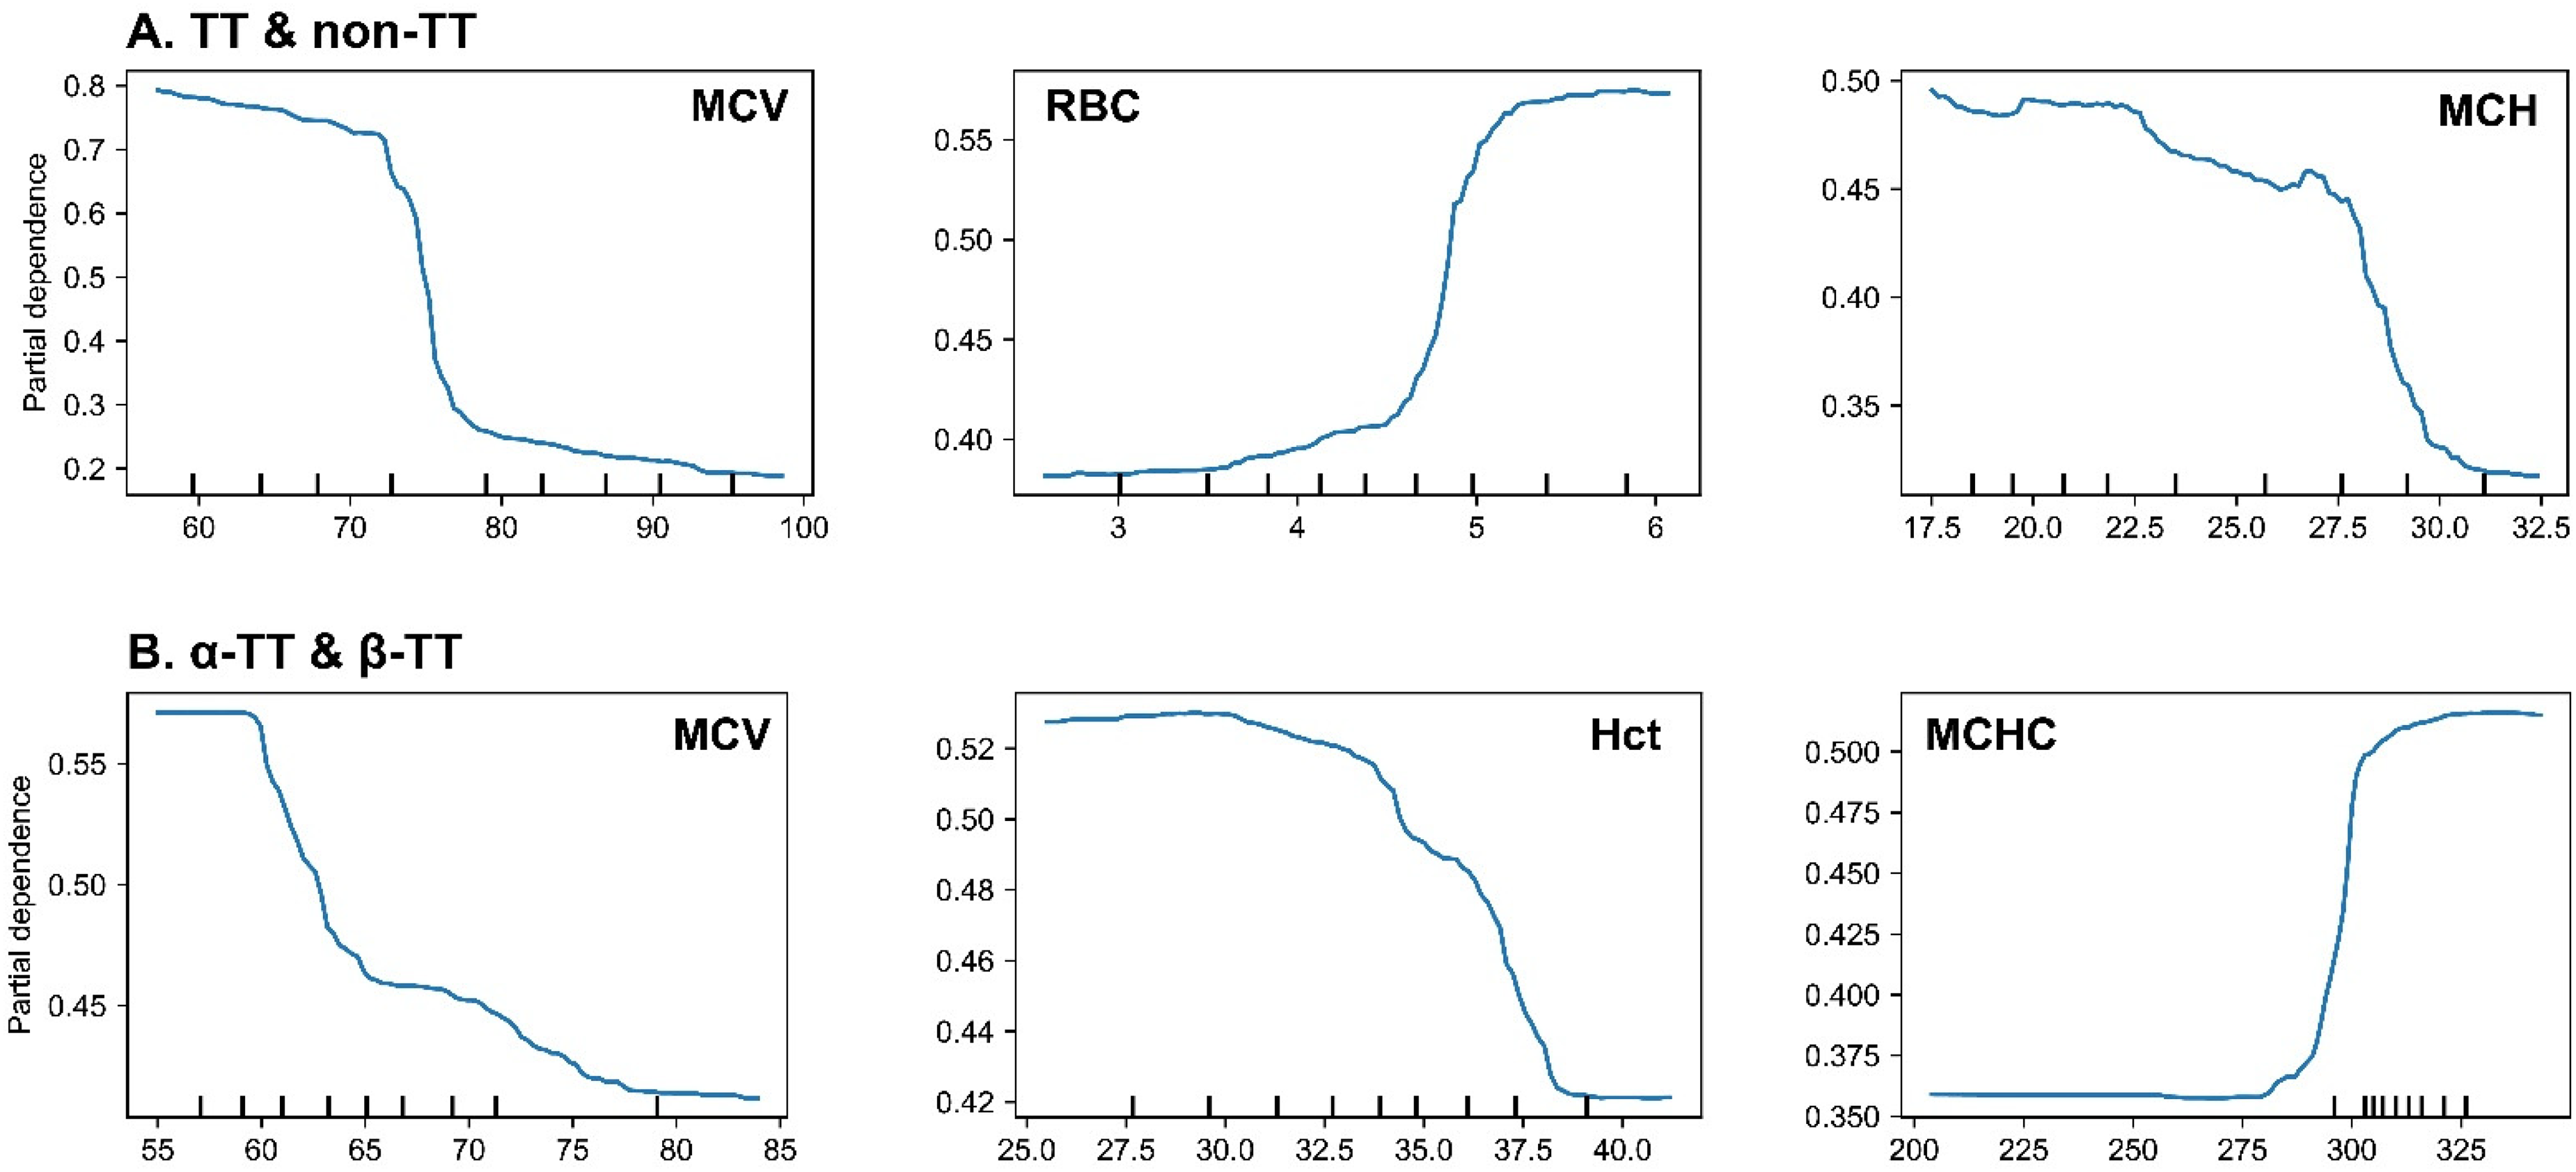
Partial dependence plots (PDPs) for the most influential features in the CatBoost model. (a) PDPs for the TT versus non-TT classification task. The plots show that the probability of a TT prediction increases sharply as MCV and MCH decrease below their clinical thresholds (∼80 fL and ∼27 pg, respectively), and as RBC count increases above ∼5.0 × 10¹²/L. (b) PDPs for the α-TT versus β-TT sub-classification task. The plots indicate that a lower MCV, a lower Hct, and, most notably, a higher MCHC value, all increase the probability of the model predicting β-TT over α-TT. The figure displays PDPs illustrating the marginal effect of the top three most influential features on the model's prediction for each classification task. The y-axis represents the partial dependence, which can be interpreted as the average predicted probability for a class after accounting for the effects of all other features. The x-axis shows the value of the feature, with tick marks at the bottom indicating the distribution of data points.
In the α-TT versus β-TT sub-classification task, the analysis revealed more subtle, yet clinically significant, predictive patterns. The model leveraged profoundly low MCV values (<65 fL) and, notably, normal-to-high MCHC values as potent indicators of β-TT over α-TT (Figure 5(b)). This latter finding recapitulates a key clinical heuristic wherein β-thalassemia trait, despite severe microcytosis, often presents with a paradoxically normal MCHC.
Analyses of individual cases using SHAP force plots further substantiated the model's capacity for nuanced clinical reasoning (Figure 4(c) to (e)). For the non-TT patient, a healthy individual with all erythrocyte indices within the normal range, the model's decision was driven by multiple synergistic negative predictors. As shown, the normal-to-high values of MCV (96.4 fL) and MCH (32.1 pg) acted as the strongest forces pushing the prediction away from a TT diagnosis, resulting in a highly confident and accurate classification. Similarly, it accurately identified an α-TT patient based on classic features and, critically, differentiated a β-TT patient by prioritizing the combination of profound microcytosis (MCV = 58.6 fL) with a normal MCHC, demonstrating an ability to synthesize complex hematological data in a manner that emulates expert diagnostic logic.
Development of a user-friendly operational interface
To enhance the clinician's ability to intelligently interpret patient results, we have developed the WeChat miniprogram AI Lab and incorporated a trained machine learning model on the server side. In the primary interface of the program, physicians with specific permissions to efficiently access the AI Lab intelligent testing system via their mobile phones while connected to a network (Figure S3A in the supplementary materials). To ensure patient privacy protection, the patient's test results are not directly transmitted through the Hospital Information System (HIS). Upon completion of a blood test, the hospital's test information management system will anonymize and encrypt the blood test result information within the patient's test report, subsequently encoding and storing it in the form of a QR code. Doctors can quickly upload and analyze results by scanning the QR code on a patient's test report, enabling clinicians to access a patient's smart diagnostic report in a timely manner via the WeChat app (Figure S3B in the supplementary materials). Additionally, physicians can conveniently retrieve historical diagnostic reports by selecting the relevant patient's action card (Figure S3C in the supplementary materials).
Preliminary clinical utility and usability assessment
To assess the preliminary clinical utility and usability of the prototype diagnostic tool, a pilot evaluation was conducted. A cohort comprising 10 clinicians (three outpatient physicians, five laboratory medicine specialists, and two clinical medical students) was prospectively recruited from affiliated institutions. Participants were instructed to utilize the tool to analyze a set of anonymized patient cases by scanning QR codes on mock laboratory reports and subsequently interpreting the model's diagnostic and interpretability outputs. Feedback pertaining to user experience, clarity of results, and perceived clinical utility was systematically collected via structured questionnaires and semi-structured interviews.
Qualitative analysis of the feedback revealed a uniformly positive reception. Participants consistently lauded the tool's intuitive interface and the rapid generation of risk assessments, reporting its potential value as a rapid screening adjunct in high-throughput settings, such as primary care or outpatient clinics. The integrated interpretability features were highlighted as particularly valuable for adjudicating borderline cases with atypical hematological profiles, as they provided a transparent rationale for the model's predictions. Furthermore, junior clinicians and students reported that the visualization of case-specific SHAP analyses served as an effective interactive educational tool, clarifying the complex interplay of erythrocytic parameters in differential diagnosis.
While these preliminary findings are encouraging, we underscore that this pilot assessment was designed to establish feasibility and was not powered for a formal evaluation of clinical impact. Larger-scale, prospective validation studies are therefore warranted to definitively ascertain the tool's effect on clinical outcomes.
Discussion
Hemoglobin disorders are the most prevalent single-gene disorders globally and encompass thalassemia and sickle cell disease. TT demonstrates vast diversity and has a global distribution, with an estimated minimum of 60,000 severely affected individuals born annually.28–30 The definitive diagnosis of TT requires a comprehensive series of tests, including complete blood cell count, hemoglobin analysis, and molecular studies to identify mutations in the globin genes. These tests help further confirm the diagnosis of TT and provide essential guidance for accurate treatment. 31 The study included patient data from two medical centers, collected based on consistent inclusion criteria. This dataset comprises seven common red blood cell-related features, widely recognized by researchers as highly relevant for diagnosing TT. Initially, a baseline characteristics analysis of the entire dataset was conducted. The dataset, aggregated from two medical centers, was then randomly split into a training cohort and an internal testing cohort. We benchmarked seven machine learning models, employing a five-fold cross-validation and randomized grid search strategy to optimize their hyperparameters, which led to the identification of CATB as the top-performing model. Subsequently, to enhance model interpretability, we utilized SHAP values to elucidate the influence of different red blood cell parameters on the model's decision-making process. Finally, to facilitate clinical translation, we developed a user-friendly interface deployed as a WeChat Mini Program, enabling rapid TT risk screening, particularly in medically underserved regions.
Our baseline analysis reaffirmed the distinct hematological signatures of TT. The findings of microcytosis and hypochromia (lower MCV and MCH) in the TT group are consistent with the underlying pathophysiology of impaired globin chain synthesis. Interestingly, the compensatory increase in RBC count, a known indicator for differentiating TT from iron deficiency anemia, was also a significant feature in our cohort.
Furthermore, the comparison between α-TT and β-TT revealed a more severe anemic phenotype in the β-TT group, as evidenced by more pronounced microcytosis and lower hemoglobin levels. This aligns with the established understanding that the precipitation of excess α-globin chains in β-thalassemia causes more severe ineffective erythropoiesis. These well-defined hematological differences provide a solid foundation for the successful application of machine learning models for classification.
The application of machine learning to these routine hematological parameters yielded highly accurate diagnostic models. The exceptional performance, particularly of the CATB model, in differentiating TT from non-TT (AUC = 0.976) confirms that these simple parameters contain sufficient information for a reliable automated screening. This supports the feasibility of developing a low-cost, high-efficiency diagnostic aid.
Furthermore, the performance of our models was benchmarked against four established screening indices, revealing a significant advantage for the machine learning approach. Traditional indices, while simple to use, were shown to be constrained by a suboptimal balance of sensitivity and specificity. This superiority stems from the ability of machine learning algorithms to capture complex, non-linear interactions among multiple hematological parameters, a capability far beyond the scope of simple mathematical formulas. This highlights the substantial added value of our approach in enhancing the accuracy and reliability of TT screening.
For model selection, we evaluated a comprehensive suite of machine learning approaches to thoroughly explore the underlying data relationships and identify the optimal decision-making framework. Overall, ensemble learning models, including CATB, XGB, and RF, demonstrated robust performance across both classification tasks. They proved highly capable of capturing the complex, non-linear interactions among hematological parameters for accurate classification. Notably, in the simpler task of discriminating between non-TT and TT individuals, the linear-based Logistic Regression (LR) model also delivered highly competitive performance (AUC = 0.968, F1-score = 0.933), suggesting that a substantial portion of the discriminative information for this initial screening can be effectively captured by a linear decision boundary.
In stark contrast, the task of differentiating between α-TT and β-TT proved to be significantly more challenging. Here, the CATB model (AUC = 0.842) markedly outperformed all other models, while the performance of simpler models, particularly LR, dropped sharply. This highlights a key point often discussed in clinical machine learning: while simpler, interpretable models like logistic regression are often preferred by researchers for their transparency32–35 and performed surprisingly well in our primary classification task, they may lack the capacity to capture the subtle, non-linear relationships required for more complex sub-typing. This finding underscores the necessity of employing advanced ensemble methods like CATB for such fine-grained diagnostic challenges, where the distinctions between classes are less pronounced.
Stratified performance analysis further substantiated the robustness and fairness of the optimal CATB model. For the primary screening task, diagnostic efficacy was remarkably invariant across both sex and age strata, affirming the model's high degree of generalizability (Table S4 in the supplementary materials).
Conversely, a more nuanced pattern emerged from the sub-classification of α-TT versus β-TT. While performance remained consistent across sexes, a statistically significant heterogeneity was observed among age groups (Table S5 in the supplementary materials). Specifically, the model exhibited attenuated accuracy in the pediatric and adolescent cohort. This age-dependent performance differential is not interpreted as a model deficiency. Rather, it likely reflects the underlying clinical reality that the hematological distinctions between these subtypes are subtler or less fully manifested in younger patient populations. Consequently, this observation constitutes a clinically relevant finding in its own right, highlighting a specific patient demographic where diagnostic uncertainty is inherently higher and suggesting that the model's performance can effectively mirror physiological complexities. This warrants further dedicated investigation.
A salient finding from our comparative analysis is the superior efficacy of the CATB model, which consistently surpassed the other six algorithms in both the primary TT versus non-TT classification and the more challenging α-TT versus β-TT sub-classification. A mechanistic rationale for this empirical result can be found in the inherent algorithmic architecture of CATB, which confers distinct advantages for modeling clinical datasets of this nature.
The success of the CATB model in this context can be primarily attributed to two of its core architectural innovations. First, CATB employs symmetric (or “oblivious”) DTs as its base learners. This architecture, wherein all nodes at a given depth utilize an identical splitting feature, functions as a potent form of intrinsic regularization. This structural constraint inherently limits model complexity and thereby mitigates the risk of overfitting, a critical consideration for datasets of moderate size, such as the one used in this study (n = 987).
Second, and perhaps more critically, CATB implements a novel strategy termed Ordered Boosting to mitigate the prediction shift (i.e., target leakage) inherent to conventional gradient boosting algorithms. This scheme employs a permutation-based approach to ensure that the gradient for any given sample is estimated using a model that has not been trained on that sample's target value. This process yields a more veridical estimation of gradients during training, which consequently fosters a more robust model with enhanced generalization capabilities. We posit that this synergistic combination of intrinsic regularization and veridical gradient estimation endowed the CATB model with the capacity to discern the complex and subtle patterns within our erythrocytic data, ultimately culminating in its superior and more stable predictive performance.
A principal impediment to the clinical translation of AI models is their perceived ‘black box’ nature. Our study directly addresses this concern through a comprehensive interpretability analysis. Providing clear, clinically meaningful explanations is critical to building trust and ensuring the safe deployment of AI tools in healthcare.36,37 The SHAP and PDP analyses presented herein extend beyond mere feature ranking; they deconstruct the model's complex mathematical framework into clinically cognizable heuristics, thereby providing actionable insights.
Crucially, our findings substantiate that the model's decision-making process is not a statistical artifice but is instead intrinsically aligned with the fundamental pathophysiology of thalassemia. The model not only recapitulated foundational diagnostic tenets, such as the inverse relationship between MCV and RBC for TT screening, but also delineated more sophisticated relationships, including the differential diagnostic utility of MCHC in distinguishing α-TT from β-TT. This congruence between algorithmic reasoning and established medical knowledge is a prerequisite for fostering clinical trust and facilitating adoption.
Furthermore, the capacity to generate patient-specific explanations, as demonstrated by the SHAP force plots (Figure 4(c) to (e)), portends a new paradigm of human-AI collaboration. In clinical scenarios involving diagnostically ambiguous cases, such a tool could serve not merely as a predictive instrument but as a cognitive adjunct, enabling clinicians to interrogate the model's rationale and thereby augment their own diagnostic reasoning. This level of transparency is indispensable for the responsible and efficacious integration of AI into real-world clinical workflows.
The clinical translation of diagnostic AI systems necessitates a robust framework for data privacy and security. In our proposed workflow, we address this imperative by embedding fully anonymized and encrypted patient data within a secure QR code on the physical test report. This “privacy-by-design” approach not only mitigates the risk of unauthorized access to sensitive health information but also adheres to the principle of data minimization, ensuring that data is accessible only to authorized personnel at the point of care. We posit that this methodology represents a scalable and secure paradigm for the integration of AI models with clinical laboratory data across diverse applications.
There are several areas where our approach could be further refined. First, the inclusion of retrospective patient data may introduce potential bias in the results. Second, to ensure an adequate sample size for developing a model robust to inter-institutional heterogeneity—such as variations in instrumentation and quality control protocols—we deliberately aggregated the data from both medical centers. While this data pooling strategy maximizes the statistical power and diversity of the current training cohort, it also highlights the imperative for future validation studies incorporating data from additional centers to definitively ascertain the model's external generalizability. Third, the diagnostic accuracy for α-TT and β-TT remains suboptimal, indicating the need to fine-tune experimental details and optimize feature engineering strategies to better quantify the potential differences in test results between these TT subtypes. Finally, a significant limitation is that our study was conducted on a specific ethnic population from two centers within a single geographic region (Chongqing, China). This introduces a potential for geographic and ethnic bias, which is a critical consideration for a genetic disease like thalassemia. The prevalence and types of specific globin gene mutations are known to vary widely across different ethnic groups, such as those in Mediterranean, Middle Eastern, and Southeast Asian populations. 38 Therefore, our model, despite its high performance in our cohort, may not exhibit the same level of accuracy if applied directly to other populations with different genetic backgrounds and mutation spectrums. Before our tool can be considered for wider adoption, its performance must be rigorously validated in diverse, multi-ethnic cohorts to ensure its generalizability and equity.
In future research, our plan includes two key components: first, to continue exploring potential associations within common, routinely used laboratory data to identify biomarkers closely related to various diseases, aiming to support primary hospitals in improving diagnostic capabilities. Second, we plan to integrate multimodal data with neural networks to harness their powerful learning capabilities. This approach, combined with evidence-based medicine, will enable a more precise diagnosis of diseases and enhance our screening capacity across multiple dimensions of disease exploration.
Conclusion
Machine learning algorithms, grounded in routine blood parameters, offer clear and interpretable guidance for the diagnosis and classification of TT. They serve as a robust benchmark for clinical diagnosis and treatment, underscoring their potential for further clinical investigation and eventual adoption in medical practice.
Supplemental Material
sj-docx-1-dhj-10.1177_20552076251393429 - Supplemental material for Establishment and verification of the model in diagnosis of thalassemia trait based on red blood cell parameters: A two-center retrospective study
Supplemental material, sj-docx-1-dhj-10.1177_20552076251393429 for Establishment and verification of the model in diagnosis of thalassemia trait based on red blood cell parameters: A two-center retrospective study by Yulong Liu, Shan Wang, Baoru Han, Jing Yang, Hongyou Chen, Wen Zhang, Ke Wu and Jin Li in DIGITAL HEALTH
Footnotes
Abbreviations
Acknowledgements
This is a clinical research project approved by the Affiliated Dazu's Hospital of Chongqing Medical University. We greatly appreciate all participants in this study.
Ethics approval and consent to participate
This study was carried out according to the protocol that was reviewed and approved by the Medical Ethics Committee of The Affiliated Dazu's Hospital of Chongqing Medical University (approval number: DZ2024-06-097). The Medical Ethics Committee approved this study protocol and waived the obligation for informed consent because of the retrospective nature of the study.
Authors’ contributions
Yulong Liu, Shan Wang, and Baoru Han contributed to data curation, investigation, and writing–original draft. Jing Yang contributed to formal analysis. Hongyou Chen and Wen Zhang contributed to data curation and validation. Ke Wu and Jin Li contributed to funding acquisition, supervision, and writing–review and editing.
Funding
The authors disclosed receipt of the following financial support for the research, authorship, and/or publication of this article: This work was supported by the Chongqing High-Level Medical Talents Development Program (Young and Middle-Aged Special), Dazu District Major Joint Science and Health Project, Chongqing Natural Science Foundation General Program, Chongqing Municipal Health Commission and Science and Technology Bureau Joint Research Project, the China Postdoctoral Science Foundation, the Intelligent Medical Project of Chongqing Medical University (grant number YXGD202427, DZKJ2024JSYJ-KWXM1001, CSTB2024NSCQ-MSX0439, 2024MSXM045, 2024MD764049, ZHYX202206).
Declaration of conflicting interests
The authors declared no potential conflicts of interest with respect to the research, authorship, and/or publication of this article.
Data availability statement
Supplemental material
Supplemental material for this article is available online.
References
Supplementary Material
Please find the following supplemental material available below.
For Open Access articles published under a Creative Commons License, all supplemental material carries the same license as the article it is associated with.
For non-Open Access articles published, all supplemental material carries a non-exclusive license, and permission requests for re-use of supplemental material or any part of supplemental material shall be sent directly to the copyright owner as specified in the copyright notice associated with the article.