
Abstract
Objective
Early support and intervention for autism have proven effective in improving developmental outcomes. However, the heterogeneity of the condition, coupled with the scarcity and uneven distribution of medical resources, presents significant challenges for early detection. Telehealth, particularly through video-based behavioral observation, has shown considerable potential in expediting the autism diagnostic pathway. This systematic review and meta-analysis aimed to evaluate the accuracy of video-assisted telehealth technologies for autism screening and diagnosis, and to assess whether function (screening vs. diagnosis) and category (video conferencing, video recording, or machine learning using short videos) influence effectiveness.
Methods
This review followed PRISMA guidelines and was registered on PROSPERO (CRD42022376674). A systematic search was conducted for studies published up to November 20, 2024. After screening, 41 studies met inclusion criteria. Meta-analytic procedures were applied to calculate sensitivity and specificity. Subgroup analyses were conducted to compare performance by function and category.
Results
Across studies, the pooled sensitivity was 0.88 (95% confidence interval (CI): 0.84–0.91) and specificity was 0.76 (95% CI: 0.72–0.80), indicating good sensitivity and moderate specificity for autism detection. Subgroup analysis showed that diagnostic datasets performed better than screening datasets in both sensitivity and specificity. Furthermore, machine-learning technologies demonstrated the highest sensitivity and specificity compared to video conferencing and video recording.
Conclusion
Video-assisted telehealth technologies demonstrate strong potential for enhancing early autism detection. However, existing evidence remains preliminary, with studies predominantly conducted in the United States. Future research should prioritize validating these tools in geographically and demographically diverse populations, including low- and middle-income regions.
Introduction
Autism spectrum disorder (ASD) is a lifelong neurodevelopmental condition that typically manifests in early childhood. It is characterized by persistent difficulties in (a) social communication and social interaction and (b) restricted and repetitive patterns of behaviors, interests, or activities. 1 As implied by the concept of “spectrum,” autism has a wide range of symptoms, which can vary significantly in both type and severity across individuals. 2 Despite this heterogeneity, early support and intervention have proven effective in improving core symptoms and overall functioning in some autistic children, including increasing intelligence quotients, adaptive skills, and reducing problem behaviors.3,4 However, achieving optimal outcomes for early support and intervention depends on effective and timely detection methods. 5
Research suggests that autism can be diagnosed as early as 18 months, a time when core symptoms can be differentiated from typical development and other developmental delays. 6 Yet, a recent review analyzing data from 23 countries and 18,134 autistic children found that the global average age at diagnosis was 43.18 months, with a range from 30.90 to 74.70 months. 7 This indicates that early detection remains a significant challenge despite widespread agreement on its importance. 8
The delay in autism diagnosis can be attributed to several factors. One major issue is the scarcity of specialists. For instance, the United States has approximately 1 million autistic children but only about 8300 child psychiatrists, 1500 child neurologists, and 1000 developmental–behavioral pediatricians, with an even smaller proportion specializing in autism. 9 The shortage is even more severe in developing countries. In China, with over 2 million autistic children, there are fewer than 500 child psychiatrists, 10 and pediatricians have been reported to lack general knowledge of autism and are less aware of the symptoms of autism compared to parents.10–12 Another challenge lies in the complexity of autism diagnosis. Currently, there are no medical biomarkers (such as blood tests or brain scans) to diagnose autism, 13 and diagnosis typically requires a comprehensive evaluation by a multidisciplinary team.14,15 This process, which may involve clinical observations, standardized assessments like Autism Diagnostic Observation Schedule, Second Edition (ADOS-2) 16 and Autism Diagnostic Interview, Revised (ADI-R), 17 and multiple visits, can be time-consuming for both patients and specialists. Moreover, the uneven distribution of autism diagnostic resources contributes to delays in diagnosis. In addition to disparities among high-, middle-, and low-income countries, there are also disparities between different geographical regions of the same country. For example, children living in rural or suburban areas were reported to receive a diagnosis about half a year later than children in urban areas, and this is commonly found across high-, middle-, and low-income countries.18,19 These challenges have led to significant delays in diagnosis, with the average age of diagnosis exceeding 2 years later than recommended. Addressing this delay presents an opportunity to provide autistic children with timely access to early support and intervention, which is crucial for improving developmental outcomes and quality of life.
In recent years, telehealth has been proposed as a solution to accelerate autism detection and alleviate the pressure on healthcare systems. By enabling scarce specialists to extend their reach more efficiently, supporting non-specialists such as general pediatricians to conduct initial assessments under remote guidance, and reducing geographic barriers for families, telehealth has the potential to directly address the challenges outlined above. Telehealth is defined as the use of technological approaches to enable individuals to receive professional help and services remotely, thereby replacing or complementing traditional face-to-face methods. 20 Common technological approaches used in telehealth include live video conferencing, “store-and-forward” electronic transmissions (e.g. videos, audios, documents), mobile health applications, and remote patient monitoring. Several reviews have explored the use of telehealth in autism screening and diagnosis. Among the various modalities, video has emerged as particularly effective because it directly supports behavioral observation, which is the foundation of autism screening and diagnosis. Two main video-based formats are commonly applied: live video conferencing and store-and-forward video recording.20–25 The COVID-19 pandemic has further accelerated the adoption of telehealth, with increased interest in novel approaches such as machine-learning-based analysis of short videos, a method overlooked in prior reviews. Unlike video reviews, which rely directly on expert judgment to identify and interpret behavioral features and may be subject to bias, machine-learning approaches are trained on expert-labeled data but then automatically extract and classify behavioral cues from video input. As such, they hold the potential to provide more scalable, rapid, and objective assessments once trained. Furthermore, no meta-analysis has yet systematically assessed the effectiveness of video-based telehealth technologies for autism screening and diagnosis. This meta-analysis aims to fill this gap by providing a comprehensive synthesis of existing studies, examining both traditional video-based approaches (i.e. video conferencing and video recording) and the emerging use of machine learning for more objective assessments. By doing so, this review seeks to offer valuable insights into the effectiveness of telehealth in autism screening and diagnosis and its potential to address global challenges in autism detection.
Identifying the research question
This systematic review and meta-analysis synthesized studies that used video-assisted telehealth technologies to screen and diagnose autism in children. The primary research questions guiding this study were: (1) What video-based telehealth technologies are used in the screening and diagnosis of autism in children? and (2) How effective are these technologies? Following the PICO framework, the primary questions can be expressed as: Population—children being screened or diagnosed for autism; Intervention—video-based telehealth technologies; Comparison—standard in-person autism assessments or reference diagnostic tools; and Outcome—diagnostic accuracy. Secondary research questions included: (3) How does the function (screening vs. diagnosis) of telehealth technologies influence their effectiveness? (4) How does the category (video conferencing, video recording, or machine learning using short videos) of telehealth technologies influence their effectiveness? (5) What is the quality of the studies included in the review? and (6) Is there evidence of publication bias?
Methods
This study was carried out in accordance with the systematic review process recommended by Preferred Reporting Items for Systematic Reviews and Meta-Analyses (PRISMA) guidelines (see Figure 1). The protocol for this systematic review was registered on PROSPERO (CRD42022376674).

PRISMA flow diagram for determining study inclusion. PRISMA: Preferred Reporting Items for Systematic Reviews and Meta-Analyses.
Search strategy
A systematic search of the literature was conducted using the databases of PubMed and Web of Science (all databases) for articles published up to November 20, 2024. All fields (i.e. PubMed) or Topic (i.e. Web of Science) were searched using a combination of keywords to describe autistic children (i.e. [Autis* OR Asperger* OR ASD* OR pervasive developmental disorder] AND [child* OR toddler*]), video-assisted telehealth technology (i.e. video* OR tele* OR telehealth*), and screening and diagnosis terms (i.e. screen* OR diagnos* OR assess* OR evaluat*). The initial search was completed on April 14th, 2022, with two subsequent updates: the first on July 16th, 2023 and the latest on November 20th, 2024 to include studies published after each of the previous searches. The search yielded a total of 4991 papers, with 3517 remaining after removing duplicates.
Criteria for selection of studies
Studies were included in the review if they met the following inclusion criteria:
used video-assisted telehealth technology to facilitate autism screening or diagnosis, included a study population of children (aged <16 years), diagnosed with autism or suspected of having autism, published in English and in peer-reviewed journals.
Studies were excluded if they:
described the technology without reporting psychometric properties (e.g. diagnostic accuracy, sensitivity, specificity, reliability, validity, or acceptability from clinicians or parents/caregivers), used a telehealth technology but did not involve video-assisted components (e.g. text-based), used a telehealth technology but relied solely on experts (e.g. clinicians) in the screening/diagnostic process, without the involvement of non-experts (e.g. parents/caregivers), limiting the scalability of the technology, were case studies (i.e. sample size = 1), were a book chapter, dissertation, review article, or conference papers, focused primarily on interventions for autism, rather than on diagnostic or screening purposes.
Selection process
The set of studies was screened by LW based on inclusion and exclusion criteria using a three-stage process of reviewing titles, abstracts, and full texts. Given the large number of records retrieved in the initial search, to balance rigor and feasibility, ZYM independently double-screened a randomly selected 50% sample (n = 1112). In addition, ZYM independently double-screened all studies from the first update search (n = 560), and YPW double-screened all studies from the second update search (n = 736). Although this approach deviates from the gold standard of 100% dual independent screening, it provided a robust check of consistency. Across the 1112 records double-screened in the initial search, the raters disagreed on eight studies, yielding a raw agreement rate of 99.3%. Cohen's kappa was 0.76 (p < 0.001), indicating substantial agreement after adjusting for chance. Any disagreements were resolved through team discussions, resulting in a final selection of 41 articles that met the inclusion criteria.
Data extraction
Data for the included studies were extracted independently by LW and ZYM for the initial search and first update, and by LW and YPW for the second update. A predefined standard data extraction form in Excel was used, capturing the following details: (1) author, year, and location, (2) technology details (i.e. name, description, activity, signs of autism considered, scoring, category, function), (3) participant characteristics (i.e. sample size, diagnosis, age, sex), (4) other reference standards used, and (5) results. Reference standards were categorized to reflect how diagnostic confirmation was established. Some studies relied on an existing diagnosis, where participants had already received a formal diagnosis prior to enrollment. Others involved the research team providing an in-person diagnosis, based on face-to-face clinical assessments, or providing an online diagnosis, based on remote assessments. Studies that did not report whether a formal diagnosis was obtained were coded as NA.
Quality assessment
The quality of all included studies was assessed using the Critical Appraisal Skills Programme (CASP) diagnostic study checklist. 26 The first 10 items were rated, while the remaining two were excluded due to their subjective nature (i.e. “Were all outcomes important to the individual or population considered?” and “What would be the impact of using this test on your patients/population?”). A three-point rating system developed by previous studies was used to assign scores for each of the CASP criteria.27,28 A score of 1 indicated a high risk of bias, assigned to papers with little to no justification or explanation for the issue; a score of 2 indicated moderate risk of bias, assigned to papers that partially addressed the issue but did not fully elaborate; and a score of 3 indicated low risk of bias, given to papers that extensively justified and explained the issue. CASP scores were used to assess the quality of the included studies but did not serve as a basis for excluding any studies. To evaluate the robustness of the meta-analysis findings, we conducted a sensitivity analysis excluding studies rated as high risk of bias on CASP Question 8 (i.e. confidence in the results). LW and ZYM independently assessed the studies from the initial search and first update, while ZYM and YPW assessed the studies from the second update. Discrepancies were discussed and resolved collaboratively by the team.
Statistical analysis
Meta-analyses were conducted using the meta package 29 in RStudio 30 to evaluate the effectiveness of video-assisted telehealth technologies for autism screening and diagnosis. Sensitivity and specificity were the primary outcome measures, representing the proportion of correctly identified autistic and non-autistic participants, respectively. Four parameters were extracted from each study, namely true positives, false negatives, false positives, and true negatives. For studies that did not report these parameters, sensitivity and specificity values, along with the number of autistic and non-autistic participants, were used to calculate these missing parameters. Studies that lacked sufficient data to derive these parameters were excluded from the analysis. For studies that reported inconclusive or indeterminate cases, we extracted and analyzed only definitive classifications as reported by the authors, while it may result in inflated performance estimates. To ensure statistical stability, studies reporting sensitivity or specificity values of 100% were excluded from the primary meta-analysis, as these values result in zero variance and can disproportionately distort pooled estimates. However, given that excluding these studies may underestimate the maximum possible effectiveness of some tools, we conducted a sensitivity analysis in which 100% values were included. Separate random-effects meta-analyses were conducted for sensitivity and specificity using a generalized linear mixed model (GLMM) with a logit transformation to stabilize variance and normalize the distribution. This approach accounted for variability across studies while providing robust parameter estimates. Meanwhile, a GLMM is a one-stage framework that models binary outcomes directly through the binomial distribution and can accommodate extreme proportions (0% or 100%) without the need for continuity correction. 31 Heterogeneity was assessed using the I2 statistic, which quantifies the proportion of total variability due to heterogeneity rather than sampling error, and the Q statistic, which tests for heterogeneity across studies. I2 values were interpreted as follows: low heterogeneity (25% or less), moderate heterogeneity (25–50%), and high heterogeneity (greater than 50%). 32 Subgroup analyses were performed to explore potential sources of heterogeneity and assess how the Function (i.e. screening vs. diagnosis) and Category (i.e. video conferencing, video recording, and machine learning) of the technologies influenced effectiveness. Subgroup differences were also assessed using a chi-squared test for subgroup differences, with a p < 0.05 indicating significant variation between subgroups. Forest plots were generated to display study-specific sensitivity and specificity estimates with their 95% confidence intervals (CIs), pooled results, and subgroup analyses. Publication bias was evaluated using funnel plots for sensitivity and specificity. Funnel plot asymmetry, indicative of potential publication bias, was further assessed using Egger's regression test, with p < 0.05 suggesting significant bias.
Results
Study characteristics
A total of 41 articles met the selection criteria for our systematic review. Data on technology category, technology name, sample size, participant age, gender, and function are presented in Table 1. Most studies included in this review were from the United States (n = 29) or from collaborative projects between the United States and South Africa (n = 1) or Bangladesh (n = 1), with the remaining studies from China (n = 3), Italy (n = 2), India (n = 1), Australia (n = 1), Czech (n = 1), Egypt (n = 1), and Indonesia (n = 1). Years of publication ranged from 2013 to 2024. Sample sizes varied across studies, with the smallest autism group comprising four participants and the largest comprising 272 participants.
Summary of study characteristics.

DD: developmental delay; LD: language delay; TD: typical development; SLC: speech and language conditions; other: developmental delays and conditions other than autism; LR: low likelihood of autism; HR: high likelihood of autism; ED: existing diagnosis; IPD: in-person diagnosis; OD: online diagnosis in the age range; y: years; m: months; STAT: Screening Tool for Autism in Toddlers and Young Children; TEDI: Telehealth Assessment of Social Communication; ADEC-V: Autism Detection in Early Childhood-Virtual; NODA: Naturalistic Observation Diagnostic Assessment; SORF: Systematic Observation of Red Flags; VIRSA: Video-referenced Infant Rating System for Autism; teleNIDA: Telehealth Network for Early Detection of Autism Spectrum Disorders; IMES: Infant Motor and Engagement Scale.
Most studies categorized participants into autism and non-autism groups either based on pre-existing diagnoses (n = 21) or through in-person diagnostic assessments conducted during the study (n = 12). Eight studies recruited participants suspected of having autism but did not administer in-person diagnostic assessments, primarily due to constraints imposed by the COVID-19 pandemic. Participants across studies were infants or toddlers (e.g. 0 to 36 months; n = 16), pre-schoolers (e.g. 36 to 72 months; n = 2), a combination of toddlers and pre-schoolers (n = 13), or toddlers/pre-schoolers, school-age children, and adolescents (e.g. 18 years and below; n = 9). The study from Egypt 33 was a re-analysis of an existing dataset collected from the United States. 34 Six of the 41 studies did not report the gender ratio of participants. Regarding the function of technologies, 22 studies focused on diagnosis and 19 on screening.
Quality assessment
The quality assessment results are presented in Figure 2. Overall, the quality scores of the selected studies varied, ranging from 17 to 30 (mean = 25.71, SD = 3.11). All studies clearly defined their research questions, though varying degrees of bias risk were observed across other items. When grouped by function, studies focused on screening had a slightly higher mean quality score (mean = 25.90, SD = 3.04, range = 19–30) than those focused on diagnosis (mean = 25.52, SD = 3.23, range = 17–30). However, an analysis of variance (ANOVA) indicated that this difference was not statistically significant (F(1,39) = 0.15, p = 0.70, η2p = 0.004). By category, video recording studies achieved the highest average quality score (mean = 26.69, SD = 2.70, range = 22–30), followed by machine-learning studies (mean = 26.00, SD = 2.67, range = 22–30), and video conferencing studies (mean = 24.47, SD = 3.52, range = 17–29). Again, ANOVA revealed that these differences were not statistically significant (F(2,38) = 2.15, p = 0.13, η2p = 0.10).

Risk of bias graph displaying the percentage of studies for each bias item.
Categories of video-assisted telehealth technology
Out of the 41 studies reviewed, 15 focused on video conferencing, 16 on video recording, and 10 on machine learning. Specifically, video conferencing allows non-experts, such as parents or caregivers, to receive real-time clinical guidance, facilitating remote assessments without requiring formal autism screening or diagnostic training. In contrast, video recording enables parents or caregivers to share visual information about their child's behaviors with professionals asynchronously, eliminating the need for simultaneous participation from clinicians and families. Machine learning, meanwhile, analyzes short home videos, providing rapid detection, reducing reliance on human resources, and offering an objective foundation for clinical judgment of autism in telehealth. The following section summarizes these telehealth technologies within their respective video-usage categories.
Video conferencing
The earliest attempts to use video conferencing in autism practices for telehealth were conducted by Reese et al.35,36 They compared diagnostic accuracy and inter-rater agreement on ADOS-2/ADI-R under two conditions: in-person (InP) and interactive video conferencing (IVC). Parents were randomly assigned to IVC condition or InP setting, where they were coached by Reese on how to perform ADOS-2 activities to elicit behaviors associated with autism. Both studies found no significant differences between InP and IVC in terms of diagnostic accuracy, ADOS-2 observation, or reliability of ADI-R scores. These results suggest that parents can be coached via IVC to properly complete assessments with their child, and clinicians can make a reliable diagnosis of autism through IVC assessments. Moreover, Reese et al. 35 investigated parent satisfaction with the diagnostic procedures and IVC experience, using a 7-point Likert scale. The scores of 6.57 and 6.23 for the InP and IVC conditions, respectively, indicated that families were highly satisfied regardless of the condition.
In contrast to Reese et al.,35,36 who investigated the use of video conferencing for existing autism assessments (e.g. ADOS-2), several studies have utilized video conferencing for novel technologies (as shown in Table 2), including the Screening Tool for Autism in Toddlers and Young Children, the Telehealth Assessment of Social Communication, the Autism Detection in Early Childhood-Virtual (ADEC-V), the Brief Observation of Symptoms of Autism (BOSA), and the TELE-ASD series (TAP).
Summary of the features of the new video conferencing technologies.

STAT: Screening Tool for Autism in Toddlers and Young Children; ADEC-V: Autism Detection in Early Childhood-Virtual; AOSI: Autism Observation Scale for Infants; ECI: Early Communication Index; ADOS-2: Autism Diagnostic Observation Schedule, Second Edition; BOSA-MV: Brief Observation of Symptoms of Autism-Minimally Verbal; BOSA-PSYF: Brief Observation of Symptoms of Autism-Phrase Speech-Young Fluent; BOSA-F1: Brief Observation of Symptoms of Autism-Fluent 1; BOSA-F2: Brief Observation of Symptoms of Autism-Fluent 12; TEDI: Telehealth Assessment of Social Communication; TAP: TELE-ASD series; y: years; m: months.
Video recording
Fusaro et al. 37 aimed to explore the potential of brief and unstructured home videos for more rapid detection of core features of autism outside of the clinical setting. The authors collected publicly available videos on YouTube, including videos of 100 children aged 1–15 years with (n = 45) and without (n = 55) a self-reported diagnosis of autism. Four non-clinical raters independently scored all videos using the coding scheme of ADOS-G module 1. Results showed that the videos yielded a classification accuracy of 96.8%, sensitivity of 94.1%, specificity of 100%, and inter-rater correlation of 0.88 for the behavioral domain of ADOS-G. Despite the fact that the videos were diverse, and all videos were scored using module 1 without regard to participants’ language ability and age, the findings suggest that the use of brief, unstructured home videos to detect autism has the potential to yield high classification accuracy even for non-clinical personnel.
In addition to the use of unstructured home videos, Sutantio et al. 38 and Kadam et al. 39 further investigated the use of semi-structured home videos in which parents were instructed to record their child in specific scenes, such as interactive play or playing alone. Compared to in-person assessments of autism, the accuracy of using video recordings for diagnosing autism was 82.5%, sensitivity was 91.3%, and specificity was 70.6%. 38 Thus, the telehealth approach to diagnosing autism using semi-structured video recordings has considerable validity.
In light of the empirical evaluation of the accuracy and validity of the use of video recordings in telehealth assessments of autism, several studies have developed novel assessment technologies using short videos for autism screening and diagnosis, such as the Naturalistic Observation Diagnostic Assessment, the Systematic Observation of Red Flags (SORF), Cognoa, the Telehealth Network for Early Detection of Autism Spectrum Disorders (teleNIDA), the Infant Motor and Engagement Scale (IMES), and the Video-referenced Infant Rating System for Autism (VIRSA), as shown in Table 3.
Summary of the features of the new video recording technologies.

NODA: Naturalistic Observation Diagnostic Assessment; DSM-5: Diagnostic and Statistical Manual of Mental Disorders-V; SORF: Systematic Observation of Red Flags; VIRSA: Video-referenced Infant Rating System for Autism; teleNIDA: Telehealth Network for Early Detection of Autism Spectrum Disorders; IMES: Infant Motor and Engagement Scale; m: months.
Machine learning using short videos
Table 4 summarizes studies applying machine learning to short videos for autism detection, highlighting the evolution from early experimental algorithms to practical, privacy-preserving applications. Abbas et al.40,41 utilized Cognoa telehealth technology, developing algorithms that significantly outperformed standard assessments, such as M-CHAT and CBCL. Their work established the feasibility of combining structured questionnaires and home video analysis for accurate diagnoses. Tariq et al.34,42 expanded this by testing multiple machine-learning models on short home videos. Their LR5 classifier achieved 88.9% accuracy, 94.5% sensitivity, and 77.4% specificity, and maintained strong performance in an independent dataset. Extending this to a Bangladeshi sample, they demonstrated the adaptability of machine learning across diverse populations, though performance varied when distinguishing developmental subgroups (e.g. autism and speech and language conditions).
Summary of the features of machine-learning technologies using videos.

m: months; y: years; TD: typical development.
Recognizing challenges with video variability which may affect feature measures, Leblanc et al. 43 introduced feature imputation and replacement methods, enhancing classifier performance on YouTube video datasets. Meanwhile, as previous machine-learning studies all used non-expert raters and the results were promising, Washington et al.44,45 therefore tested the hypothesis that a qualified crowd of non-expert workers recruited from paid platforms can efficiently tag features needed to run machine-learning models for accurate detection of autism. They demonstrated the feasibility of using crowdsourced non-expert raters to tag video features while addressing privacy concerns. Their findings showed that machine-learning models, even under privacy-preserving conditions, could achieve ≥96% accuracy, sensitivity, and specificity.
To assist healthcare providers, Megerian et al. 46 developed an artificial intelligence (AI)-based device integrating caregiver questionnaires, video analysis, and healthcare provider input, achieving 98.4% sensitivity and 78.9% specificity. Lastly, Paolucci et al. 47 proposed a pre-screening tool focusing on sensorimotor, behavioral, and emotional features to identify potentially alarming signs in pre-verbal interactions. The use of these features is evaluated using an explainable AI algorithm to assess which of the proposed new interaction characteristics were more effective in classifying autism and non-autism. These results demonstrated the significance of early detection of body-related sensorimotor features, achieving ≥85% sensitivity and ≥86% through explainable AI techniques. Unlike traditional binary classification, machine-learning models can generate probability scores that can be used to flag low-confidence or indeterminate cases. Among the included studies, three explicitly reported indeterminate cases. Abbas et al. 41 incorporated a 30% inconclusive allowance, which improved sensitivity to 90% and specificity to 83%, compared with 80% sensitivity and 75% specificity in models without such an allowance. Tariq et al. 34 excluded 39% of cases (26/66) as inconclusive, yielding a balanced sensitivity of 91.3% and specificity of 88.2%, compared with initial values of 87.8% and 72.7%, respectively. By contrast, Megerian et al. 46 reported the highest rate of indeterminate results, with 68.2% of cases (290/425) classified as inconclusive, highlighting the need for further refinement.
Diagnostic accuracy of video-assisted telehealth technology
The sensitivity and specificity of video-assisted telehealth technologies were evaluated in 19 of the 41 included studies. The remaining 22 studies were excluded from the meta-analysis for the following reasons: 7 reported only reliability, validity, or acceptability outcomes without diagnostic accuracy metrics; 10 did not provide enough information on true positives, false positives, true negatives, and false negatives to calculate diagnostic accuracy; and 5 reported 100% sensitivity or specificity. The 19 studies included in the meta-analysis had quality scores ranging between 25 and 30. Figure 3 presents the risk of bias for the meta-analysis set, with additional subgroup graphs provided for function (screening vs. diagnosis) and category (video conferencing, video recording, and machine learning).

Risk of bias graphs for studies included in the meta-analysis. (a) Overall summary for all 19 studies; (b) subgroup: screening studies; (c) subgroup: diagnosis studies; (d) subgroup: video conferencing studies; (e) subgroup: video recording studies; and (f) subgroup: machine-learning studies.
Two studies reported results for two different technologies within the same paper,48,49 and these were extracted separately, resulting in a total of 21 datasets included in the meta-analysis. The forest plots summarizing the pooled sensitivity and specificity for all 21 datasets are presented below (see Figure 4). The pooled sensitivity was 0.88 (95% CI: 0.84–0.91), indicating a high proportion of correctly identified autistic participants across studies. The pooled specificity was 0.76 (95% CI: 0.72–0.80), reflecting a moderate ability to correctly identify non-autistic participants. Across individual datasets, sensitivity values were consistently above 0.75, while specificity values exceeded 0.50. Heterogeneity was assessed using the I2 and Q statistics. The results showed a significant degree of heterogeneity for sensitivity (I2 = 61.3%, Q = 51.72, df = 20, p < 0.001), suggesting variability in sensitivity across datasets. In contrast, there was no significant heterogeneity for specificity (I2 = 22.6%, Q = 25.82, df = 20, p = 0.17), indicating greater consistency in the specificity estimates across datasets. These findings highlight the need for further subgroup analyses to explore potential sources of variability in sensitivity.

Forest plot showing the sensitivity (a) and specificity (b) estimates of video-assisted telehealth technologies across 21 datasets.
Subgroup analysis by function and category
As shown in Figure 5, the subgroup analysis by function revealed that telehealth technologies used for diagnosis had higher pooled sensitivity (0.92, 95% CI: 0.89–0.94) and specificity (0.82, 95% CI: 0.78–0.87) compared to those used for screening (sensitivity = 0.83, 95% CI: 0.79–0.87; specificity = 0.72, 95% CI: 0.69–0.76). These differences were statistically significant, as indicated by the chi-squared tests for subgroup differences (sensitivity: χ2 = 12.66, df = 1, p < 0.001; specificity: χ2 = 10.83, df = 1, p = 0.001). Regarding heterogeneity, sensitivity showed significant heterogeneity among screening datasets (I2 = 64%, Q = 25.03, k = 10, p = 0.003), whereas heterogeneity was negligible for diagnosis datasets (I2 = 0%, Q = 8.51, k = 11, p = 0.58). For specificity, both screening (I2 = 0%, Q = 7.94, k = 10, p = 0.54) and diagnosis (I2 = 0%, Q = 9.94, k = 11, p = 0.45) showed low heterogeneity, indicating consistent specificity estimates across datasets within each function. These results suggest that the function of the telehealth technology (screening vs. diagnosis) was a major source of the pooled variability in sensitivity, with the observed heterogeneity largely driven by the screening datasets.

Forest plot showing the sensitivity (a) and specificity (b) estimates of video-assisted telehealth technologies by function.
As shown in Figure 6, the subgroup analysis by category demonstrated differences in the sensitivity and specificity of telehealth technologies across the three categories. Machine-learning technologies achieved the highest pooled sensitivity (0.93, 95% CI: 0.87–0.96), followed by video conferencing (0.91, 95% CI: 0.86–0.94) and video recording (0.80, 95% CI: 0.76–0.84). Heterogeneity was low for machine learning (I2 = 18.3%, Q = 4.90, k = 5, p = 0.30) and video recording (I2 = 5%, Q = 7.37, k = 8, p = 0.39), while moderate heterogeneity was observed for video conferencing (I2 = 36.7%, Q = 11.05, k = 8, p = 0.14). The chi-squared test for subgroup differences confirmed statistically significant variation in sensitivity among the three categories (χ2 = 18.67, df = 2, p < 0.001). For specificity, machine learning also performed the best, with a pooled specificity of 0.83 (95% CI: 0.78–0.88), followed by video conferencing (0.75, 95% CI: 0.68–0.81) and video recording (0.73, 95% CI: 0.68–0.77). Heterogeneity was low for machine learning (I2 = 0%, Q = 3.38, k = 5, p = 0.50) and video conferencing (I2 = 0%, Q = 3.04, k = 8, p = 0.88), while moderate heterogeneity was observed for video recording (I2 = 32.8%, Q = 10.41, k = 8, p = 0.17). Subgroup differences in specificity across the three categories were statistically significant (χ2 = 8.47, df = 2, p = 0.01).
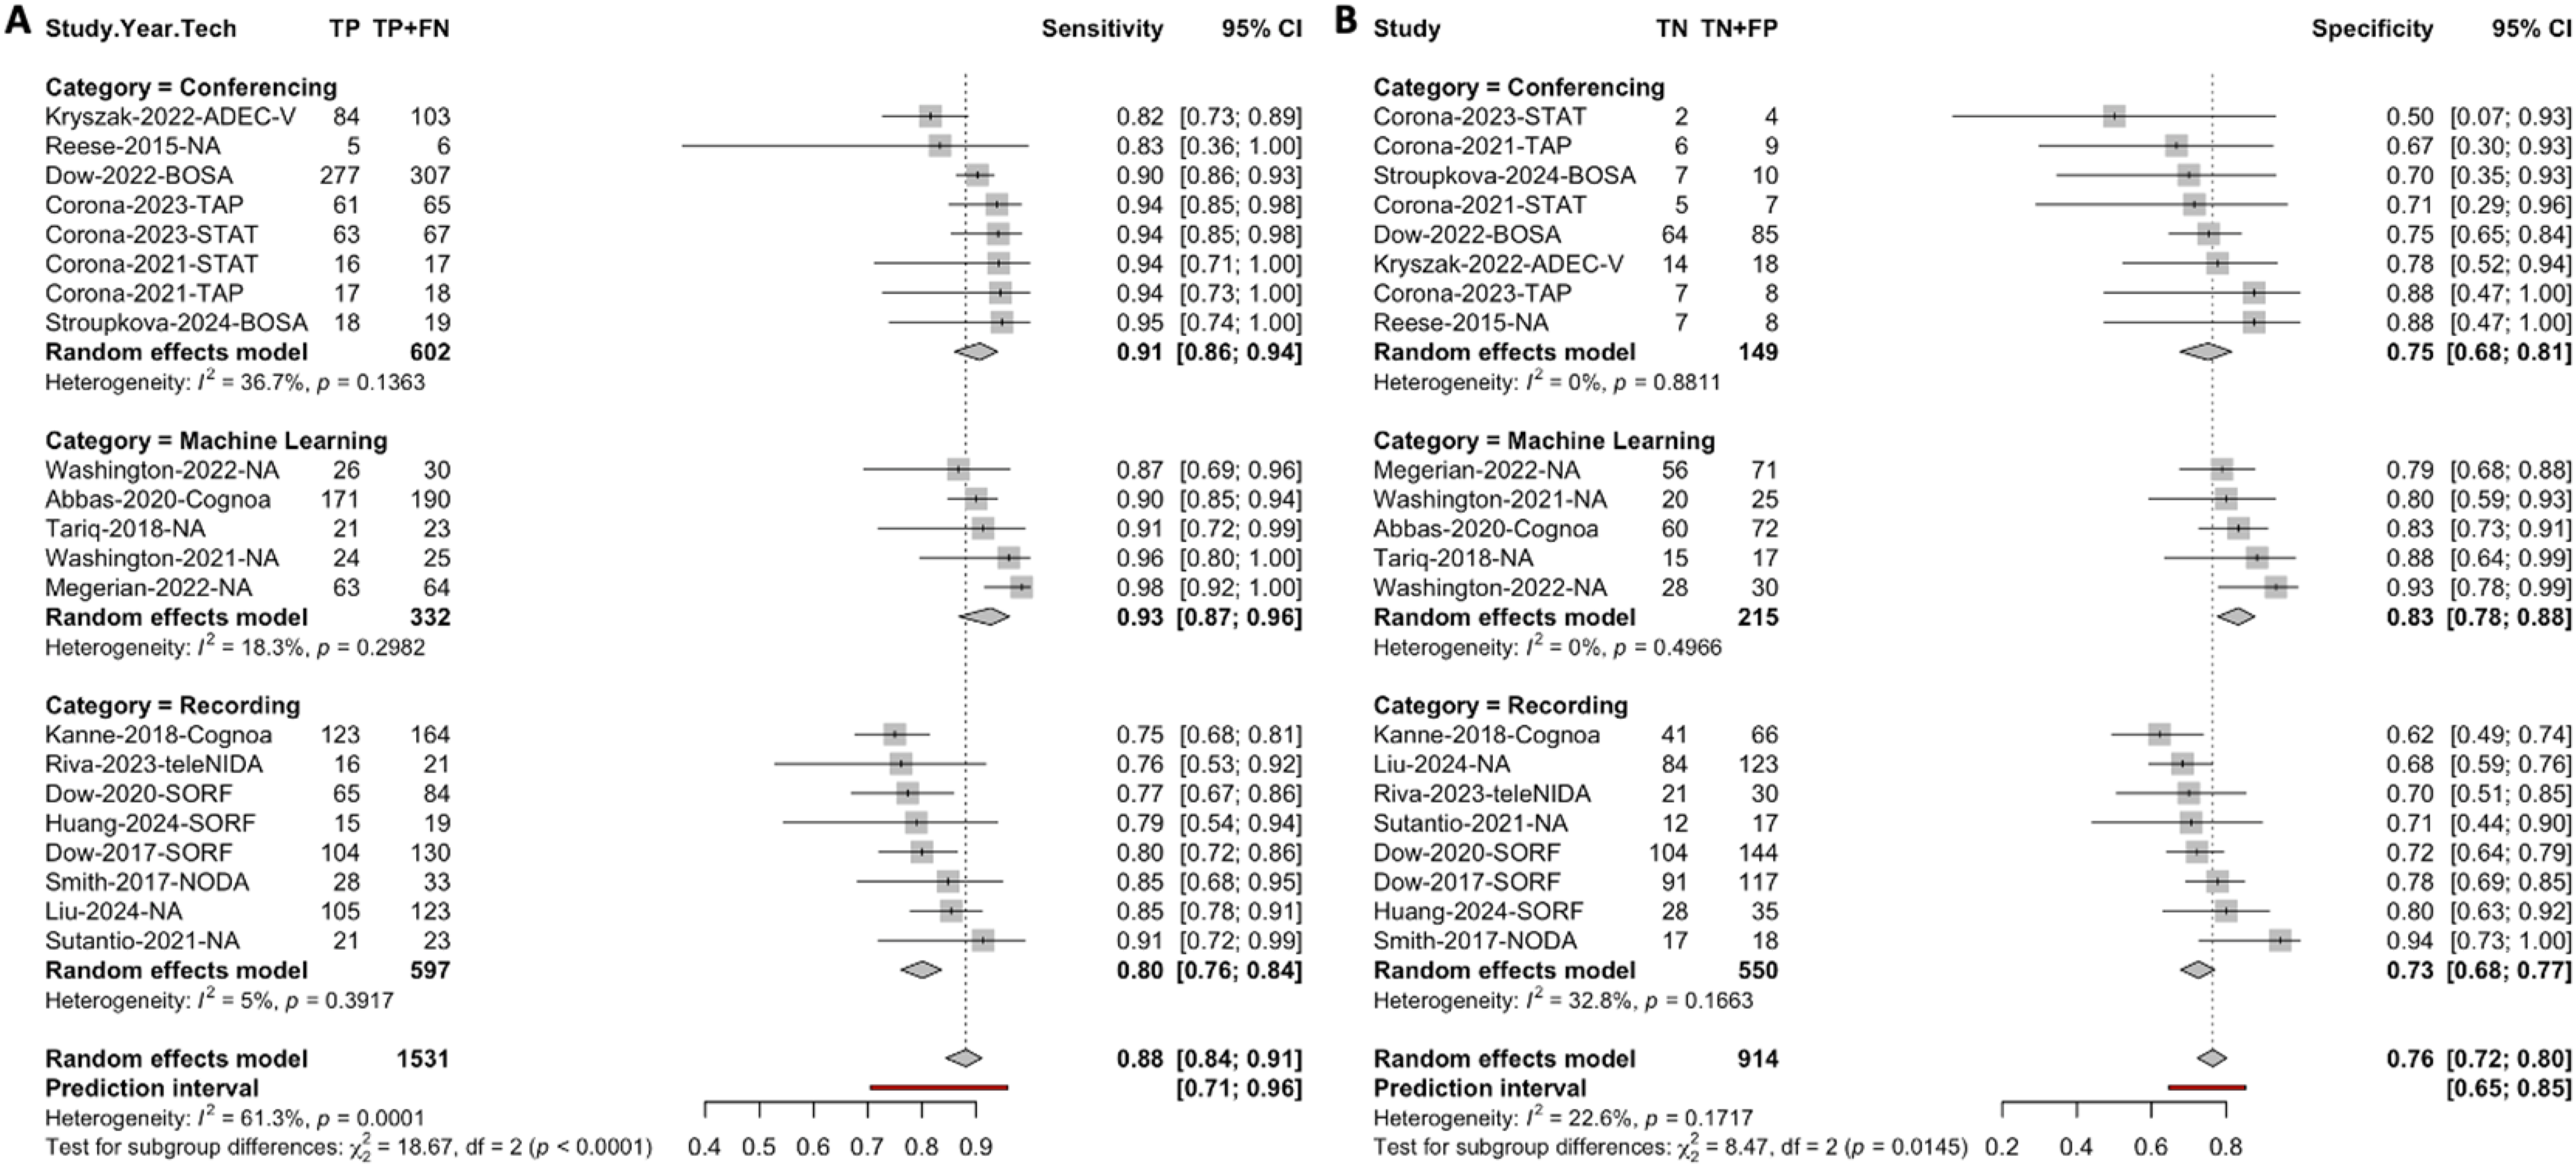
Forest plot showing the sensitivity (a) and specificity (b) estimates of video-assisted telehealth technologies by category.
Sensitivity analysis
Two sensitivity analyses were conducted to examine the impact of special cases on the pooled results, including studies with 100% performance and studies with high risk of bias on the results.
First, to assess the influence of studies reporting perfect performance, we conducted a sensitivity analysis including the five studies with 100% values (n = 1 with 100% sensitivity; n = 4 with 100% specificity). All five studies were from the video recording category, with two focused on diagnosis and three on screening. After including these studies, the pooled sensitivity and specificity both increased 0.02 to 0.90 (95% CI: 0.86–0.92) and to 0.78 (95% CI: 0.72–0.83) respectively. However, significant heterogeneity was observed in both sensitivity (I2 = 60.1%, Q = 62.73, df = 25, p < 0.001) and specificity (I2 = 38.3%, Q = 40.55, df = 25, p = 0.03) (see Supplemental Figures S1–S3). Subgroup analyses showed that these studies did not affect results by function. By category, unlike the main analysis, no significant differences in sensitivity or specificity were observed across the three categories. Nonetheless, the overall heterogeneity was mainly driven by video recording technologies, whereas video conferencing and machine-learning categories continued to show low heterogeneity. This sensitivity analysis indicates that including studies with 100% values slightly improved pooled accuracy but introduced additional heterogeneity, while also attenuating the differences observed between categories in the main analysis.
Second, among the 21 datasets included in the main analysis, 4 were rated as high risk of bias on CASP Question 8 (i.e. confidence in the results). All four were from the video conferencing category, with two focused on screening and two on diagnosis. After excluding these datasets, the pooled sensitivity decreased slightly to 0.87 (95% CI: 0.83–0.91), while specificity increased slightly to 0.77 (95% CI: 0.72–0.81) (see Supplemental Figures S4–S6). The pattern of heterogeneity remained unchanged, and subgroup analyses showed no impact on results by function or category. This sensitivity analysis indicated that excluding studies with high risk of bias on CASP Question 8 had minimal influence on the pooled estimates or subgroup findings.
Publication bias
The Egger regression test for funnel plot asymmetry was performed to assess potential publication bias in the pooled sensitivity and specificity estimates. For sensitivity, the estimated bias was 1.26 (t = 2.00, df = 19, p = 0.06, SE = 0.63), and for specificity, the estimated bias was 0.71 (t = 1.45, df = 19, p = 0.16, SE = 0.49). Neither test provided strong evidence for significant asymmetry, indicating that the results are unlikely to be substantially influenced by publication bias (see Figure 7).
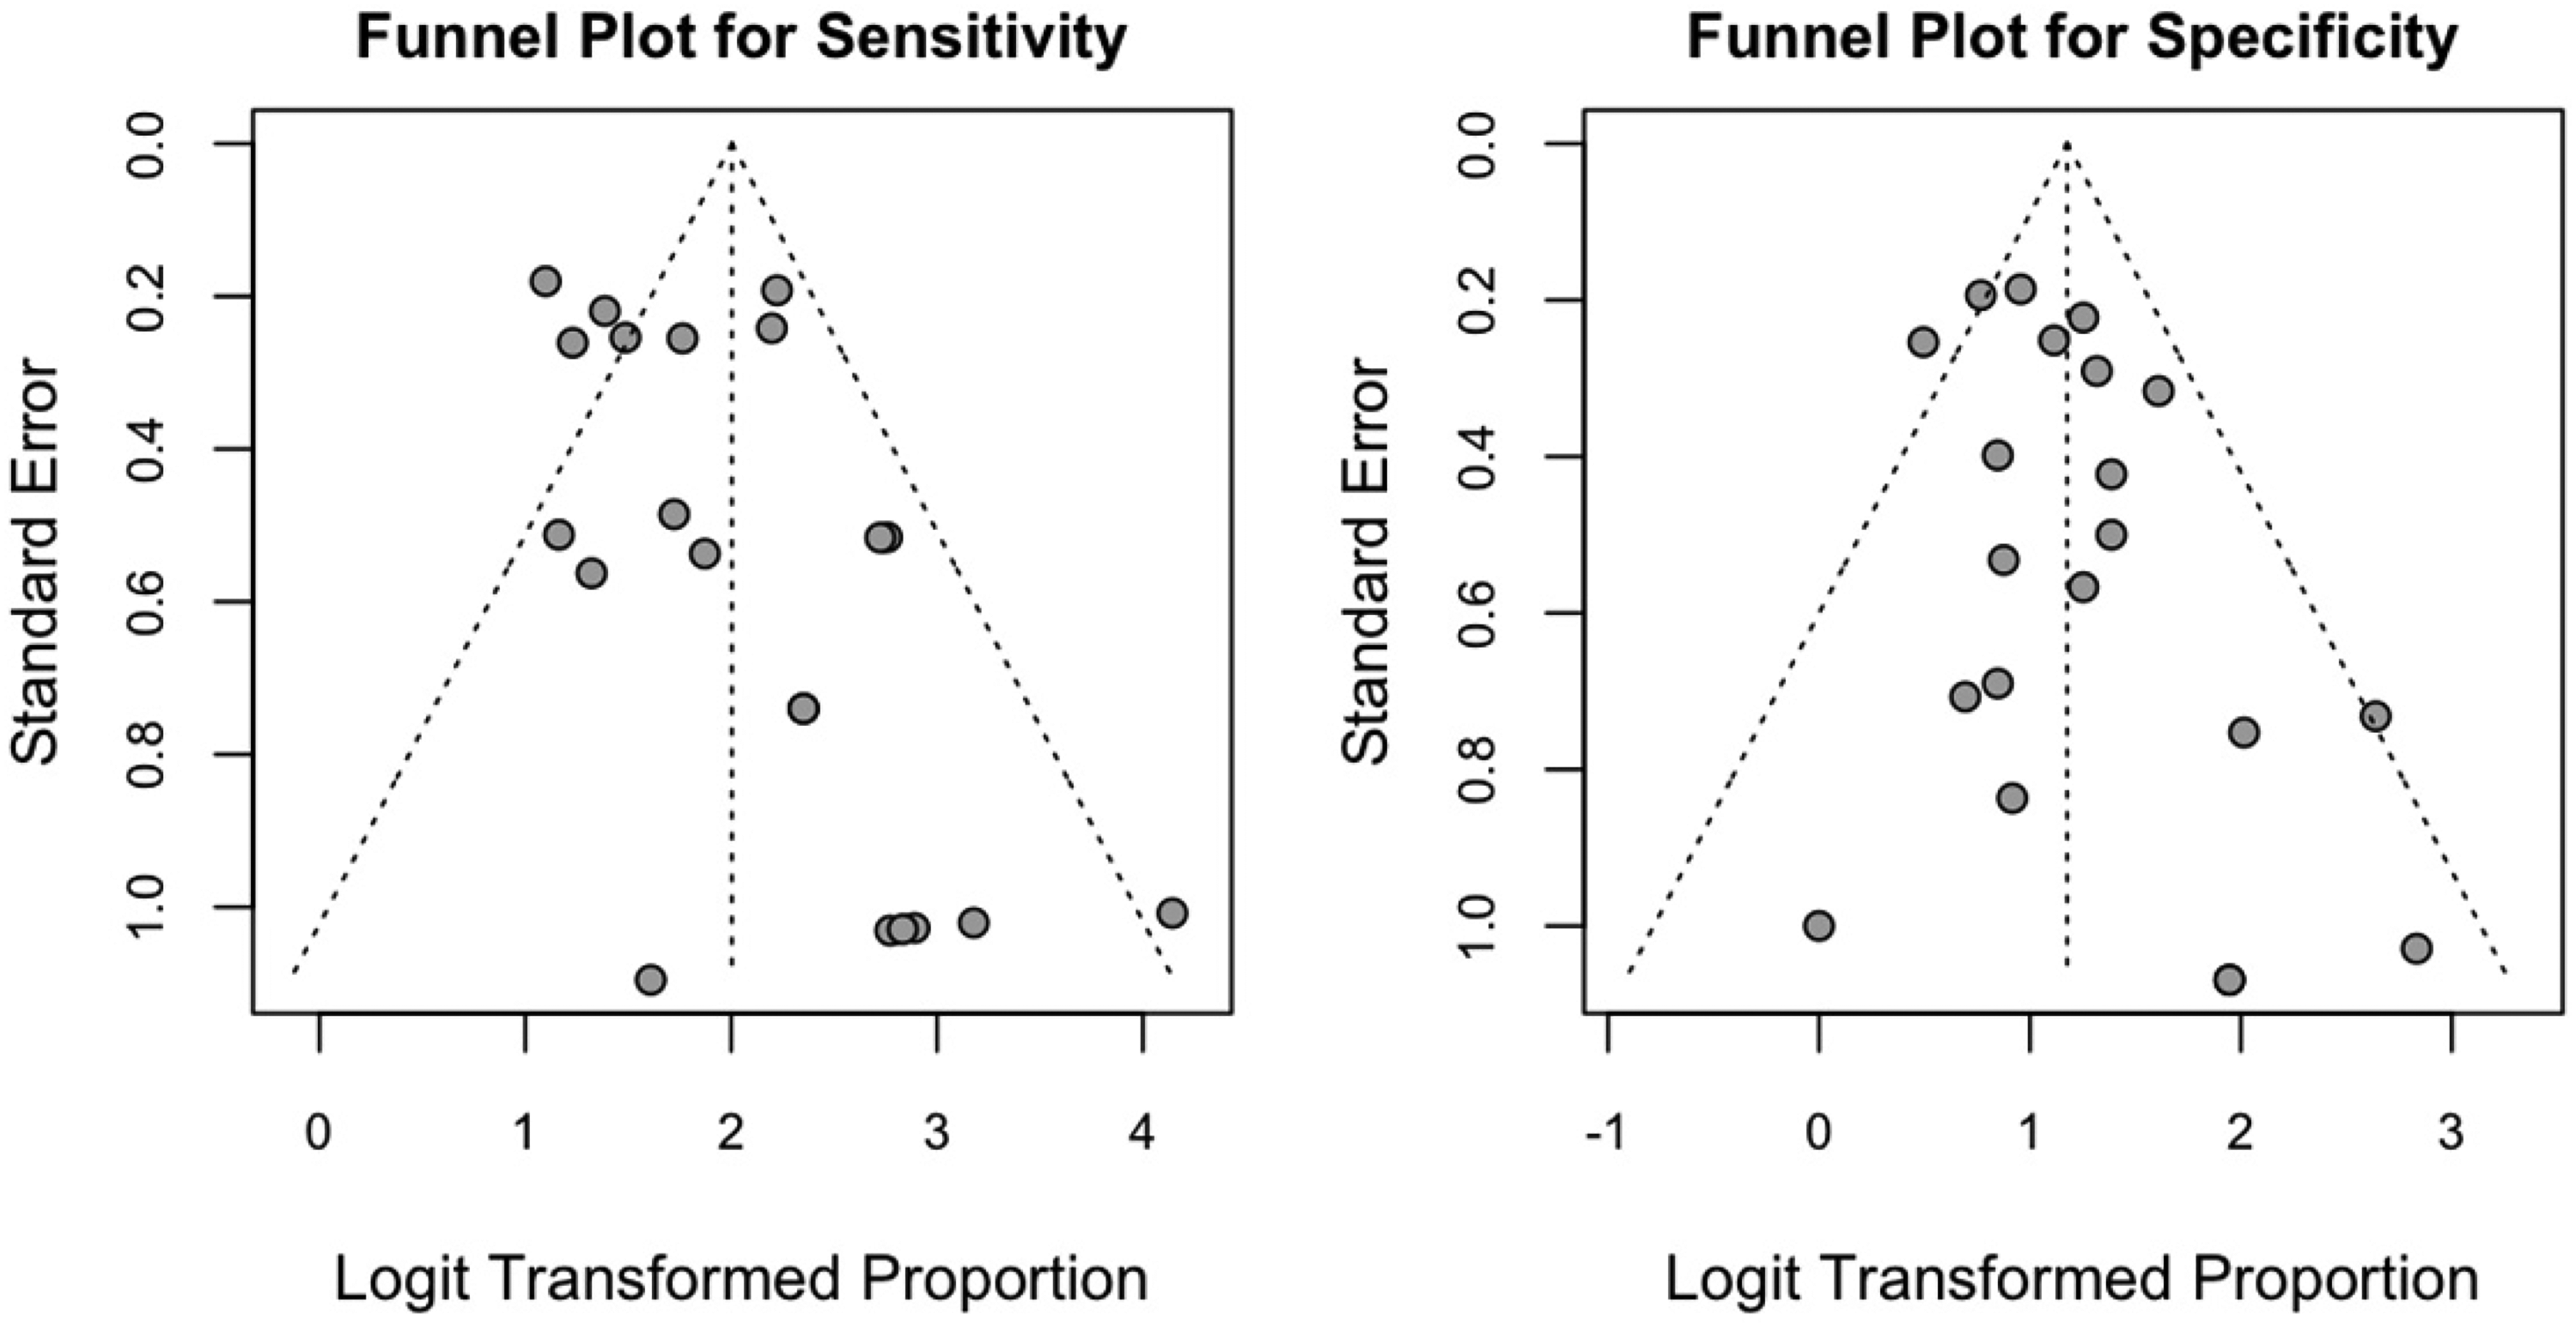
Funnel plots for sensitivity (left) and specificity (right) of the included studies.
Discussion
This systematic review and meta-analysis evaluated the effectiveness of video-assisted telehealth technologies for autism screening and diagnosis in children. A total of 41 studies published between 2013 and 2024 were included, with a notable surge in recent years, particularly following the COVID-19 pandemic. This increase likely reflects the growing demand for remote healthcare solutions due to the pandemic and underscores the expanding potential of telehealth technologies in autism care. However, it is worth noting that the studies reviewed were predominantly conducted in the United States, with limited representation from other regions. This imbalance is especially important given that research has consistently shown how culture shapes autism identification and diagnostic processes. 50 For instance, cultural norms influence expectations and expressions of social communication, a core diagnostic feature of autism. 51 Such differences can contribute to disparities in recognition and underdiagnosis across underrepresented cultural groups. A recently proposed conceptual framework further highlights how broader cultural factors, including norms of behavior, parenting practices, mental health literacy, and healthcare access, shape how autism symptoms are expressed, recognized, interpreted, and reported. 52 These findings underscore that the technologies developed in one cultural context may not directly translate to others. This disproportionate representation highlights the need for more research from diverse regions, particularly developing countries, to better understand how these technologies can function across varied healthcare settings and socioeconomic contexts.
The main meta-analysis included 19 studies, with pooled sensitivity and specificity values of 0.88 (95% CI: 0.84–0.91) and 0.76 (95% CI: 0.72–0.80), respectively. These results suggest that video-assisted telehealth technologies are effective tools for identifying autistic children and distinguishing them from non-autistic children. The findings are consistent with previous research in other medical fields,53,54 which have also reported similar effectiveness of telehealth applications in diagnosing and managing various health conditions. However, the sensitivity results should be interpreted with caution, as significant heterogeneity was observed across studies. Subgroup analyses indicate that this heterogeneity was primarily driven by the screening datasets, whereas diagnostic datasets showed more consistent performance. In addition, the pooled specificity of 0.76 implies a false-positive rate of approximately 24%. When applied at scale, this level of false positives could substantially increase demand for confirmatory specialist assessments, potentially offsetting some of the efficiency gains offered by telehealth. False positives may also cause unnecessary stress and anxiety for families referred for further evaluation but ultimately not diagnosed with autism. 55 The clinical implications of this trade-off depend on context: in screening, higher sensitivity is often prioritized to ensure that children at risk are not missed, even at the cost of more false positives. In contrast, diagnostic tools require higher specificity to avoid over-identification and reduce unnecessary referrals. Future research should therefore focus on improving specificity while balancing the need to maintain high sensitivity, tailoring this trade-off to the intended function of the tool.
The meta-analysis also revealed that diagnostic datasets outperformed screening datasets in both sensitivity and specificity. This is consistent with clinical expectations, as the diagnostic process requires a higher level of accuracy to identify true positives and true negatives. Accurate diagnoses are crucial for determining appropriate interventions and care plans for autistic children. 50 In contrast, screening tools, while essential, are typically designed to identify children with a high likelihood of autism who require further evaluation. Screening tools tend to be less refined, resulting in lower specificity and sensitivity compared to diagnostic tools. Moreover, the differences in performance between screening and diagnostic tools observed in this study may be attributed to their developmental nature. As demonstrated with technologies like TAP48,49 and BOSA20,67, screening tools, once validated, may undergo refinement of scoring algorithms and subsequent validation in different populations. Through these iterative improvements, such tools can evolve to function as diagnostic instruments, resulting in improved sensitivity and specificity. In addition, we investigated the effectiveness of video-assisted telehealth technologies by category. Machine-learning technologies, which analyze short home videos, demonstrated the highest sensitivity and specificity compared to video conferencing and video recording technologies. To test the robustness of these findings, sensitivity analyses were performed, which helped clarify the impact of extreme or lower-quality studies. In particular, the sensitivity analyses reinforced the robustness of the findings while highlighting important nuances. Including studies with perfect performance slightly improved pooled sensitivity and specificity but introduced significant heterogeneity and reduced the observed differences between categories, largely driven by video recording technologies. In contrast, excluding studies rated as high risk of bias on results had minimal impact, with only small shifts in pooled sensitivity and specificity and no changes in heterogeneity or subgroup patterns. These analyses suggest that while extreme or low-quality studies can influence variability and category-level patterns, the overall conclusions of the meta-analysis remain stable.
Among the categories, machine learning's ability to process large datasets and provide objective results makes it an appealing tool for both screening and diagnosis. Unlike traditional binary classification approaches, several studies reported that machine-learning models can also generate probability scores, which offer the potential to treat indeterminate outputs as a deliberate triage function.34,41 For example, uncertain cases could be flagged for further confirmatory assessment, thereby supporting efficient allocation of specialist resources. However, current rates of indeterminate classifications remain high in some studies (up to 68.2%), limiting immediate clinical utility. 46 Future research should focus on optimizing thresholds to reduce indeterminate rates while preserving balanced sensitivity and specificity, ensuring that probability-based outputs enhance rather than hinder clinical decision-making. It is also important to note that machine-learning algorithms rely heavily on the quality and representativeness of training data. The lack of diversity in current training datasets poses a challenge for the generalizability of machine-learning algorithms across different populations and cultural contexts. Future research should validate these algorithms across diverse demographic groups to ensure their accuracy and reliability. Additionally, concerns have been raised about the low interpretability of machine-learning algorithms. 56 Compared to human diagnosis, the lack of transparency in algorithmic decision-making may hinder communication between clinicians and families, requiring more effort from clinicians to explain the results.
Video conferencing technologies, which enable real-time interaction between clinicians and caregivers, offer the advantage of remote assessment and the ability to coach parents or caregivers through the process, reducing the need for in-person visits. Despite their promise, several limitations need consideration in further research. First, most video conferencing technologies were examined in clinical settings, with limited evidence regarding their use in the home. For example, the ADEC-V was examined in a clinical environment at a behavioral health center. 57 While on-site studies provide greater procedural control, they may overlook issues that arise in home-based settings, such as viewing angles or video/audio quality. Second, video conferencing studies typically involved small-sample sizes, with only 5 out of the 15 studies involving more than 100 participants. Additionally, the majority of these studies involved children referred for assessment due to developmental concerns, which introduces potential sample bias. It has been suggested that combining typically developing children with those exhibiting developmental delays and autism concerns can help improve the specificity of such assessment tools. 58 Thus, investigating video conferencing technologies in larger, more diagnostically diverse samples is crucial.
Video recording technologies, which provide asynchronous assessments, have the advantage of allowing parents to record interactions for later review by clinicians. However, these technologies showed the lowest sensitivity and specificity among the three categories, highlighting the need for further refinement. Furthermore, most studies in this category did not assess the acceptability of telehealth technologies from parents and clinicians. Given that this form of assessment is relatively new, it is essential to explore how caregivers and clinicians perceive its utility and effectiveness. Research evidence on telehealth assessments suggests that while caregivers generally provide a positive response to their experience with telehealth assessments, they may be less enthusiastic about fully replacing in-person assessments with telehealth. When distance is not a factor, caregivers often express a preference for on-site assessments, indicating potential hesitancy to embrace telehealth as a complete substitute. 59 Moreover, similar to video conferencing studies, video recording studies often included children referred for assessment due to developmental concerns, suggesting a potential sample bias. Additionally, as 11 out of the 16 studies in this category focused on screening, it is important to conduct longitudinal studies to assess the validity and effectiveness of these tools over time.
Finally, the technologies included in this review relied not only on experts but also on non-experts, such as parents and caregivers, as part of the assessment process. This criterion was predetermined to align with the development of scalable tools and to ensure their potential for broader implementation beyond specialist-led contexts. Non-expert-involved models offer several advantages, including the ability to capture naturalistic behaviors in familiar environments such as the home, reducing the demand on specialist time, and increasing accessibility for families in regions with limited clinical resources. At the same time, the development of such tools imposes high requirements. To be effective, they must be highly user-friendly, provide clear and simple instructions, and minimize the training burden for non-experts. Although challenging, the technologies reviewed demonstrate that these goals are achievable. Nonetheless, variability in administration, recording quality, and adherence to protocols may influence accuracy and likely contributed to the heterogeneity in sensitivity observed across studies. These considerations highlight the importance of designing telehealth tools that balance accessibility with reliability, ensuring that scalability does not come at the expense of diagnostic validity. Future research should therefore focus not only on accuracy metrics but also on usability, training supports, and strategies to optimize data quality when assessments are facilitated by non-experts.
Several limitations should be considered when interpreting the results of this systematic review. First, the initial search was not dual independently screened for all records. Instead, a second reviewer double-screened a randomly selected 50% sample. While subsequent update searches were fully dual screened, this approach deviates from the gold standard of 100% dual independent screening and may have introduced selection bias. Although inter-rater reliability was high (99.3% raw agreement; Cohen's kappa = 0.76), it is still possible that some eligible studies were missed during the portion screened by a single reviewer. Second, the search was restricted to English-language, peer-reviewed articles, which may have introduced language or publication bias by excluding relevant studies published in other languages. Third, studies varied in whether and how they reported indeterminate or inconclusive cases. In our meta-analysis, we followed the conventions of the primary studies and analyzed only definitive classifications, which may have inflated sensitivity and specificity estimates compared with real-world practice where indeterminate outcomes still require clinical resolution. This issue is particularly salient for machine-learning approaches, where reported indeterminate rates were sometimes very high. While flagging uncertain cases can be valuable as a triage function, excessively high rates limit the immediate clinical utility of such tools and underscore the need for optimizing thresholds to balance diagnostic accuracy with practical applicability.
Conclusion
This review underscores the growing potential of video-assisted telehealth technologies for the screening and diagnosis of autism, with machine-learning technologies emerging as the highest reported sensitivity and specificity in identifying autism-related behaviors, followed by video conferencing and video recording technologies. While these technologies hold promise for providing quick, convenient, and cost-effective methods of autism detection, a recurring limitation is that most studies relied on referral-based samples involving children already flagged for developmental concerns. Although such samples increase the likelihood of autism cases, they introduce bias and limit generalizability. A major gap in the field is the lack of validation in general, lower-risk community populations, where base rates of autism are lower and diagnostic distinctions more challenging. Without such validation, the applicability of these tools at a population level remains uncertain. In addition, most studies remain preliminary and are predominantly focused on the United States. To enhance applicability, future research should prioritize large-scale, community-based studies across diverse geographic regions and underrepresented populations with varied diagnostic profiles. It will also be critical to examine how these technologies can be integrated into routine clinical practice and validated in home and community settings. Finally, scalability must be addressed to ensure accessibility and effectiveness within broader healthcare systems.
Supplemental Material
sj-docx-1-dhj-10.1177_20552076251386705 - Supplemental material for A systematic review and meta-analysis of autism screening and diagnosis in children using video-assisted telehealth technology
Supplemental material, sj-docx-1-dhj-10.1177_20552076251386705 for A systematic review and meta-analysis of autism screening and diagnosis in children using video-assisted telehealth technology by Li Wang, Hanzhang Meng, Ziyan Meng, Yipeng Wang and Patrick C M Wong in DIGITAL HEALTH
Footnotes
Author contributions
PCMW and LW conceptualized the systematic review. LW and ZM developed the protocol. LW, ZM, and YW conducted the literature searches, and provided summaries of the previous research. LW and YW performed the meta-analysis. LW and HM wrote the first draft of the manuscript, and all authors contributed to and have approved the final manuscript.
Funding
The authors disclosed receipt of the following financial support for the research, authorship, and/or publication of this article: Funding for this study was provided by Shenzhen Natural Science Foundation (grant JCYJ20220531103803009), China Postdoctoral Science Foundation (grant 2022M722221), and Research Grants Council of Hong Kong (grant C4024-21G). The funding sponsors had no role in the study design, collection, analysis or interpretation of the data, writing the manuscript, or the decision to submit the paper for publication.
Declaration of conflicting interests
The authors declared no potential conflicts of interest with respect to the research, authorship, and/or publication of this article.
Availability of data and materials
The data that support this article will be made available from the corresponding author on reasonable request.
Supplemental material
Supplemental material for this article is available online.
References
Supplementary Material
Please find the following supplemental material available below.
For Open Access articles published under a Creative Commons License, all supplemental material carries the same license as the article it is associated with.
For non-Open Access articles published, all supplemental material carries a non-exclusive license, and permission requests for re-use of supplemental material or any part of supplemental material shall be sent directly to the copyright owner as specified in the copyright notice associated with the article.