
Abstract
Objective
To address the limitations of traditional approaches in diagnosing eye diseases, we propose five state-of-the-art, transfer-learning-based deep convolutional neural network (DCNN) models and an ensemble model. These models are trained on thousands of retinal images to achieve robust classification of diseases such as glaucoma, cataracts, and diabetic retinopathy.
Methods
Our dataset consists of 3744 raw retinal images. We implemented and fine-tuned five individual DCNN models: VGG16, ResNet152, DenseNet169, EfficientNetB3, and NASNetMobile. We also developed an ensemble model that combines ResNet152, DenseNet169, and EfficientNetB3. Additionally, a single-shot multibox detector (SSD) was used for the detection of central and branch retinal vein occlusions (CRVO and BRVO).
Results
Among the individual models, DenseNet169 demonstrated superior performance, with 96% accuracy and 22% loss. The NASNetMobile model achieves the lowest accuracy at 87%. The proposed ensemble model outperforms all the individual networks, reaching a peak accuracy of 97%. These results highlight the effectiveness of transfer learning in improving classification accuracy.
Conclusion
The proposed AI-driven approaches provide a reliable solution for the early and precise detection of common eye diseases. By leveraging advanced deep learning techniques, our work contributes to the medical field by assisting healthcare professionals in diagnosis and paving the way for improved diagnostic tools and enhanced patient care.
Keywords
Introduction
Currently, the world is experiencing a growing number of diseases, both in humans and in animals. This makes human existence a threat to the world. A few years ago, the world witnessed a global pandemic caused by coronavirus. The COVID-19 pandemic caused the death of more than 7 million people across the globe as of mid-2024, according to the World Health Organization (WHO), and the pandemic is still ongoing. Since then, researchers have been researching ongoing and future diseases, discovering remedies, and being prepared before their occurrence. The world is currently warning of many eye diseases. Millions of people worldwide are blind, and the number is increasing rapidly. According to the WHO, approximately 2.2 billion people in the world are facing blindness or vision loss, and more importantly, approximately 1 billion people have impaired vision (https://www.who.int/en/news-room/fact-sheets/detail/blindnessand-visual-impairment). Research has shown that understanding retinal images is crucial for ophthalmologists to assess eye diseases such as glaucoma to prevent blindness, and this assessment can help doctors make early diagnoses. 1
Eye disease is caused by many factors, such as aging, genetics, diabetes, infections, and exposure to UV light. Approximately 1.1 billion people worldwide face vision problems, which are expected to increase to 1.8 billion by 2050. The common causes of this problem are cataracts, glaucoma, diabetic retinopathy, and age-related issues that eventually lead to blindness, where almost 76 million people have glaucoma. 2 Although individuals over 65 years of age face a risk that is ten times greater than that of younger individuals, the current study shows that younger generations are experiencing a high rate of eye issues, such as myopia, because of their lifestyle, mostly.2,3 Therefore, early detection of this disease can save patients from blindness. People are losing sight of their invaluable eyes because of negligence and unpreparedness. Several studies have been performed to detect diseases worldwide via techniques such as deep neural networks, CenterNet models, feature fusion, selection-based methods from OCT images, parallel algorithms, and so on.4–7 Besides, deep learning architecture also employs on the eyes and other types of cancers such as breast cancer classification and epileptic seizure detection.8–10
Retinal eye image classification is a computer vision problem. Ismail et al. 11 used deep learning to detect ocular disease via data fusion in fundus images. Multimodal medical eye imaging and deep learning are also used for diagnosing eye diseases. 12 Author et al. 13 presented a systematic review on eye disease detection via deep learning, representing considerable research on eye disease and the collaboration gap between deep learning researchers and health professionals. However, research on eye disease detection has several limitations in the context of early detection and classification. They use some old architectures with limited capabilities. Therefore, to mitigate the gaps in previous research, we propose novel, robust models to classify eye detection in the early days via transfer learning techniques.
In the proposed models, we collect the secondary dataset from the data repository (https://www.kaggle.com/datasets/gunavenkatdoddi/eye-diseasesclassification). Using this dataset, we modify the transfer learning techniques to design our model architecture to detect the four stages—normal, glaucoma, cataract, and diabetic retinopathy—of the eye to detect the disease. To address the research gap in the previous research on traditional machine learning algorithms and a relatively small set of datasets, we implement VGG16, DenseNet169, EfficientNetB3, NASNetMobile, and ResNet152 pretrained models with numerous training images from our datasets. After implementing the model with the dataset, the model achieved notable performance, and finally, we detected central retinal vein occlusion (CRVO) and branch retinal vein occlusion (BRVO). The contributions of the proposed models are stated below.
We successfully curated a large dataset of retinal images from publicly available resources and extracted features. Five transfer learning algorithms are implemented to detect the four kinds of eye diseases, and ensemble methods are also introduced. The models generate the best performance for detecting eye diseases. They employ single-shot multibox detector (SSD) techniques to detect the CRVO and BRVO from diseased eye images.
The rest of the article is designed as a literature review given in section “Related works,” and the proposed methodology is discussed in section “Methodology,” where details about the dataset are given in subsection “Study design,” transfer learning (TL) models are presented in subsection “Dataset,” and the experimental setup is given in section “Transfer learning techniques design.” The proposed models VGG16, ResNet152, NASNetMobile, EfficientNetB3, DenseNet169, and the ensemble models are introduced in subsections “VGG16,” “ResNet152,” “NASNetMobile,” “EfficientNetB3,” “DenseNet169,” and “Ensemble,” respectively. We analyze the results and discuss the model's performance in section “Results and discussion.” Finally, we conclude in section “Conclusion.”
Related works
Many studies have been performed on eye disease using deep learning, data-driven techniques, and so on. Malik et al. 14 used machine learning to classify eye disease. He used tree-based methods with sufficient data and achieved a satisfactory 90% prediction rate when comparing neural networks and the naive Bayes algorithm. Different approaches have been used by authors for the localization and classification of diabetes-related eye disease, 15 achieving an accuracy of 90.1% for exudate pathology identification and optic disk localization and 90.7% accuracy. Similar research has been performed by Sarki et al. 16 using a CNN. Their model, trained on retinal fundus images collected from various publicly available datasets, achieved 81.33% accuracy and 100% sensitivity and specificity.
Acharya et al. 17 implemented an artificial neural network, fuzzy classifier, and neuro-fuzzy classifier with a database of 135 subjects with four classes of eye images and compared them. His models show 85% greater sensitivity with 100% greater specificity. In contrast, Bernabe et al. 18 presented an intelligent pattern classification algorithm validated through F-fold cross-validation and attained an accuracy of 99.89% with images of glaucoma and diabetic retinopathy. In addition, the model also achieves a score close to 1 in accuracy, recall, specificity, precision, and the F1 score.
CNN and SVM were used by the Pahuja et al. 19 to detect cataracts with a dataset of normal images and cataract images. The models generate accuracies of 87.5% and 91.3% for the F1 score for the SVM, 87.08% for the training accuracy, and 85.42% for the validation accuracy for the CNN model. Sait et al. 20 developed an eye disease model via deep learning techniques such as single-shot detection, the whale optimization algorithm, and the ShuffleNet V2 model via fundus images and achieved accuracies and kappa values of 99.1, 96.4, 99.4, and 96.5, respectively, in the ODIR and EDC datasets.
Ahmad and Hameed 21 used hierarchical multilabel classification to classify external eye disease and achieved 75.7142% accuracy. The dataset utilized in this article is categorized into four main classes with seven subclasses, which consist of images taken by a digital camera. Guo et al. 22 presented a lightweight deep transfer learning architecture named MobileNetV2 to predict four eye diseases: glaucoma, maculopathy, pathological myopia, and retinitis pigmentosa. The model achieved 97.6% specificity, 90.4% sensitivity, and 96.2% accuracy with a small amount of training data.
Jain et al. 23 detected retinal eye diseases with a simple deep CNN architecture called LCDNet without explicitly performing feature extraction or segmenting. The retinal fundus dataset was collected from two secondary sources. The accuracy of the developed model is between 96.5% and 99.7%. Some traditional machine learning algorithms, such as logistic regression, support vector machine, random forest, and gradient boosting, were used to detect the three types of eye disease by Ramanathan et al. 24 The article shows that gradient boosting generates the best result, with an accuracy of 90%, whereas logistic regression and random forest achieve 89% and 86%, respectively, when each is exceptionally trained with eye fundus images. In addition, a multilabel deep learning framework was introduced by Fundus-DeepNet, 25 which focused primarily on classification and did not address spatial localization or segmentation. Moreover, their method did not explore ensemble models and lacked comparative performance analysis among different CNN architectures. An automated algorithm for retinal blood vessel extraction was proposed by researchers. 26 It primarily addresses vessel segmentation and does not extend to disease classification or the detection of complex conditions. A study in Ref. 27 presented a fast and fully automated segmentation pipeline for retinal blood vessels. The system was designed specifically for vessel detection and did not incorporate deep learning-based classification or ensemble methods to leverage the different powers of pretrained networks on large datasets.
Despite the advancement of research in this area, these previous studies have gaps, such as limited focus on ensemble learning to improve diagnostic accuracy across diverse retinal diseases; lack of integration between classification and object detection frameworks to simultaneously identify and localize conditions such as CRVO and BRVO; and insufficient use of transfer learning from large-scale models such as ResNet, DenseNet, and EfficientNet in a unified evaluation framework. In addition, most studies face challenges due to limitations, such as training in low-device setups, simple architectural methods with traditional algorithms, and small datasets. To address these limitations, our study proposes novel ensemble-based deep learning models with state-of-the-art transfer learning techniques consisting of an advanced pretrained model and a relatively less employed ensemble model to detect the disease more accurately and integrates a single-shot multibox detector (SSD) for the spatial detection of retinal occlusions. We trained our model with a large dataset of many eye disease images. Our model performs well in detecting the four types of eye disease more accurately, outperforming most of the existing developed models. We broadly explored comparative performance across multiple deep architectures.
Methodology
The proposed methodology is based on transfer learning techniques trained on vast amounts of image data of eye diseases. The entire proposed eye disease system consists of three phases, and the beginning phase is the collection of image data for both training and testing the model. We have developed five significant transfer learning models to detect the disease, and in the final phase, the models produce the generated output, indicating whether the image contains eye disease in three categories or is expected. The complete function is depicted in Figure 1, and the methodology is discussed below in detail.

Functions of the classification of four eye diseases.
In Figure 1, the developed TL models detect eye diseases from images with three labels. The chosen eye diseases for this research were glaucoma, cataracts, and diabetic retinopathy. Each model classifies an image as one of these diseases or as normal. The given images in Figure 1 are sample images taken from the dataset to demonstrate the system.
Figure 2 presents the proposed methodology for detecting eye disease. We collected the dataset from secondary sources and split the dataset into training sets and tests. The training set is preprocessed to feed into the TL models for training. After model training, we evaluated the performance of the models via various techniques, such as accuracy, heatmaps, and segmentation. The model is tested with the test data, which provides good performance and generates the report.

The proposed methodology.
Study design
This study is a retrospective analysis utilizing a publicly available, anonymized dataset of retinal images obtained from the Kaggle repository. As a result, direct patient interaction was not needed, and the dataset lacked personally identifiable information. The computational experiments, model development, and data analysis for this research were conducted at the International University of Business Agriculture and Technology, Dhaka, Bangladesh, over a period from January 2024 to June 2024.
Dataset
The dataset used in this research is a secondary dataset collected from the open-access, publicly available Kaggle. It contains anonymized images of eye diseases and does not include any personally identifiable information. As such, no ethical approval was necessary for its use in this research. This dataset consists of four classes of image datasets of eye diseases. The labels used were normal, glaucoma, cataract, and diabetic_retinopathy, and a total of 977 images were collected for the diabetic_retinopathy label, 953 images for the normal label, 928 images for cataract, and 886 images for glaucoma in the training set. The test set consists of 121 images labeled normal, glaucoma, and diabetic retinopathy; the cataract label has 110 images. A sample of the dataset is presented in Figure 3(a).
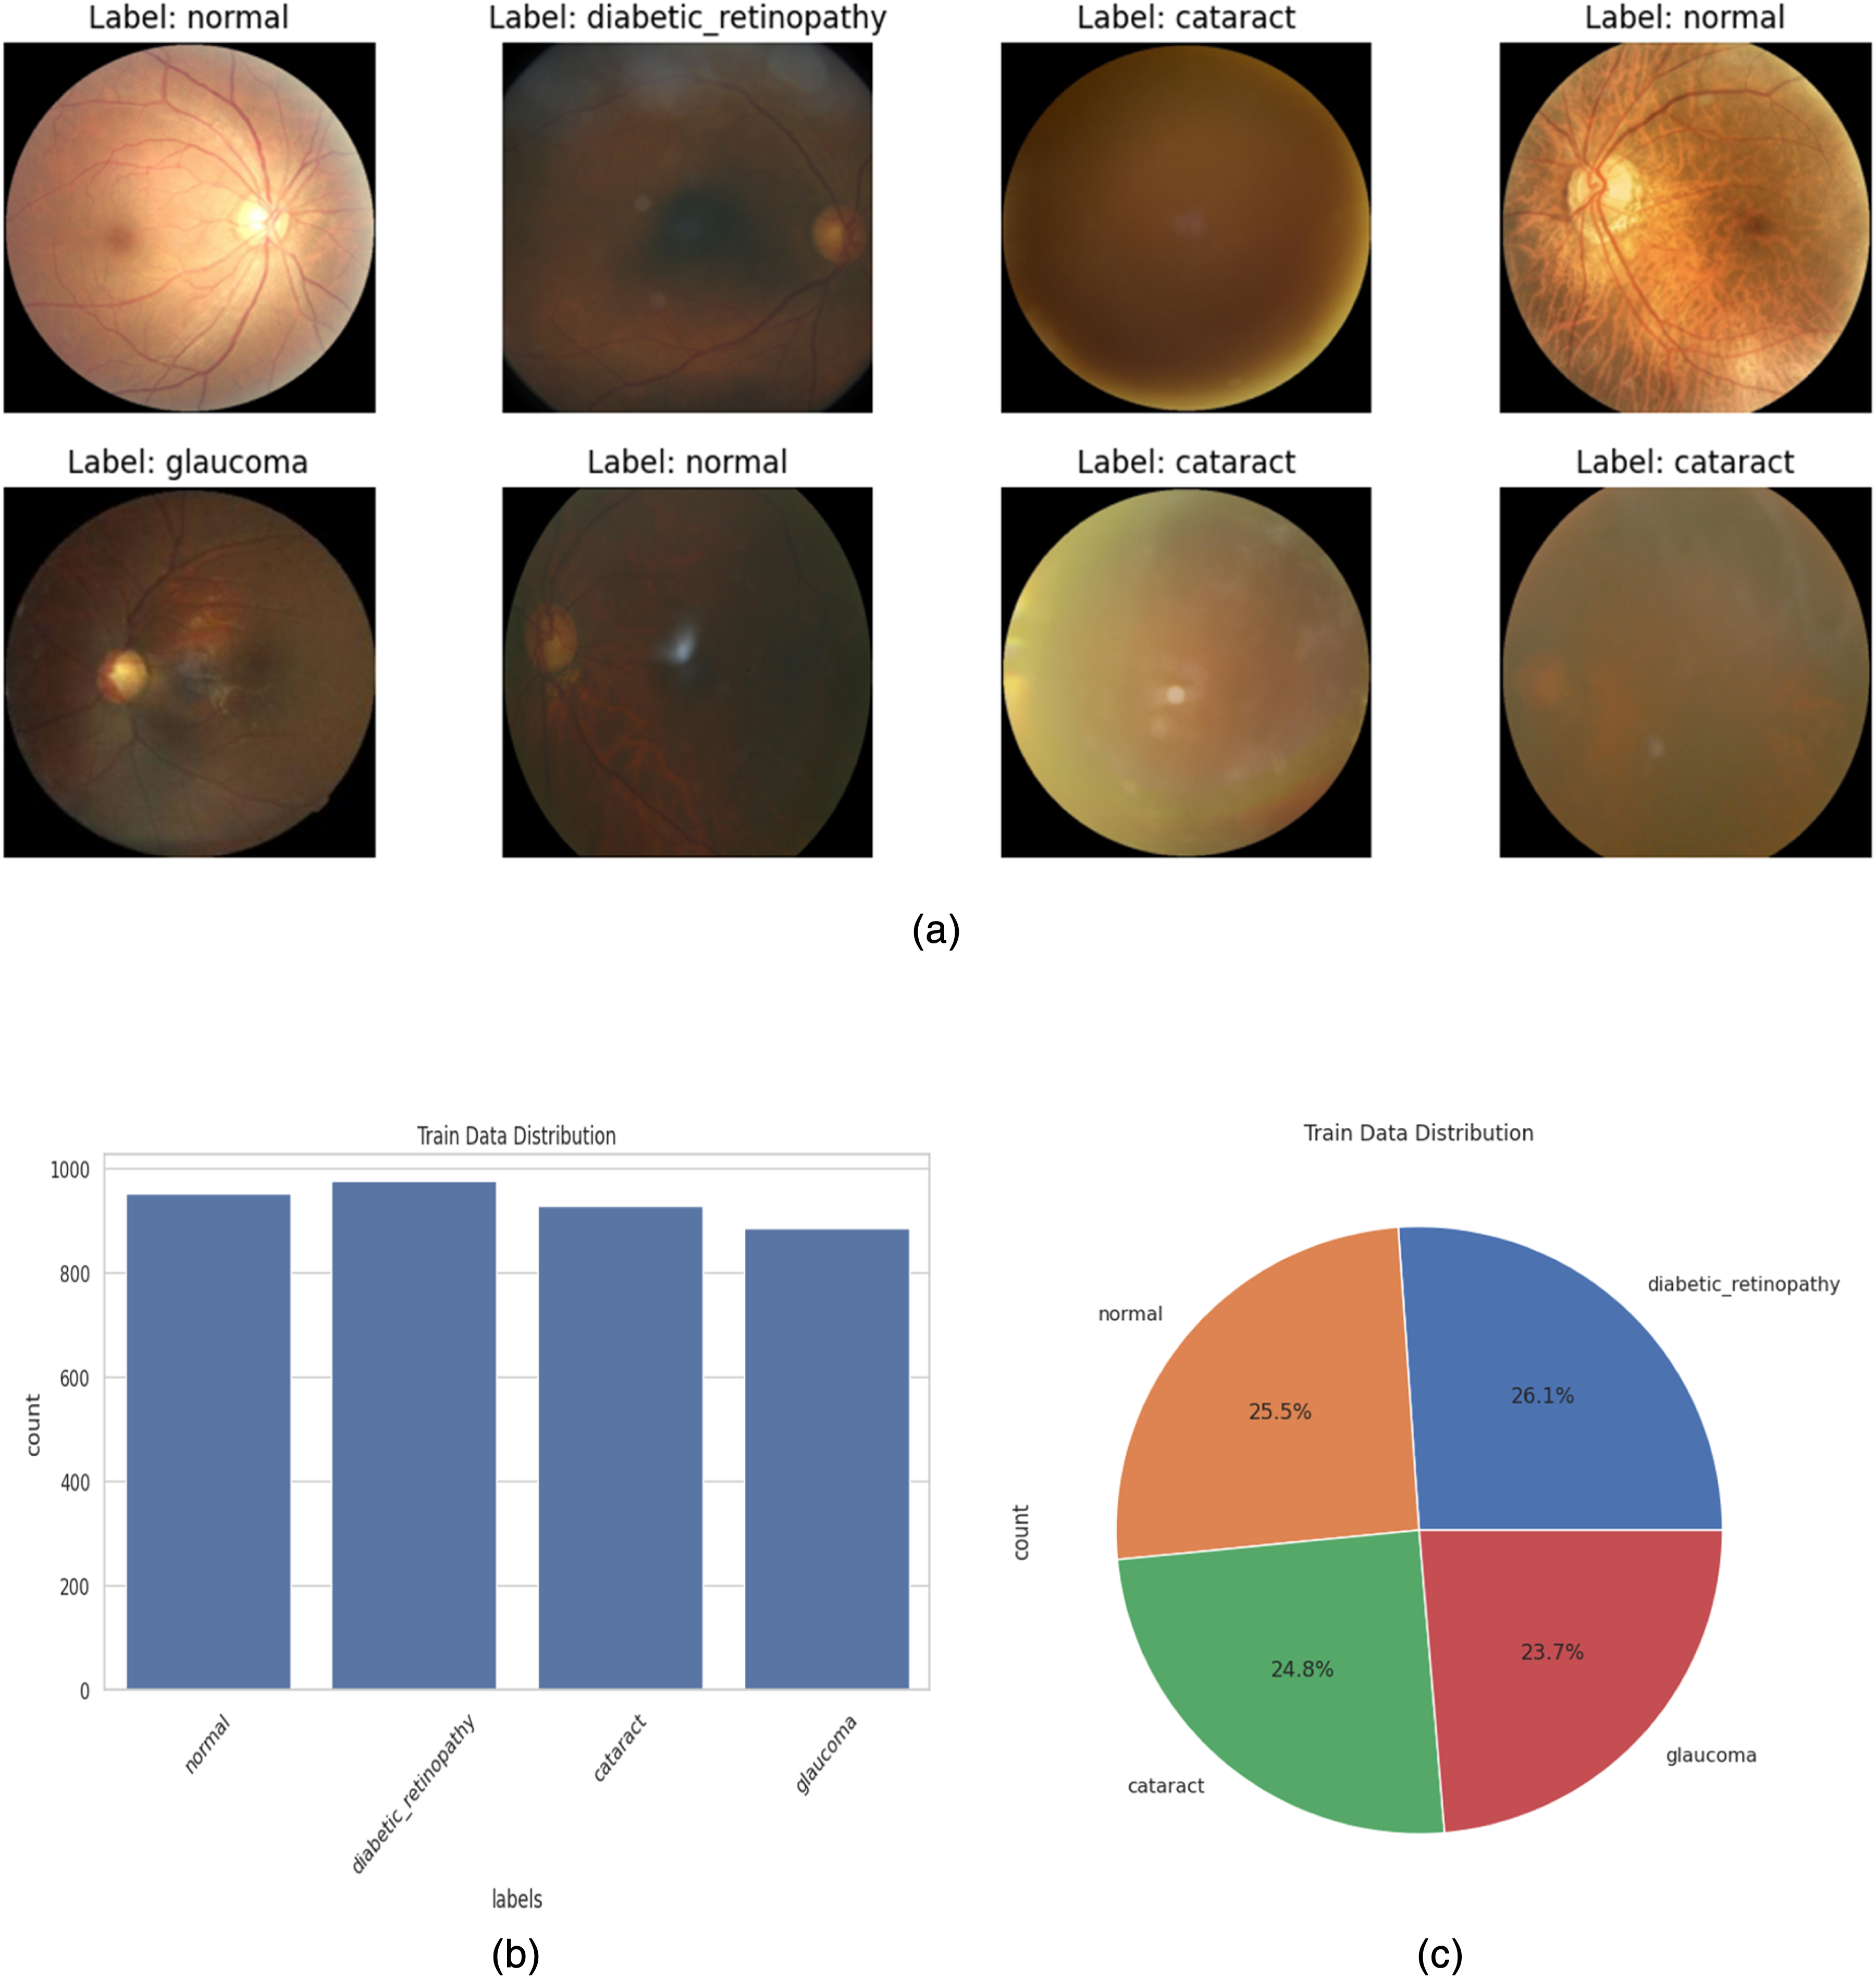
(a) Sample images of the dataset. (b) Train Data Images Numbers in Label. (c) Pie gram of images of labels in percentage.
Figure 3(b) shows the number of images on each label, where it is clear that the maximum number of images are on the diabetic_retinopathy label, although there is not much difference in the other three labels of images. We have demonstrated the percentage of images in the label in Figure 3(c).
Data augmentation and preprocessing
Data are a significant element for artificial intelligence models, especially deep learning. As deep learning models perform better on large datasets, we augment our dataset to mitigate the overfitting problem of our proposed models. We have implemented several data augmentation techniques, such as rotation, contrast adjustment, and flipping (horizontal flip), to enhance our employed data. Before the image data are used to implement the models, the image data are preprocessed via normalization techniques and fed into the models later. It plays an important role in the model's performance.
Transfer learning techniques design
Transfer learning is an advanced deep learning technique trained on vast amounts of data for a particular task. The models can be reused for other functions via fine-tuning, feature extraction, multitask learning, and so on. These pretrained models are frequently used for specific tasks. We employed feature extraction techniques along with fine-tuning in this methodology, using five pretrained models as fixed feature extractors. We exclude the final layer of the model and provide the intermediate layer output to our required classifier. In Figure 4(a), we present the proposed architecture for transfer learning. The pretrained CNN models employed in this system are briefly discussed in this subsection.
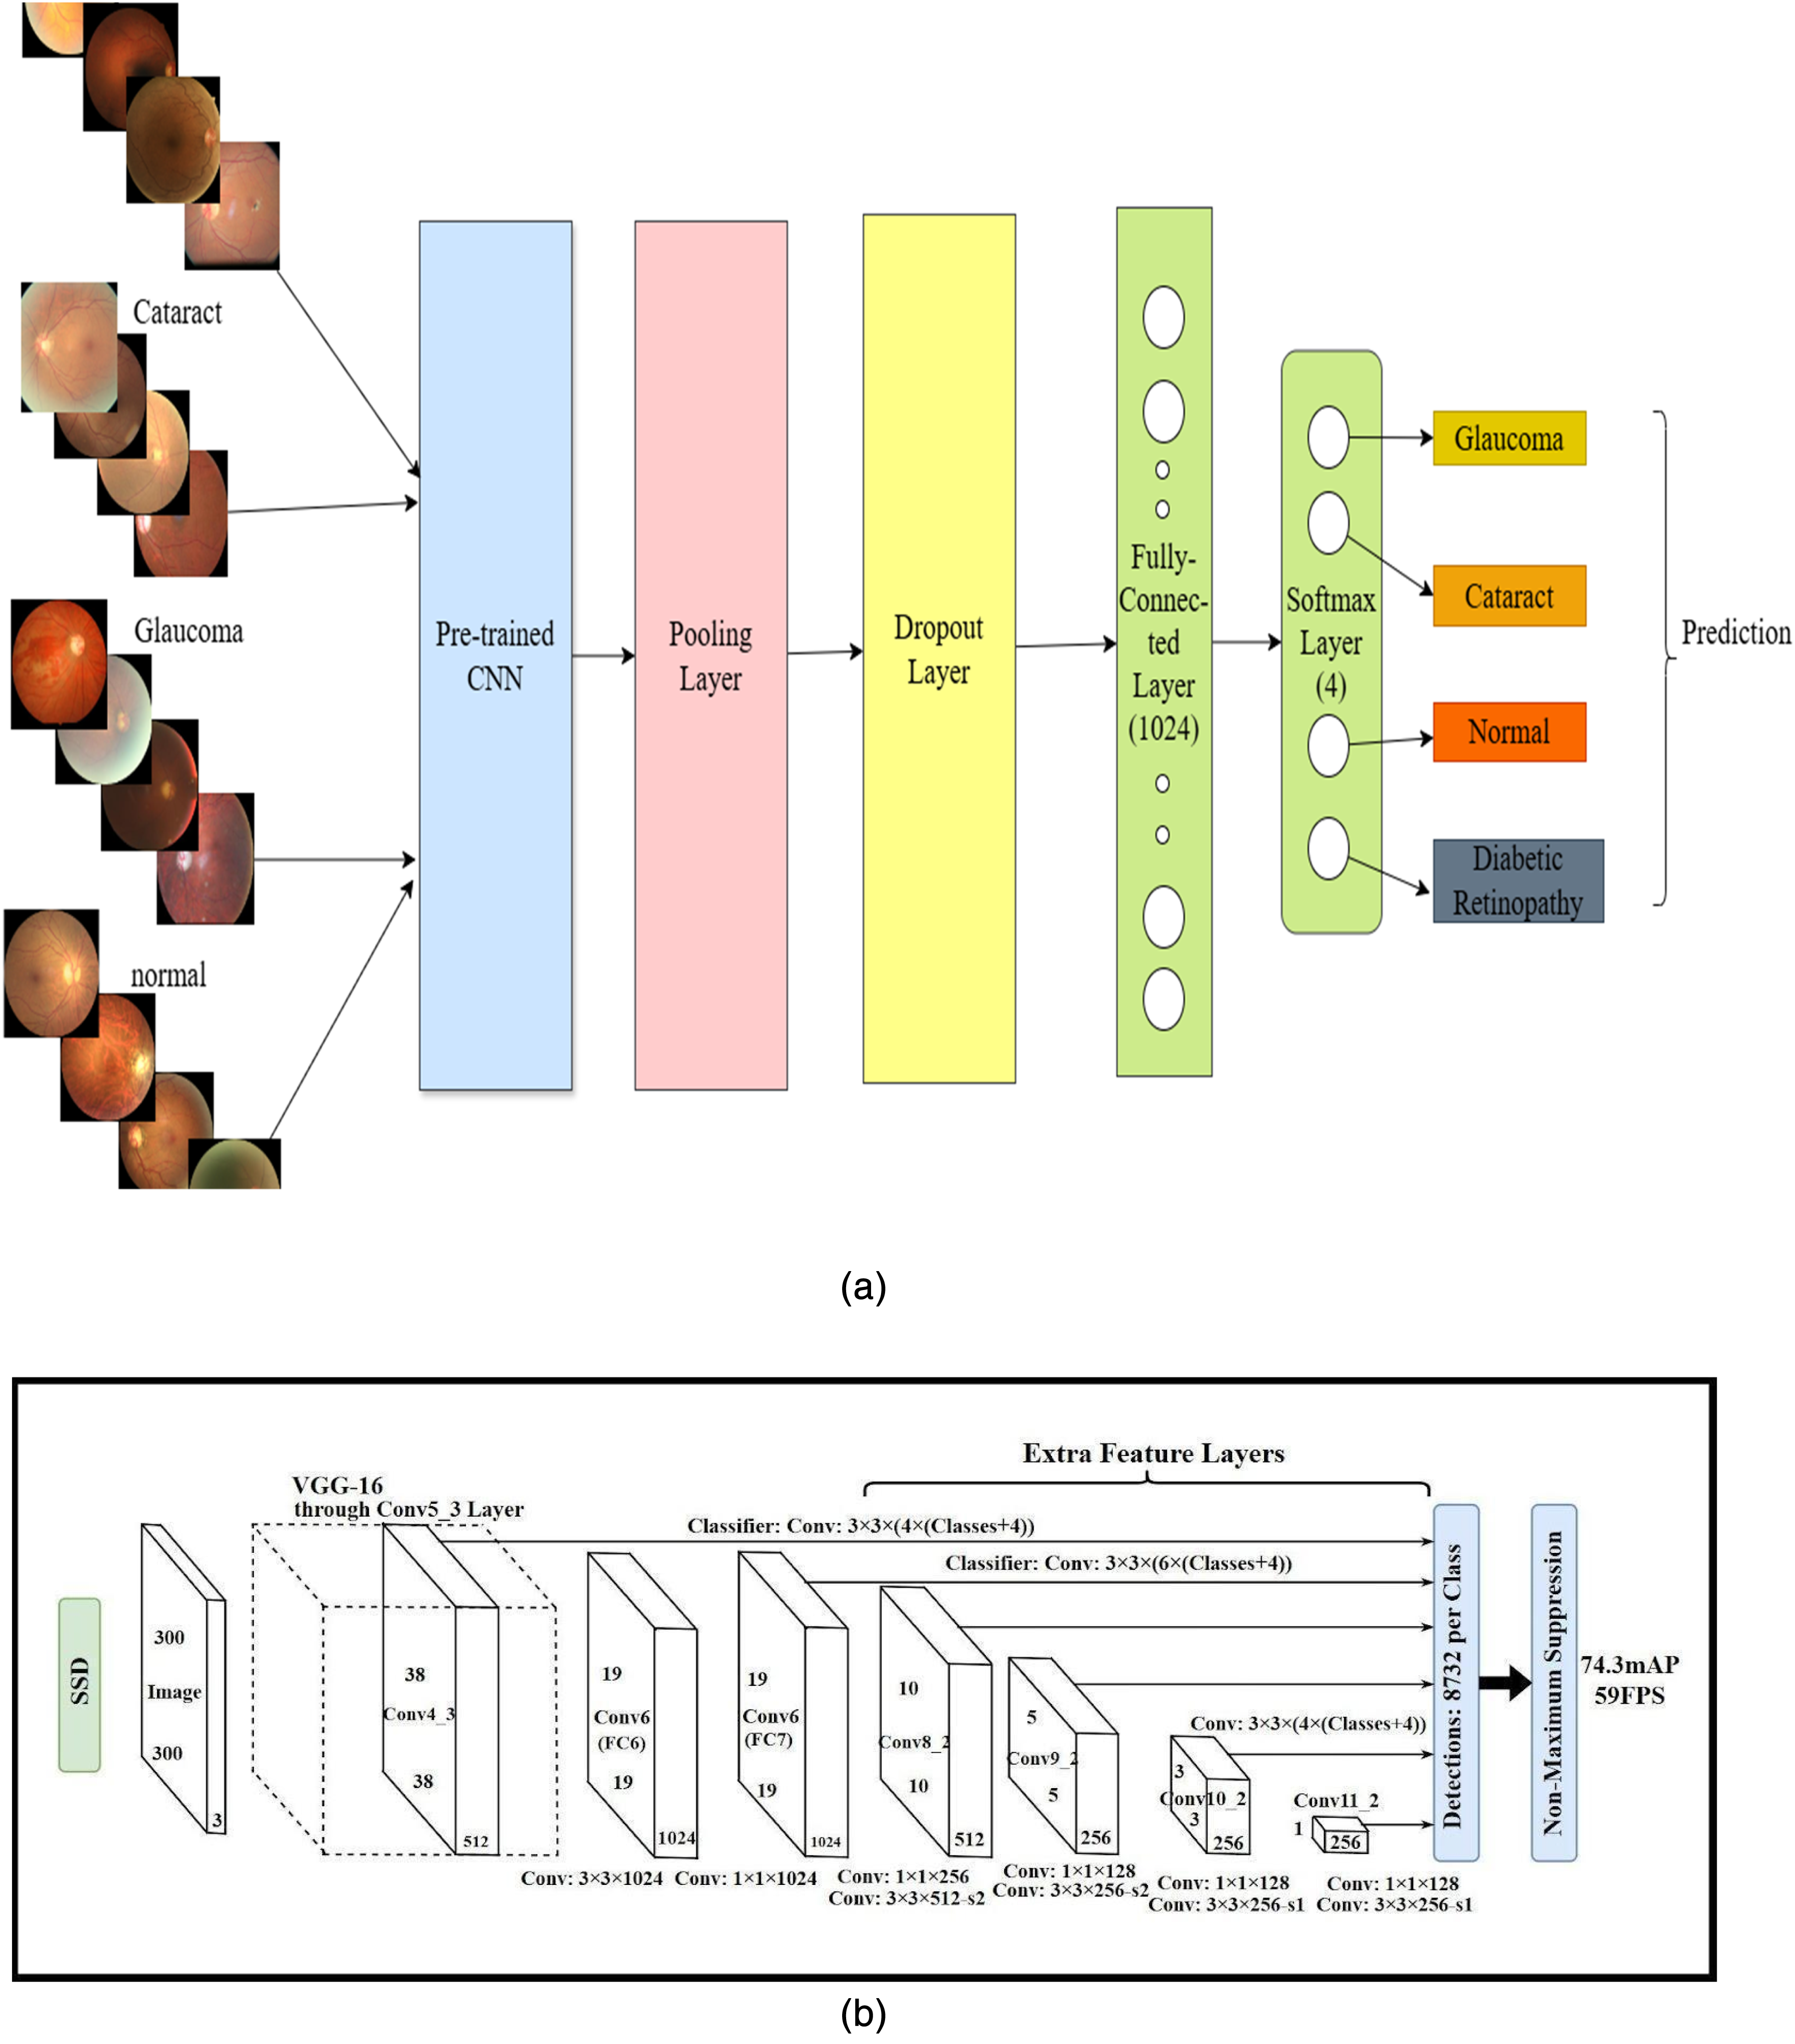
(a) Common proposed transfer learning architecture. (b) Original SSD - single-shot detection architecture.
The mathematical formulation of our modified transfer learning model is a three-step process. In the first step, we load the transfer learning model with pretrained weights, where we replace the original final fully connected layer with our required four output classes. In the final step, we fine-tune the model with all the transfer learning model layers and the new modified layer. Let x be an input;


The cross-entropy loss is used for the modified models for fine-tuning, where y is the one-hot encoded ground truth label and where

VGG16
The visual geometry group, known as VGG, designs a CNN architecture for image recognition, which performs best for the ImageNet dataset. The original VGG16 consists of 13 convolutional layers, three fully connected layers, and 16 layers in total. In our modified VGG16 model, to classify the four labels of eye disease, we adjusted the final layer of the fully connected layer of 1000 neurons with a new fully connected layer consisting of 4 layers.
ResNet152
ResNet152 is another deep convolutional neural network (DCNN) architecture developed by Microsoft Research that is famous for its residual learning framework. ResNet152 refers to the 152 layers, and the depth of the network makes it one of the deepest ResNet architectures. It is also well known for its solution to the vanishing gradient problem. The general input layer is 224 × 224 × 3 for a typical image size, with an initial convolutional layer of 7 × 7 filters and 64 channels. The fully connected layers consist of a dense layer with 1000 nodes, with a Softmax activation function for classification.
NASNetMobile
A mobile-friendly variant of NASNet that is lightweight and efficient for mobile tasks, retaining good accuracy for specific tasks. NASNet consists of regular and reduction cells, where normal cells are used for feature extraction and reduction cells for downsampling features. This pretrained model is famous for mobile usage and embedded applications that require image classification. It can also be fine-tuned when labeled data are limited for image recognition.
EfficientNetB3
A DCNN architecture employs a novel scaling method to balance features such as width, depth, and resolution to increase model performance and efficiency. This model is a medium-sized model. The input resolution is 300 × 300 × 3 for the input layer, and the model has several MBConv blocks with scaling factors for the number of layers, number of filters, and resolution. The final fully connected layer is dense with 1000 nodes for classification.
DenseNet169
Number 169 in DenseNet refers to the number of layers in the DenseNet model, a DCNN model designed to enhance feature propagation and reduce the number of parameters employing dense connections. It is suitable for feature reuse and tasks for feature extraction with fewer parameters. This architecture consists of 7 × 7 convolutions with strides of 2 and 4 dense blocks with 6, 12, and 32 layers, respectively, by a transition layer, and the final fully connected layers are modified to 4 for our targeted classes.
Ensemble
An ensemble with multiple transfer learning refers to a system where several pretrained models are aggregated to perform a specific task. Each transfer learning model trained initially on a large dataset contributes learned knowledge, and predictions are combined to improve overall accuracy and robustness compared with the use of a single model. Multiple architectures employed in this research, such as VGG16, ResNet, DenseNet, EfficientNet, and NASNetMobile, are used to build the ensemble model. For our target task, we modified each model to produce our targeted 4-labeled outputs. To improve the accuracy, we combined each model's output. Averaging and majority voting are the most common methods used to combine predictions or outputs and train the modified output layers, or if needed, the entire model can be fine-tuned. In our proposed models, we employed the Regular Averaging Ensemble. In a Regular Average Ensemble, the final prediction is obtained by taking the simple (unweighted) average of the outputs of multiple models. The mathematical explanation of this model is presented in equations (5) and (6).


The final class prediction is obtained by selecting the class with the highest average probability for classification tasks, and the averaged output is used directly for regression tasks. This method treats all the models equally and helps improve performance by reducing individual model errors.
SSD
SSD is a standard algorithm for identifying hemorrhages or edema or localizing lesions in retinal and fundus images, as it is an object detection algorithm. We used SSD to detect retinal hemorrhages or vein blockages, known as CRVO and BRVO, in the retinal images of our model dataset. CRVO refers to central retinal vein events where retinal hemorrhages are widespread, and if a branch of the retinal vein is blocked, it is known as BRVO. We have used SSD despite YOLO, Faster R-CNN or RetinaNet for its simpler architecture and efficient performance on smaller datasets. Compared with the other algorithms, SSD offers significantly faster inference, which is crucial for real-time or near-real-time clinical applications.
Liu et al. 28 explained the architecture of the SSD model, which is presented in Figure 4(b) and adds several feature layers with a base network at the end. Some layers of the SSD are the backbone network, additional feature layers, multiscale feature layer, anchor boxes, and prediction layers after the image, such that our model retinal images are given as input. Nonmaximum suppression in the final method removes the overlapping predictions.
We have used SSD despite YOLO, Faster R-CNN or RetinaNet for its simpler architecture and efficient performance on smaller datasets. While models such as YOLO (you only look once) are renowned for their high accuracy, our choice of SSD was guided by its balance of speed and performance, particularly with respect to the hardware available for this study. SSD architecture often results in faster inference times, a critical factor for potential deployment in real-time or near-real-time clinical settings with limited computational resources. We prioritized this efficiency, and SSD provided robust performance for our specific task of localizing CRVO and BRVO within our dataset.
Experimental setup
The model is trained on a machine consisting of a CPU-installed AMD Ryzen 7 3700X 8-Core Processor 3.60 GHz, 8 GB of RAM, and an NVIDIA GeForce GT 710 GPU with 2 GB of VRAM. Python is used in the Keras and TensorFlow v2.10 libraries. The model is trained for 30 epochs. The data split of the training set and test set is 80:20, and the random state is set to “123” for reproducibility. The batch size is 40, and the Adamax optimizer is used for optimization, with a learning rate of 0.001. The primary assessment involves the accuracy, precision, and confusion matrix. The image size and training and validation sets are 224 × 224 pixels in RGB color mode. For the pretrained models, we set include_top as “False,” the input shape as (224, 224, 3), and pooling as “Max.” The dropout layer rate is 0.3, and the final dense layer is set to 4 units for 4 classes with Softmax activation.
The total training dataset comprised 3744 images, which were resized to 224 × 224 pixels during the data loading process. Given the hardware specifications, the training time for 30 epochs varied for each model. The average training time was approximately 4 to 6 hours per model. Deeper models such as ResNet152 were on the higher end of this range, whereas the lighter NASNetMobile model was on the lower end.
To ensure the reproducibility of our results in light of the computational constraints preventing multiple experimental runs, the random state for data splitting and all stochastic model components was fixed to “123.”
Results and discussion
Results
The proposed models were trained on our model with the dataset, and the performance of the model was notable in both the training and evaluation periods. We evaluated and tested our model with external images, not from the original dataset, and validated it as well, although we did not test our model on an external dataset from public sources. In total, we implemented five models. The VGG16 shows the best accuracy, considering training and test accuracy. During training, the training accuracy shows a constant increase with the number of epochs, although there is some fluctuation in the validation accuracy. In the same manner, the loss of the model decreases. These results demonstrate the robustness and effectiveness of VGG16 for the eye disease classification task shown in Figure 5(a).

(a) Training and validation accuracy of VGG16. (b) Training and validation accuracy of ResNet152. (c) Training and validation accuracy of EfficientNetB3. (d): Training and validation accuracy using DenseNet169. (e) Training and validation accuracy of NASNetMobile.
On the other hand, the ResNet152 model provides straightforward progress in accuracy after epoch 5, with few fluctuations in validation accuracy, as shown in Figure 5(b). However, the loss was constant from epoch 5. EfficientNetB3 was performed constantly after epoch 5 for both training and test accuracy, although there was some accuracy difference between them, which is presented in Figure 5(c). DenseNet169 performs exceptionally well, as presented in Figure 5(d), similar to the EfficientNetB3 model for training accuracy, although the validation accuracy graph shows some fluctuations.
The ResNet152 model steadily progresses in accuracy, although its validation loss exhibits some fluctuations, particularly in the initial epochs. This instability is likely due to the composition of the validation mini-batches; given the smaller size of the validation set compared with the training set, the presence of particularly challenging or atypical samples in a single batch can cause temporary spikes in the loss metric. Nevertheless, the overall downward trend of the loss and the consistent upward trend of the accuracy indicate that the model learns effectively over the epochs. The subsequent smoothness of the loss curve from epoch 5 demonstrates the stabilization of the training process by the optimizer after the initial adaptation phase.
NASNetMobile, one of the prominent transfer learning techniques, performed quite well in eye disease detection with our data, as shown in Figure 5(e). The model demonstrated good accuracy, and it was constant at epoch 5. However, the validation accuracy fluctuated and increased gradually. The loss constantly decreases with increasing number of epochs. This behavior suggests that the model learns meaningful features over time but shows instability due to batch variations or dataset complexity. The model generally performs better, resulting in an increasing trend in accuracy over time.


Summary of the accuracy and loss of models with testing results.

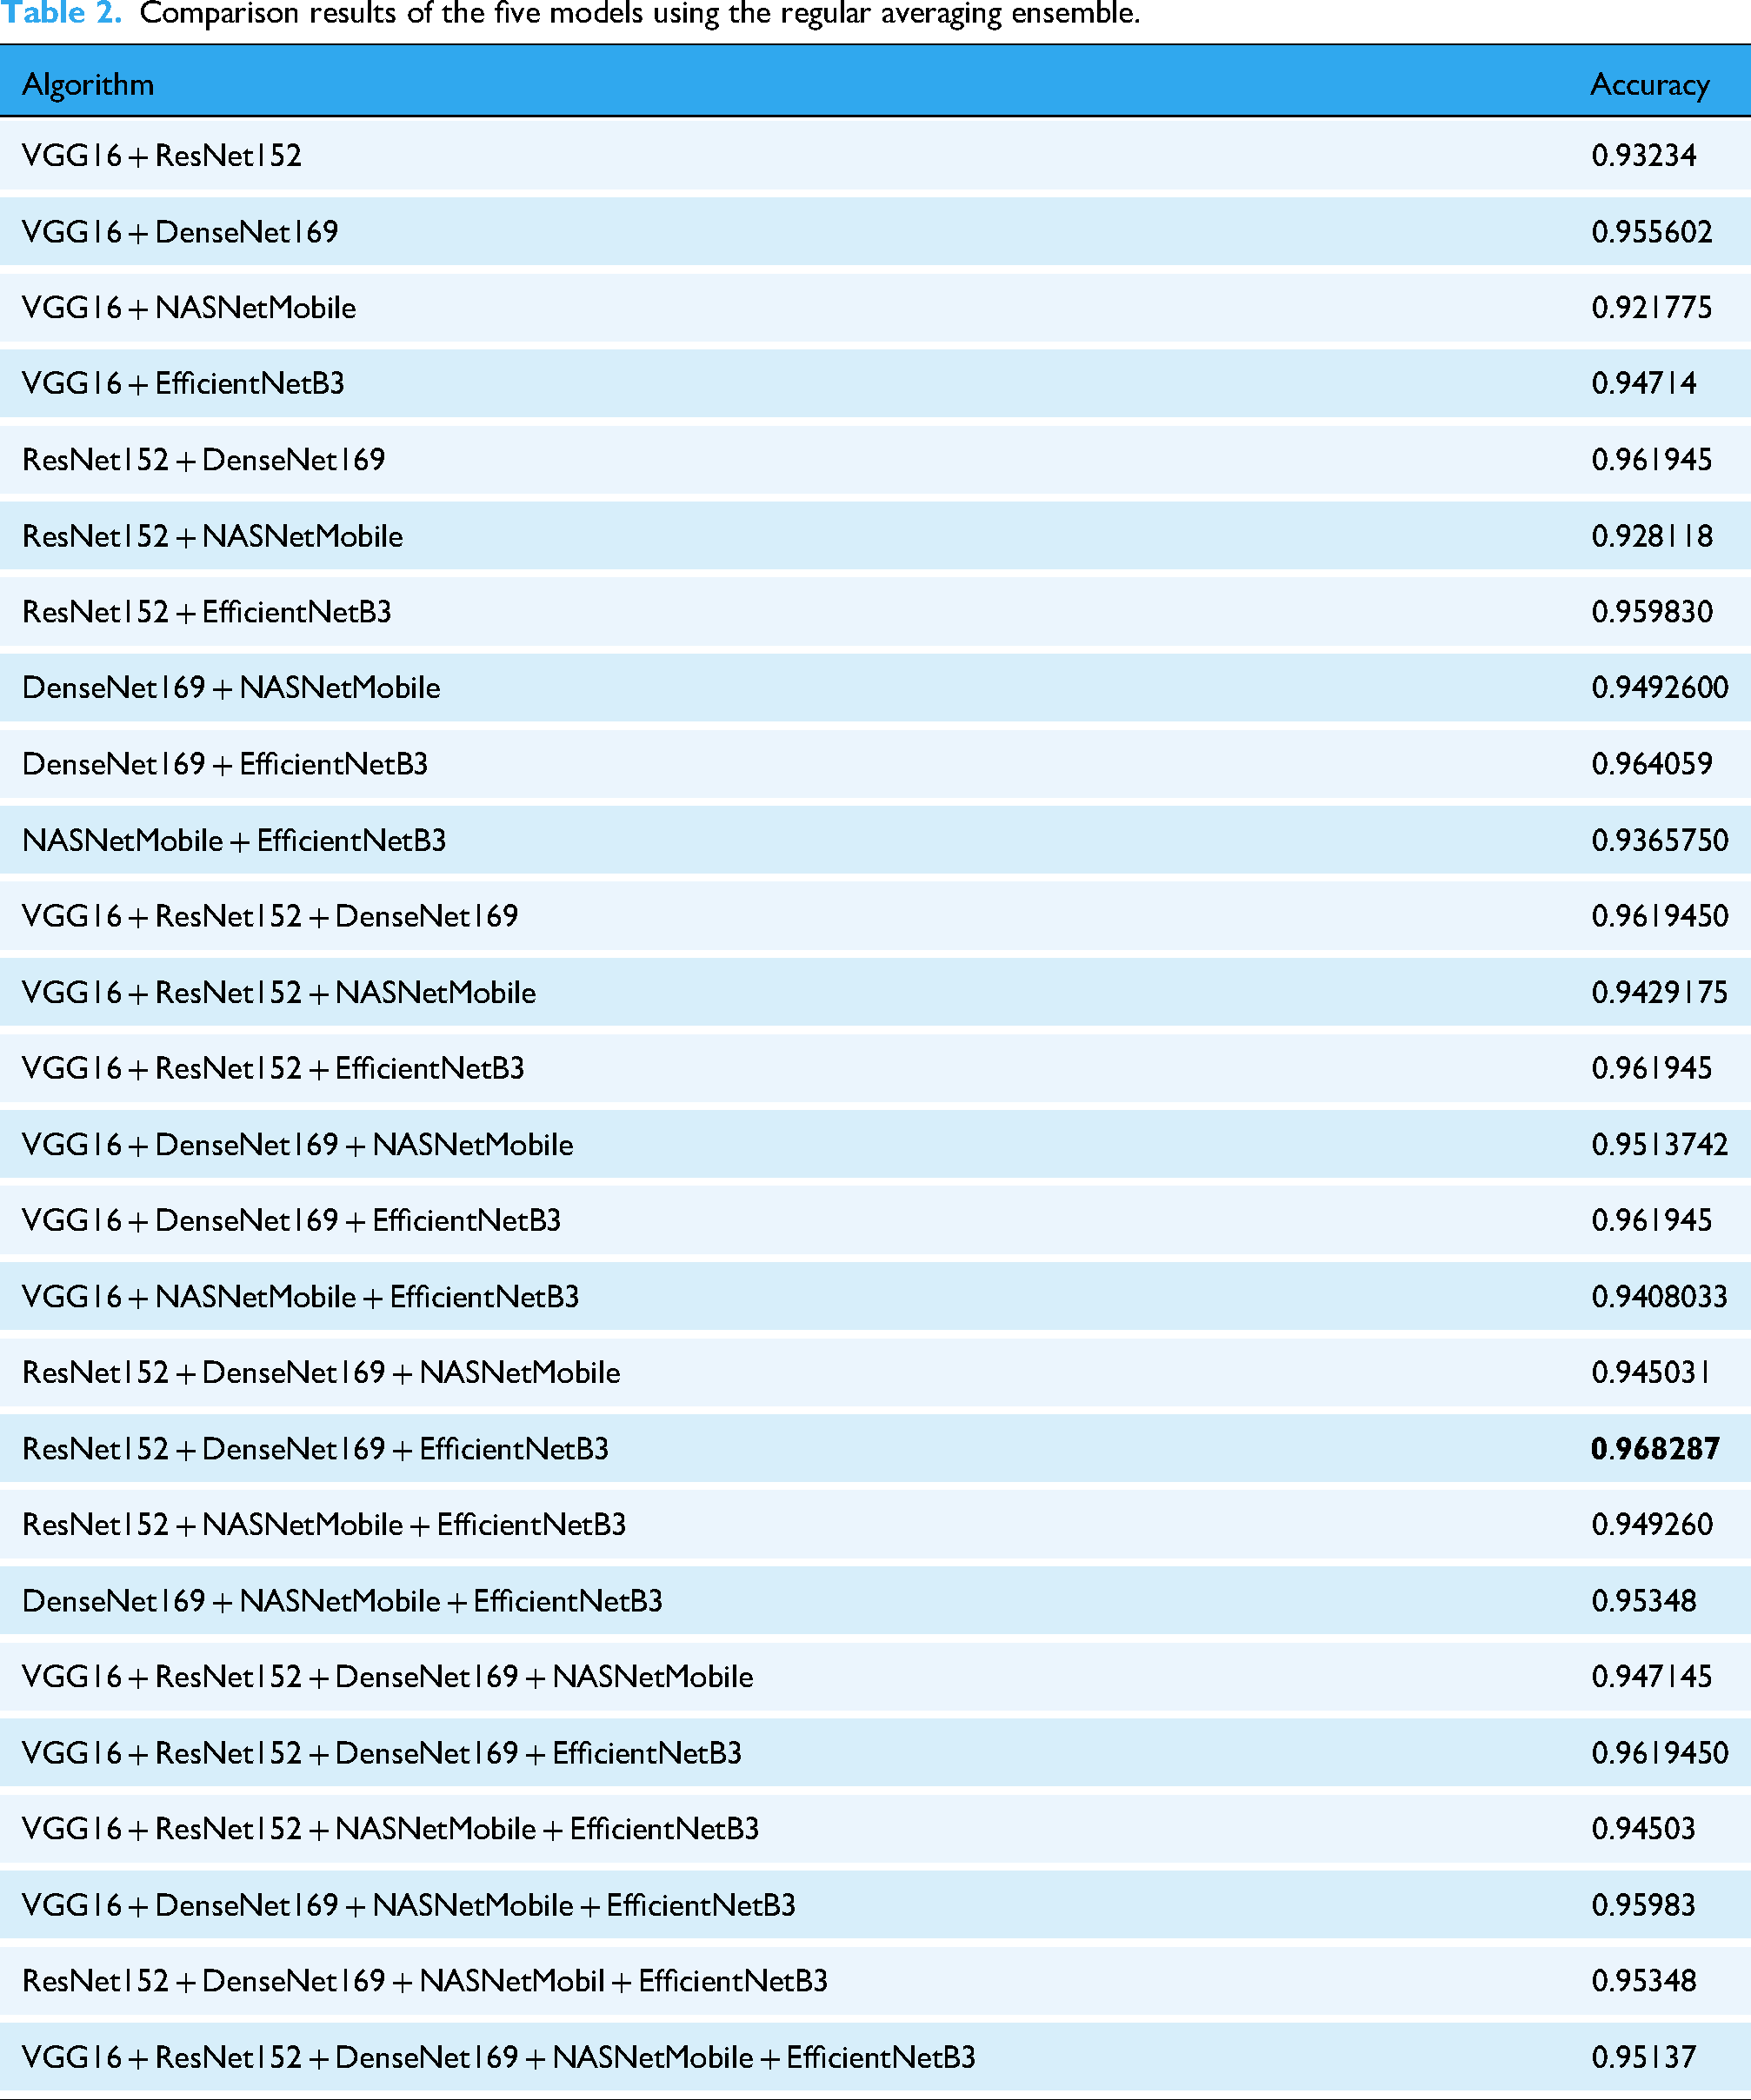
Table 1 shows that all the models performed exceptionally well, with good accuracy. Among them, DenseNet performed better, with an accuracy of 96%. The loss is also low compared with that of the other models. The performance of the ensemble models is presented in Table 2, where the accuracy of all the possible ensemble models is given. The model indicates that the ResNet152, DenseNet169, and EfficientNetB3 ensembles are comparatively better than other ensembles with almost 0.97% accuracy. However, most of the ensembles of the model generate accuracies of more than 95%. One ensemble consisting of five transfer learning models, VGG16, ResNet152, DenseNet169, NASNetMobile, and EfficientNetB3, achieved an accuracy of 95%. The remaining ensembles have two, three, and four TL models.
Comparison results of the five models using the regular averaging ensemble.
The accuracy of the ensemble models using the selected VGG16, ResNet152, DenseNet169, NASNetMobile, and EfficientNetB3 is demonstrated in Figure 6(a). Figure 6(a) shows that DenseNet169 performed better than the other transfer learning models did, whereas NASNetMobile performed relatively poorly, and the ensemble accuracy was almost equal to the average accuracy.

(a) Visualization of the accuracy of the average and ensemble methods. (b) Accuracy visualization of all possible ensemble results.
In Figure 6(b), we visualize the ensemble models with all possible accuracies from Table 2 and put them into a graph. The graph clearly shows that the average accuracy of all the possible models is good, which is greater than 95%. The ensemble of models ResNet152, DenseNet169, and EfficientNetB3 achieved the best score, approximately 97%. Although most of the ensembles achieved nearly the best score, only one ensemble, consisting of VGG16 and NASNetMobile, achieved approximately 92% accuracy.
The confusion matrix (CM) is one of the standard tools that researchers use to analyze model performance, such as visualizing to compare the results. Researchers frequently use this to evaluate the performance of models such as those recognizing sign language. 29 A confusion matrix is a table that compares actual and predicted values. The properties of the confusion matrix include TP, TN, FP, and FN, as described earlier. The CM of our models is presented in Figure 7.

Confusion matrix for the proposed models.
In Figure 7, the CM of ResNet152 shows that diabetic_retinopathy is detected the most correctly, 121 times with 0 incorrect detections, whereas cataract detected 101 images correctly and was confused with glaucoma and normal 8 and 1 times, respectively. We present the confusion matrix for our models. Confusion matrices show the correct detection of diseases. Here, we also present the confusion matrices of DenseNet169, EfficientNetB3, and NASNetMobile. DenseNet169 yields more accurate predictions than the other models do.
For further evaluation of the models, we demonstrated more performance metrics, such as precision, recall, F1 score, and support, which are also presented in detail in Table 3. Along with all the models, the classes of the disease are also given. The table shows that DenseNet169, ResNet152, and EfficientNetB3 achieve better performance in terms of all the metrics.
Total detail overview of the classification reports for the models.

cr: cataract; dr: diabetic retinography; gc: glaucoma; nm: normal.
Discussion
The primary objective of this study was to evaluate the performance of several transfer-learning-based deep CNN models for retinal disease classification. Our results indicate that these models provide a robust solution for a task where traditional methods often falter. The detailed analysis of the models’ performance, particularly their accuracy, loss, and the stability of their F1 scores as measured by confidence intervals (CIs), offers valuable insights into their effectiveness. This section delves deeper into these findings, compares the models’ strengths and weaknesses and discusses the implications of our results for early and precise ophthalmology diagnosis.
We also calculated the CIs for the F1 score. The CI is a fundamental statistical tool that quantifies the uncertainty around an estimate by providing a range of plausible values for an unknown population parameter. A narrow confidence interval indicates that your point estimate is likely very close to the true performance. A wide confidence interval suggests more uncertainty.
In Figure 8, we presented the comparison graph for the impact of bootstrap size and confidence level on the estimated macro F1 confidence interval for the proposed five TL models, and in Table 4, we presented the concise summary of the 95% bootstrap CIs for macro F1 for them, as estimated by 10,000 bootstraps for each model. Based on the graph in Figure 8, DenseNet169 shows the narrowest interval, which has a CI width of ≈ 0.036, indicating the most stable F1 estimate among the models. EfficientNetB3 follows with a width of ≈ 0.041, also showing high precision. NASNetMobile has the widest interval (≈ 0.060), suggesting its F1 estimates are subject to greater variability.

Comparison graph for the model's CI for F1.
95% bootstrap confidence intervals (CIs) for macro F1.

We present the prediction of eye disease from test images via the employed models in Figure 9(a) to (f). The predicted class is shown in the image. The models demonstrate exemplary performance in predicting disease in images. In most cases, the models recognized the disease correctly. The VGG16 image in Figure 9(a) correctly detected diabetic retinopathy, cataracts, and glaucoma, although it incorrectly predicted the normal image.
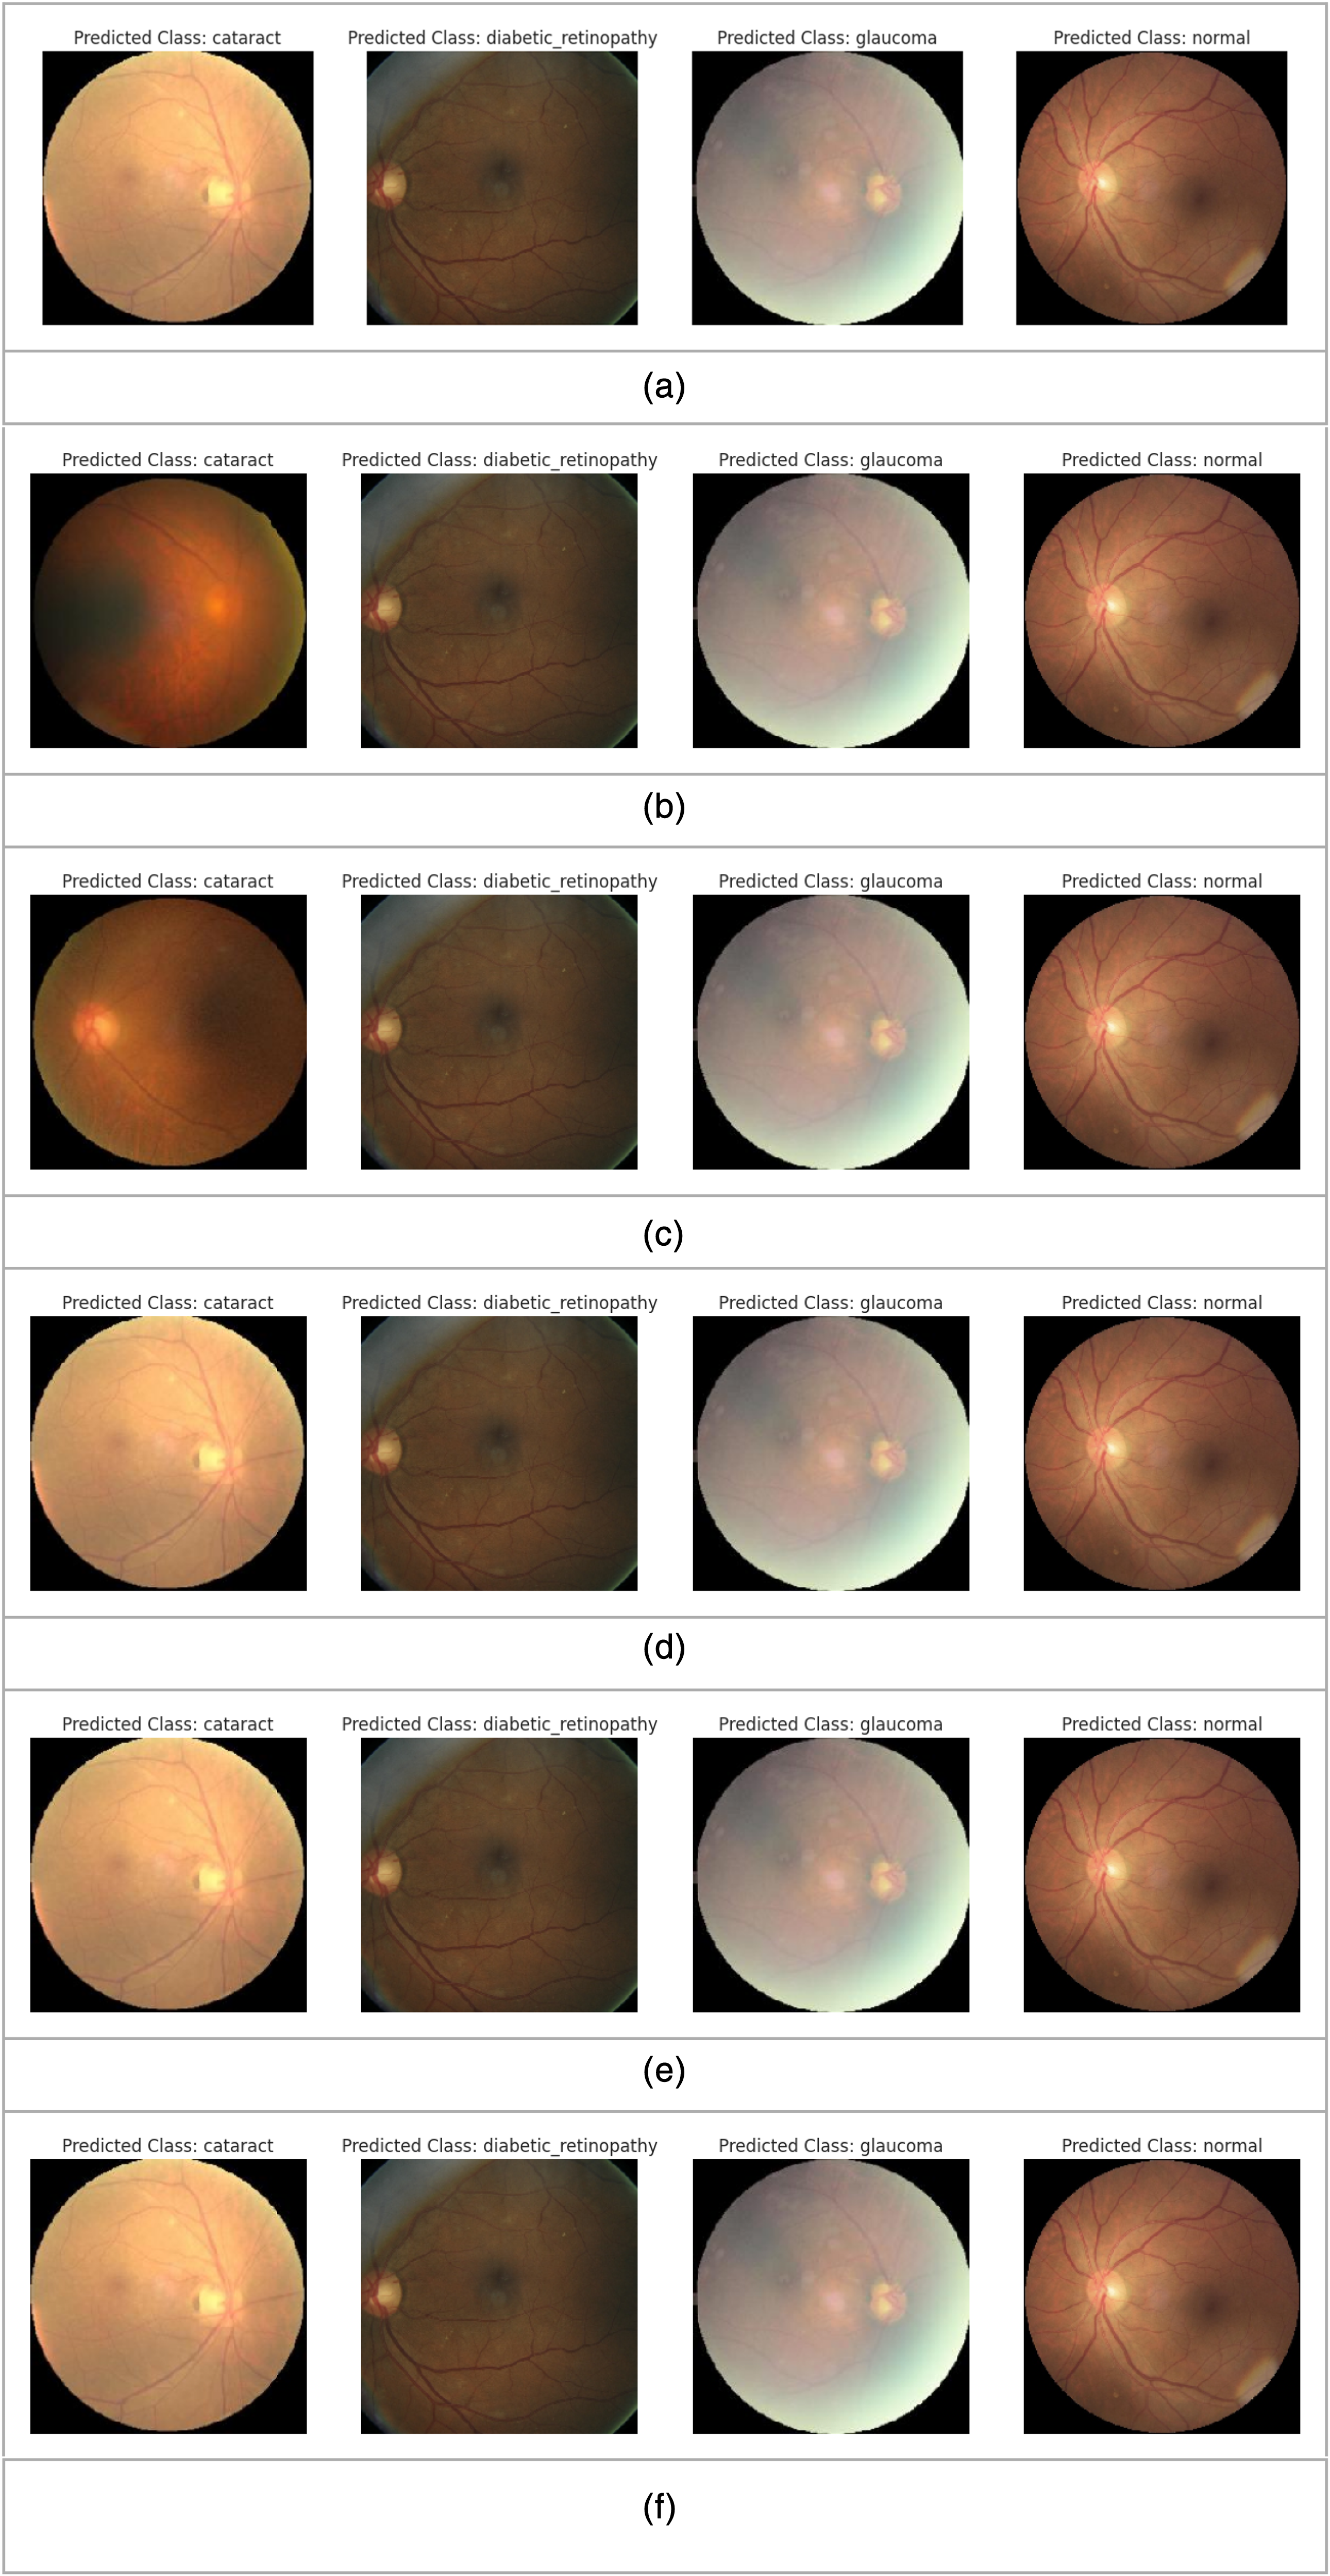
(a) VGG16. (b) ResNet152. (c) EfficientNetB3. (d) DenseNet169. (e) NASNetMobile. (f) Ensemble of VGG16, ResNet 152, EfficientNetB3, DenseNet169 and NASNetMobile.
Figure 9(b) shows the outcome of ResNet152, which detected the image as a cataract, diabetic retinopathy, glaucoma and normal class. EfficientNet also correctly detected cataracts, diabetic retinopathy, and glaucoma, as shown in Figure 9(c). DenseNet169 correctly recognized cataracts, diabetic retinopathy, and glaucoma disease from the image presented in Figure 9(d). NASNetMobile correctly detected cataracts, diabetic retinopathy, glaucoma, and normal conditions, as shown in Figure 9(e). The ensembles of VGG16, ResNet 152, EfficientNetB3, DenseNet169 and NASNetMobile also correctly detected cataracts, diabetic retinopathy, and glaucoma disease, as shown in Figure 9(f).
A feature map is a convolutional layer's output, representing the input layer after learning features. Researchers have used this approach to develop a model for detecting eye disease. 30 The feature maps of our predicted images for EfficientNetB3, DenseNet169, ResNet 152, VGG16, and NASNetMobile are consequently shown in Figure 10(a) to (e). We present the feature maps for all the models employed in this research. The feature maps of our model demonstrated the detected features, such as edges, textures, and patterns in various spatial locations.

(a) EfficientNetB3. (b): DenseNet169. (c) ResNet152. (d) VGG16. (e) NASNetMobile.
The detection of the disease from images is also evaluated through various techniques for extracting and interpreting the kinds of information from images, such as which regions of the image are targeted to locate the disease by the model, detect the irregularities of the image, and segment the specific object. Figure 11 illustrates the precise location of the disease area on the basis of the experimental results. We used the heatmap to show regions where our models focused on or detected the features to detect the disease. Anomaly visualization detects and highlights irregularities in images that deviate from a learned regular pattern. We segment the images into multiple segments to isolate specific objects, such as disease locations, and analyze the area.

Predicted image analysis.
Our proposed research demonstrates the applicability of TL models in detecting diseases, especially eye disease. The developed models detect the disease correctly, with more than 90% accuracy. Our research methods and datasets differ from other methods in terms of their methods and accuracy. The performance comparison between traditional machine learning models and the proposed best deep learning models is illustrated in Table 5.
Comparison of the baseline performances of traditional approaches from the previous experiment 24 and CNN-based models.

Figure 12 depicts the CRVO and BRVO of a retinal eye image with the disease. The CRVO shows the affected optic nerve region where the retina's central vein exits the eye, and the BRVO presents the arteriovenous intersection location of occlusion. This retinal occlusion of the vein occurs when a blockage carries blood and nutrients to the retina's nerve cells. When blockages occur, they lead to hemorrhages, decreased vision, and eventually vision loss. As no cure has yet been discovered for vein occlusion, diagnosis and detection are essential for treating this disease.

Detection of CRVO and BRVO in diseased eye images. (a) Detected CRVO. (b) Detected BRVO.
Table 5 shows a comparison of the baseline performance of traditional approaches and CNN-based models. The main purpose of each experiment is to offer deeper insights into the performance of each individual model and the ensemble, as well as to analyze whether the selected models perform better than others do and how combining them can lead to better and superior performance. Individually, each model's main purpose is to experiment with the best model to detect eye disease accurately. Among the selected models, the main purpose of VGG16 is its large number of parameters and benchmark for image classification tasks. In our experiment, VGG16 achieves high performance, with 93% accuracy. ResNet152 is used for residual connections to address the vanishing gradient problem in very deep networks. Our proposed ResNet152 model achieved 95% accuracy, which captures more complex patterns in the data, making it more robust. To improve feature reuse and reduce the number of parameters, DenseNet169 was employed and achieved 96% accuracy, the best among the TL models. For light devices, we employed NASNetMobile, which is optimized for mobile devices to balance performance with resource constraints, and the accuracy is 87%. EfficientNetB3 is used for its better accuracy with fewer parameters and an efficient scaling strategy. This model achieves 94% accuracy. Finally, ensemble models combine the strengths of individual models, mitigating their individual weaknesses and improving their generalizability to unseen data. The ensemble typically reduces overfitting and increases accuracy by leveraging diverse learned features by averaging predictions from multiple models. Our best combination of ensemble models reached 97%.
In contrast, NASNetMobile performed relatively poorly, with 87% accuracy. This is likely because NASNetMobile is a lightweight architecture optimized for computational efficiency, particularly for mobile devices, which may limit its capacity to learn the complex and subtle patterns in high-resolution retinal images compared with larger, more parameter-heavy models such as DenseNet169. From a training perspective, its performance could be enhanced in future work by applying architecture-specific hyperparameter tuning, such as a tailored learning rate schedule (e.g. cosine annealing), or by using more extensive data augmentation techniques to help the model learn more robust features.
Table 6 presents the comparison between other existing methods until November 2024 and our proposed method.
Comparison of our proposed method with several existing methods.

We compare the performance of our proposed model with several state-of-the-art deep learning models to benchmark its performance.
In Table 7, we summarize the accuracy of our proposed model along with other notable models.The sizes of our proposed models for DenseNet169, EfficientNetB3, NASNetMobile, ResNet152, and VGG16 are 151.1 MB, 129 MB, 55.2 MB, 675.5 MB, and 170.1 MB, respectively. The inference times for the CPU and GPU differ for all the models. The average inference time for these models on the GPU GT 710 is 104 ms per image and 258.5 ms per image on the CPU. Moreover, NASNetMobile requires less inference time for both the CPU and the GPU, which are 120 to 150 ms/image and 50 to 70 ms/image, respectively. This is the light model for both CPU and GPU hardware, which is more feasible in clinical settings than other models are. The longest inference time required for ResNet152 is 450 to 600 ms/image for the CPU and 150 to 200 ms/image for the experimental GPU. However, the models are feasible with less expensive hardware but prefer a GPU for faster inference.
Performance comparison with state-of-the-art models.

The proposed study has several limitations and challenges, such as the lack of demographic diversity in the implemented dataset of our models. The dataset lacks some information regarding patients’ age, ethnicity, or sex. Therefore, the model's performance across different demographic groups could not be assessed, which could lead to potential risks of bias, and this is critical to address the fair and ethical implementation of AI systems in ophthalmology. In our future research, we will prioritize datasets that capture a wide range of demographic variations to ensure broader applicability and equitable healthcare outcomes. In addition, with respect to resource limitations, we have chosen the selected algorithms for our experiment because of their strong performance on benchmark datasets and their suitability for the specific challenges addressed in our study. While transformer-based models such as Vision Transformers and Swin Transformers offer promising alternatives, their computational demands and challenges, such as a lack of adoption in existing systems, make them less suitable for our experiments. We will explore these advanced models in our future work.
Our experiments were conducted on a machine with a GeForce GT 710 GPU, which is a legacy hardware component. While this demonstrates the model's feasibility on resource-constrained systems, it is a limitation, as training on more advanced GPUs could lead to faster convergence and enhanced model performance. Future work should involve re-evaluating these models on state-of-the-art hardware to establish a more definitive performance benchmark.
Conclusion
Our study demonstrates that automated diagnosis of retinal disease via ensemble models of transfer learning techniques based on convolutional neural networks is beneficial both theoretically and practically. Research on eye disease can achieve good growth in the use of transfer learning technologies. In this research, we successfully employed five TL models—VGG16, ResNet152, DenseNet169, NASNetMobile, and EfficientNetB3—employing a significant pretrained architecture with an integrated object-detection module for vein-occlusion localization and achieved remarkable performance in detecting eye diseases. Each model remarkably achieved notable performance in correctly classifying the disease. Moreover, by fine-tuning ImageNet-pretrained models on a moderate-sized dataset consisting of images with eye disease, we show that this feature reuse remains highly effective even with a scarce dataset of a particular domain. In addition, our extensive analysis of model combinations proves that even simple averaging of Softmax outputs can deliver significant performance gains. Our research on eye disease using pretrained models is highly important in terms of detecting eye disease early to prevent people from experiencing fatal stages of the disease. These findings will help medical professionals and future researchers in this field.
The research contributions of the proposed experiment involve curating a large retinal image database and implementing models via transfer learning techniques and ensembling them along with SSD to detect CRVO and BRVO. We develop and assess an ensemble comprising five state-of-the-art CNNs, achieving improvement over the best individual model and demonstrating that model diversity drives performance. In terms of practical advantages, the proposed system offers very high diagnostic accuracy in identifying cataracts, diabetic retinopathy, glaucoma, and normal cases. Importantly, the balanced use of both lightweight (NASNetMobile) and heavyweight (ResNet152, EfficientNetB3) architectures ensures that the ensemble can be deployed flexibly—from resource-constrained teleophthalmology units in remote regions to high-throughput hospital settings—without compromising either speed or accuracy. However, the models have limitations, such as the number of training epochs, due to model training environments such as GPUs. In addition, increasing the number of images of eye disease in training models can also improve model performance. In our future model, we will collect more images containing eye disease and other types of diseases from hospitals and various organizations. The importance and applicability of this research are very important for society in terms of healthcare, and our initiative can be helpful in future research on eye society.
Footnotes
Acknowledgments
The authors would like to extend their sincere appreciation to the Ongoing Research Funding program (ORF-2025-301), King Saud University, Riyadh, Saudi Arabia.
Ethical approval
Not applicable.
Consent to participate
Not applicable.
Consent to publication
Not applicable.
Contributorship
Ferdaus Anam Jibon, Fazle Rabby, Naimur Rahman, Md. Rasel Uddin, Fazle Rabbi Rushu, and Md. Ashraful Islam did conceptualization, data curation, methodology, software, resources, visualization, validation, formal analysis, supervision, writing-original draft, writing-review and editing. Md. Ashraf Uddin and Ansam Khraisat performed software, resources, visualization, and validation. Mohsin Kazi and Md. Alamin Talukder did methodology, software, resources, visualization, validation, formal analysis, supervision, writing-original draft, writing-review and editing.
Funding
This research project was supported by the Ongoing Research Funding Program (ORF- 2025-301), King Saud University, Riyadh, Saudi Arabia.
Declaration of conflicting interests
The authors declared no potential conflicts of interest with respect to the research, authorship, and/or publication of this article.
Data availability statement
Declaration of AI tool usage
The authors acknowledge the use of AI-based tools—Grammarly for grammar and style suggestions, QuillBot for paraphrasing support, and ChatGPT for language refinement and technical phrasing—during the development and editing of this manuscript.
Guarantor
Md. Alamin Talukder.