
Abstract
Objective
To evaluate the impact of integrating digital shadow technology with Lean Six Sigma methodology on intra-laboratory turnaround time (TAT) in a high-volume clinical laboratory, and to demonstrate how digital shadow architectures can enhance process visibility and drive sustainable operational improvements.
Methods
A retrospective, two-phase study was conducted in a tertiary cancer hospital from January to December 2024. Digital shadow technology was implemented by leveraging real-time, time-stamped data from the laboratory information system (LIS) to map specimen workflow milestones. The Lean Six Sigma Define, Measure, Analyze, Improve, Control framework guided process analysis and improvement, supported by value stream mapping (VSM), Pareto Analysis, and root cause analysis (RCA). Targeted interventions were developed and deployed based on identified bottlenecks. Specimen intra-laboratory TAT data from 2023 and 2024 were compared using the Mann–Whitney U test, with results visualized through LIS dashboards.
Results
Integration of digital shadow technology enabled continuous, real-time monitoring of specimen, facilitating the identification of instrument- and department-specific delays. Following targeted interventions, the median intra-laboratory TAT decreased from 77.2 min to 69.0 min (a 10.6% reduction, p = 0.0182). Improvements were sustained through updated standard operating procedures, accountability measures, and ongoing staff training. The digital shadow approach required no additional analyzers or capital investment and delivered substantial performance gains.
Conclusion
This study demonstrates that digital shadow integration with Lean Six Sigma can significantly optimize laboratory efficiency by providing actionable, real-time process data. The approach offers a scalable, resource-efficient model for continuous quality improvement, supporting healthcare digital transformation.
Introduction
The clinical laboratory is a key component of the healthcare system, providing important and timely diagnostic information that supports clinical decisions, disease control, and patient care.1,2 Turnaround time (TAT)—the time from sample collection to result reporting—is an important measure of laboratory performance, as it directly affects how quickly patients can be diagnosed and treated. For instance, reducing TAT for critical tests like sepsis or heart attack markers can significantly improve patient outcomes. 3 Delays in TAT may lead to more extended hospital stays, higher healthcare costs, and negative impacts on patient outcomes.4,5 Therefore, improving laboratory processes, especially reducing the time spent within the lab, is essential for better healthcare services and patient satisfaction.
Traditional clinical laboratory testing involves numerous interconnected steps, including specimen reception, pre-analytical processing, analytical testing, and post-analytical reporting. 4 During this process, samples are often transported between different departments within the lab. Knowing how much time is spent at each stage helps identify delays and areas where improvements can be made.4,6 However, due to the complex steps, manual operations, and the risk of human error, inefficiencies can still occur and increase the overall TAT.7–9
Lean methodology, a management philosophy originating from the manufacturing industry, focuses on maximizing value while minimizing process waste.10,11 Implementing lean principles in clinical laboratories has gained significant traction to streamline workflows, eliminate non-value-added activities such as redundant data entry, unnecessary sample transportation, and waiting time, reduce errors, and improve TAT.1–4,12–15 Tools such as value stream mapping (VSM) enable the visualization of the entire laboratory process, facilitating the identification of waste and opportunities for improvement.16–18
In today's digitally driven healthcare landscape, lightweight digital shadow architectures—defined as real-time, one-way mappings of physical processes into a virtual dashboard—provide a first step toward enhancing laboratory visibility and efficiency. 19 By integrating the time-stamp data already generated by laboratory information systems (LIS) with IoT sensor streams such as barcode or RFID events, a digital shadow of the specimen-handling workflow can be instantiated. 20 This virtual trace affords continuous oversight of each sample at critical milestones—including reception, intra-laboratory transport, accessioning, and analytical phases—thereby enabling retrospective audit and near-real-time bottleneck detection. We assessed a LIS-based digital shadow to monitor intra-laboratory specimen flow in real time and applied Lean Six Sigma to remove bottlenecks that prolong TAT.
Materials and methods
This retrospective study was conducted from 1 January 2024 to 31 December 2024, comprising two distinct phases: a baseline period from January to September and a Lean Six Sigma implementation phase from October to December. The specimen TAT, including all workflow stages, was monitored through digital shadow technology integrated within the Donghua (China) LIS. Specific time-stamps recorded included specimen collection, transportation, receipt, accessioning, and result verification time. Moreover, comparative TAT data from 2023 were also obtained to serve as a reference for evaluating system performance.
The study employed the Define, Measure, Analyze, Improve, Control (DMAIC) structured methodology integral to Lean Six Sigma. The phases involved clearly defining improvement objectives and process boundaries (Define), measuring current performance to establish baseline metrics (Measure), analyzing root causes of inefficiencies using appropriate statistical tools (Analyze), implementing targeted interventions to optimize processes (Improve), and establishing control plans to sustain the improvements achieved (Control). Key Lean Six Sigma tools, such as VSM, Pareto chart, and root cause analysis (RCA), were systematically applied throughout the DMAIC cycle to identify inefficiencies, streamline processes, and ensure sustained improvement intra-laboratory TAT.
The distribution of specimen intra-laboratory TAT was examined visually (histogram, Q–Q plot) and with the Shapiro–Wilk test, revealing marked right-skewness (p < 0.001). Accordingly, we report medians and use the non-parametric Mann–Whitney U test to compare pre-implementation (January–September 2024) and post-implementation (October–December 2024) specimens. Two-sided p-values < 0.05 were regarded as statistically significant. We report the Hodges–Lehmann estimator of the location shift with exact 95% confidence intervals and Cliff's delta as the effect size. Cliff's delta with 95% Wald (asymptotic normal) confidence intervals was computed in https://www.datacamp.com/datalab/w/c2387ee3-1d61-4128-a074-feac2cfb44ae/edit. Statistical analyses were performed using IBM SPSS Software ver. 25.0 (IBM Corp., Armonk, NY, USA).
All figures, except for the VSM diagram and the RCA diagram, were created using Microsoft Excel 2019 (Microsoft Corp., Redmond, WA, USA) for data visualization and statistical analysis. The VSM and RCA diagrams were created using EdrawMax (Edraw Software, Shenzhen, China).
Data validation and system robustness
The Donghua LIS platform deployed in our laboratory is a widely used, commercial-grade information system in China, compliant with national healthcare IT standards. All specimen time-stamps and workflow data are automatically recorded without manual intervention. To ensure data integrity, we conducted routine cross-checks between LIS-generated logs and physical sample-tracking sheets for a random subset of specimens (n = 50 per month). No discrepancies were detected. System uptime and data interface stability were monitored throughout the study period. These steps confirm that the digital shadow accurately reflects the real-world laboratory process and supports the reproducibility of our findings.
Define
The Shenzhen Center of Cancer Hospital, Chinese Academy of Medical Sciences, a tertiary grade-A specialized cancer hospital with a capacity of 880 beds, was officially established and commenced operations on 18 March 2017. The laboratory comprises the Biochemistry, Immunology, Hematology and Body Fluids, Microbiology, and Molecular Diagnostics Department. Annually, the hospital's administrative personnel and the quality management officer of the Clinical Laboratory adjust quality management objectives based on laboratory performance data from the preceding year, including the target for intra-laboratory TAT. According to data from 2023, the median intra-laboratory TAT target for 2024 was set at 70 min. However, in early 2024, preliminary performance monitoring revealed that intra-laboratory TAT had consistently exceeded the annual target, drawing concern from quality management personnel and prompting further investigation.
Accordingly, we established a multidisciplinary lean healthcare team. We implemented a Quality Control Circle (QCC) comprising leaders from the Clinical Laboratory Department, Medical Affairs Department, Information Technology Department, Nursing Department, and Hospital Administration. In this study, total TAT is defined as the duration from specimen collection to the release of test results. In contrast, intra-laboratory TAT refers to the duration from specimen receipt by laboratory personnel to report release. Since the hospital employs the median as the statistical measure when evaluating laboratory TAT targets, all subsequent references to TAT (including total TAT and intra-laboratory TAT) in this study pertain specifically to median times. Additionally, the specimens analyzed in this study only included samples collected from inpatients.
Measure
In the Measure phase, data were collected from the entire year of 2023 and from January to September 2024. The QCC extracted monitoring data from the Donghua LIS at multiple time points. From January to September 2024, the total TAT was 126.2 min, with an intra-laboratory TAT of 77.2 min. In comparison, during the same period in 2023, the total TAT was 141.3 min, while the intra-laboratory TAT was 75.4 min.
Analyze
Firstly, a VSM was constructed based on data collected from January to September 2024, illustrating value-added and non-value-added activities. The VSM revealed that non-value-added time was most evident within the intra-laboratory TAT, particularly between specimen receipt and accessioning. Since the Clinical Laboratory comprises multiple departments—including Biochemistry, Immunology, Hematology and Body Fluids, Microbiology, and Molecular Diagnostics—a department-level analysis was conducted using monitoring data to determine which department contributed most significantly to the delay in this phase. Based on the findings, the QCC conducted a brainstorming session and employed the “5 Whys” technique, supported by a tree-structured diagram, to identify the underlying causes. The five-member QCC team evaluated each root cause using a five-point rating scale and ranked them in descending order based on the total scores. A Pareto chart was subsequently used to highlight the most critical contributing factors.
Improve
In the Improve phase, the QCC conducted brainstorming to develop practical countermeasures targeting the top five root causes identified in the Analyze phase. These sessions involved cross-functional stakeholders, including the representatives of the Clinical Laboratory, Nursing Department, Medical Affairs, and Hospital Administration. The team prioritized solutions based on feasibility, impact, and alignment with hospital goals. Pilot implementation began in October 2024, and effectiveness was monitored via real-time LIS dashboards and monthly QCC evaluations. Early results showed a consistent decline in intra-laboratory TAT, validating the effectiveness of the targeted interventions. These interventions addressed technical and organizational issues, including staff awareness, standard operating procedure (SOP) standardization, performance accountability, managerial oversight, and cultural priorities.
Control
In the Control phase, measures were implemented to sustain improvements and prevent regression. The hospital's Quality Management Committee revised and formally approved SOPs for specimen receipt and accessioning. Training sessions were conducted for laboratory and nursing staff to reinforce adherence to the new procedures. Key process indicators (KPIs), including monthly intra-laboratory TAT median values, were integrated into the laboratory's quality management dashboard for ongoing monitoring. Monthly quality review meetings involving the QCC and hospital administrators were instituted to evaluate TAT performance and address emerging issues. These control mechanisms ensured that the improvements made during the project would be maintained and continuously optimized.
Results
Current state analysis
An analysis of the total TAT data from January to September in both 2023 and 2024 revealed a reduction in total TAT in 2024. Specifically, the average of the monthly median total TATs from January to September 2024 was 126.2 min, compared to 141.3 min during the same period in 2023 (Figure 1). However, a further breakdown indicated that the intra-laboratory TAT showed an opposite trend: the average of the monthly median intra-laboratory TATs in 2024 was 77.2 min, slightly higher than the 75.4 min recorded in 2023. The intra-laboratory TAT comprises two phases: Specimen Receipt to Accessioning and Accessioning to Report Release. Interestingly, the median TAT for the Accessioning to Report Release phase decreased in 2024, averaging 33.4 min from January to September, compared to 36.7 min during the same period in 2023 (Figure 2). This suggests that the observed increase in intra-laboratory TAT in 2024 was primarily attributable to delays in the Specimen Receipt to Accessioning phase, a finding also supported by the VSM (Figure 3).

Median total TAT for January–September in 2023 vs. 2024. TAT: turnaround time.

Comparison of median durations for three laboratory processing stages between January–September 2023 and 2024.

Value stream map of the specimen workflow identifying non-value-added time. Cycle time (CT); length of stay (LOS); value-added processing time (VAPT); non-value-added processing time (NVAPT).
Root cause analysis of intra-laboratory turnaround time delays
Through a department-level analysis, we identified that specimens contributing significantly to prolonged intra-laboratory TAT were predominantly associated with specific instruments: the STA-R Evolution (Diagnostica Stago, Asnières sur Sein, France) in the Hematology Department, Mindray CL-2000i (Mindray Diagnostics, Shenzhen, China), Roche cobas e602 (Roche Diagnostics, Mannheim, Germany) and Mindray CL-6000i (Mindray Diagnostics, Shenzhen, China) in the Immunology Department (Figure 4).

Instrument-specific distribution of intra-laboratory TAT: percentage composition and absolute specimen counts by time interval (January–August 2024). Percent-stacked bars show the specimen TAT distribution for each analyzers (≤70, 71–140, 141–210, 211–280, > 280 min). Segment width represents the proportion of specimens. The red dashed line marks 50% cumulative frequency (median); if the intersected segment is in any band > 70 min, the analyzers exceeds the laboratory target. TAT: turnaround time.
A RCA and a tree-structured diagram were conducted for the identified non-value-added activities through a Kaizen Burst, as illustrated in Figure 5. Eight root causes were ultimately identified and scored (Table 1), and targeted interventions were implemented based on the Pareto principle (Figure 6). As shown in Figure 6, the eight root causes (R1–R8) are ranked by descending score, and the cumulative-percentage line makes clear that five factors—R1-R5 account for almost 80% of the total weighted impact. In practical terms, this Pareto pattern indicates that focusing corrective actions on these five high-impact issues is likely to yield the largest reduction in intra-laboratory TAT. The remaining causes (R6 – R8) each contribute only marginally (≤ 10% apiece) and were therefore slated for later improvement cycles. Full definitions of R1– R8 are provided in Table 1.
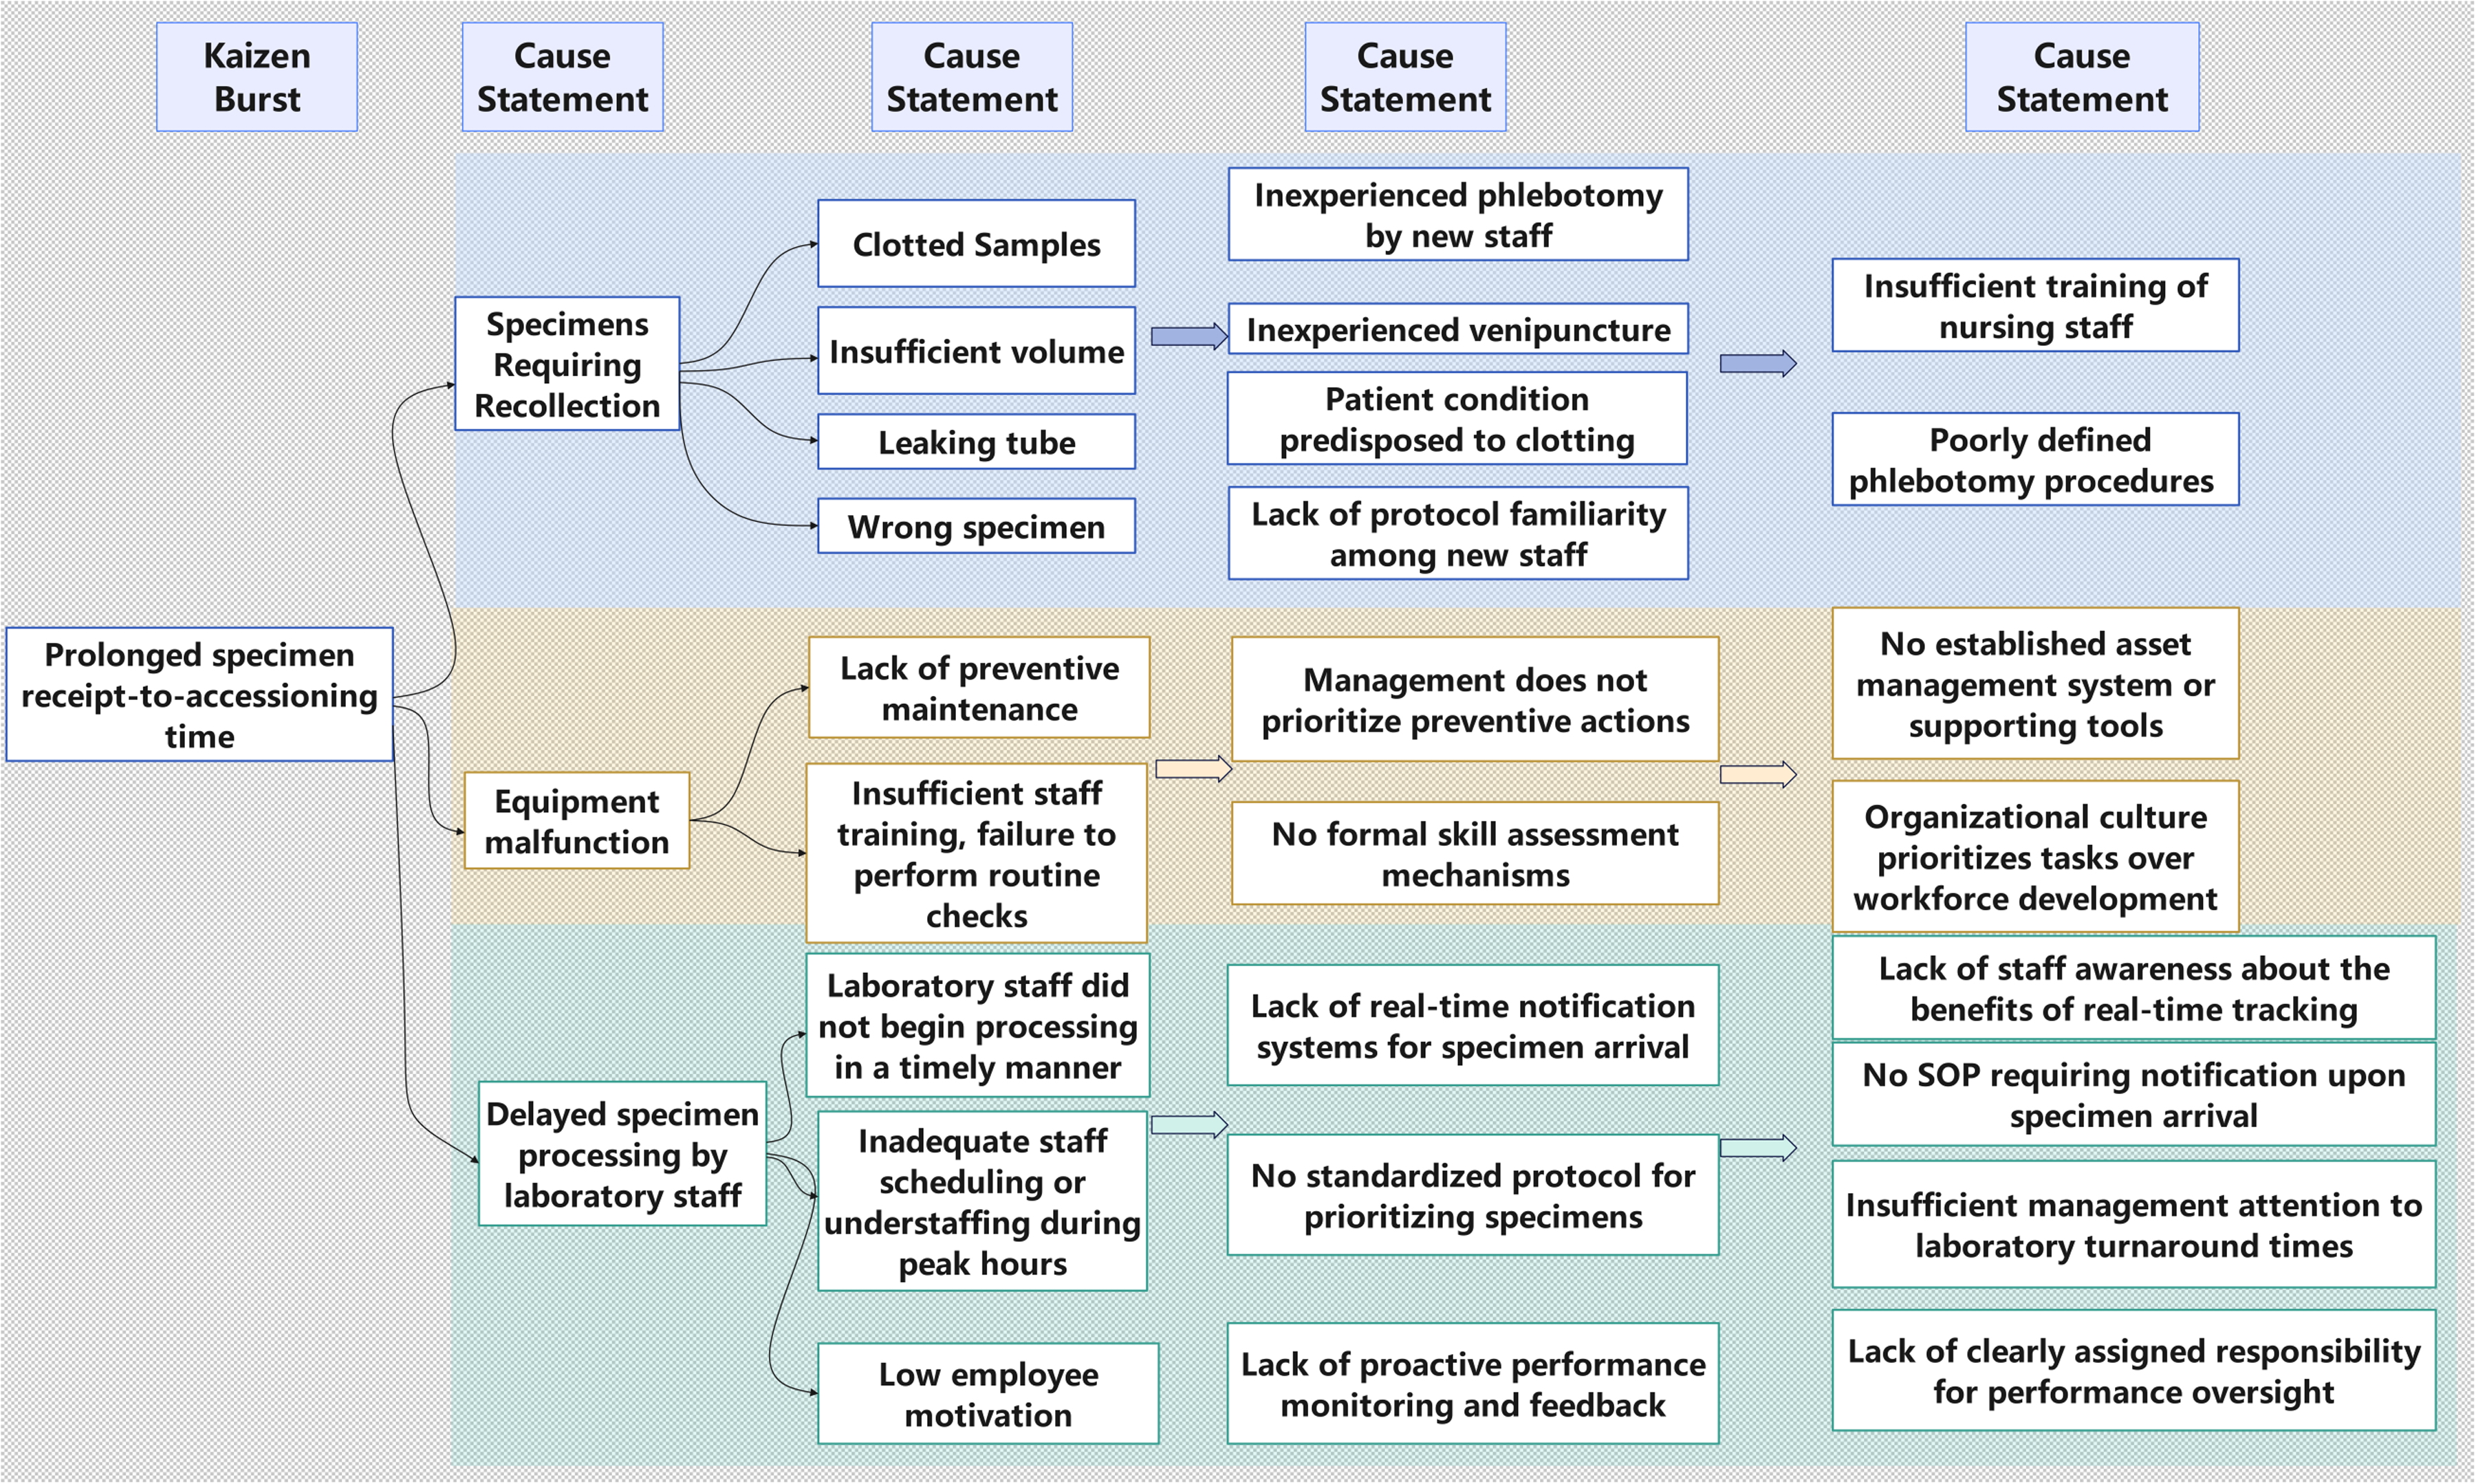
Root cause identification of intra-laboratory TAT delays via 5 whys and Kaizen Burst. TAT: turnaround time.

Pareto chart of root causes contributing to prolonged intra-laboratory turnaround time. The horizontal axis lists eight root causes (R1–R8), arranged in descending order of impact. Blue bars indicate the individual score for each root cause (left Y-axis), while the line graph shows the cumulative percentage of the total score (right Y-axis). The top five root causes (R1–R5) account for over 70% of the total score, highlighting the main contributors to process delays. The specific definitions of R1–R8 are provided in Table 1.
Evaluation of root causes by quality control circle members (5-point scale).

SOP: standard operating procedure.
Post-implementation outcomes
Following identifying five primary root causes through Pareto analysis, the QCC team implemented a series of targeted interventions beginning in October 2024. Interventions targeted five gaps: (1) mandatory orientation and in-service workshops to build awareness of the operational value of real-time tracking; (2) a new SOP requiring units to notify the laboratory upon specimen arrival; (3) named staff in each sub-department assigned to monitor daily specimen flow, supported by a LIS dashboard checklist with escalation; (4) elevation of intra-laboratory TAT to a core quality metric reviewed at monthly hospital performance meetings; and (5) culture reinforcement through structured feedback and recognition for adherence to tracking protocols and workflow-optimization suggestions. Using stage-specific time-stamps from the Donghua LIS, we evaluated all routine specimens. The monthly median intra-laboratory TAT decreased from 77.2 to 69.0 min (−10.6%; Mann–Whitney U test, p = 0.0182; Figure 7). The Hodges–Lehmann estimator of the median difference between pre- and post-intervention was 9.0 (95% confidence interval: 2.0 to 16.0). Cliff's delta for the difference between pre- and post-intervention was −0.93 (95% confidence interval: −0.99 to −0.57), indicating a large effect size. Departments implemented corrective actions mapped to the five Pareto-identified root causes as a system-wide quality policy, with units addressing local gaps or reinforcing best practices; the aim was continuous improvement rather than attribution of blame. Revised SOPs, role assignments, ongoing training, monthly review, and leadership accountability were embedded to sustain gains during the control phase.

Monthly median intra-laboratory TAT before and after implementation of five key interventions (January–December 2024). TAT: turnaround time.
Discussion
Our study demonstrates that the integration of real-time digital shadow monitoring and Lean Six Sigma methodologies can effectively optimize intra-laboratory TAT in a clinical laboratory setting. 18 By combining process transparency with targeted quality improvement interventions, our approach not only achieved a measurable reduction in intra-laboratory TAT but also established a sustainable framework for continuous operational excellence.
Integration of digital shadow and Lean Six Sigma in clinical laboratory practice
Although digital shadow technology is well known in industries such as manufacturing and engineering, its use in clinical laboratories is still limited.21,22 In this study, we built a simplified digital model of the laboratory specimen workflow using time-stamped data from our LIS. While this system does not have advanced features like predictive simulation or automatic feedback to control the physical process, it still allows us to track each specimen's movement through key steps in real time.
This clear process visibility helped us identify where delays were happening—especially the time between specimen receipt and accessioning, which is often missed in traditional laboratory reviews. When combined with Lean Six Sigma's structured DMAIC method, this digital tracking system allowed us to understand process inefficiencies based on real data rather than assumptions. Few reports have applied a digital shadow-inspired approach alongside Lean Six Sigma in clinical laboratories; our data add evidence of feasibility using routine LIS time-stamps.
Significance of department-specific and instrument-linked delays
Our study showed that delays in intra-laboratory TAT did not happen evenly across all departments. Instead, most delays were linked to specific instruments in certain departments. For example, we found that specimens processed by the STA-R Evolution in Hematology, the Mindray CL-2000i, Roche cobas e602 and Mindray CL-6000i in Immunology were more likely to experience delays.
This finding is important because it suggests that making general changes to the entire laboratory process may not be enough. To truly improve performance, we need to focus on the areas and instruments where delays are most common. This also challenges the common idea that delays are mostly caused by general problems like staffing or lab-wide policies. Our results show that each department and instrument has its own workflow challenges, so improvement strategies need to be more detailed and specific.
Sustained improvement through process control
The improvements we achieved in intra-laboratory TAT were not just temporary. To make sure the gains would last, we introduced several control measures during the final phase of the project. These included updating the SOPs, assigning clear responsibilities to staff, and adding KPIs to the laboratory's quality dashboard. We also provided training sessions to make sure staff understood the new processes and followed them correctly. In addition, monthly quality review meetings were held to monitor performance and quickly fix any problems that came up. These efforts helped to create a system where the improved processes became part of everyday work.
Our data from the 3-month control period showed that intra-laboratory TAT remained stable and consistently met the target. This suggests that the improvements were not just one-time changes but became part of the lab's routine. These results support the idea that combining process redesign with long-term monitoring is key to achieving lasting quality improvement.
Implementation feasibility in resource-limited settings
A digital shadow approach such as ours is attractive for laboratories in low- and middle-income countries (LMICs) because it layers onto existing LIS infrastructure and low-cost barcode workflows without the capital, interoperability, and bidirectional control requirements of closed-loop systems. Experiences from Timor-Leste show that modest LIS deployments built with affordable hardware and iterative configuration can reduce transcription errors, improve result timeliness, and strengthen quality management even where connectivity and staffing are constrained. 23 Stepwise implementation is recommended: begin with barcode-based specimen identification and event time-stamping, then add higher-cost RFID or IoT telemetry only where sample volume, transport distance, or cold-chain risk justify the investment—an approach echoed in global LIS implementation guidebooks and practical sample-tracking evaluations. 24 Sustainable scale-up further depends on governance, workforce training, and alignment with national digital health strategies; weak laboratory data systems remain a bottleneck for antimicrobial resistance surveillance and broader pathology services in many LMICs. Accordingly, our timestamp-based digital shadow can serve as an intermediate step that resource-constrained laboratories adopt today while building toward higher-fidelity, closed-loop capabilities as infrastructure matures.
Implications for broader healthcare systems
Improving TAT does not just benefit the laboratory itself—it can also have a positive impact on the entire healthcare system. Faster lab results mean doctors can make quicker decisions, which can lead to shorter hospital stays and better patient outcomes. 25 These improvements also help reduce overall healthcare costs.
The approach we used—combining real-time tracking with Lean Six Sigma—can be applied to other areas of the hospital, such as radiology or pharmacy. Many hospitals already use LIS, so adding similar tracking tools and process improvements could be done without major new investments. As healthcare systems move toward digital transformation, our method offers a practical way to improve efficiency and patient care at the same time.
Because our digital shadow was constructed using the Donghua LIS, a mature and widely deployed platform in China, implementation of the five targeted countermeasures did not require any additional analyzers, middleware, or capital investment. The interventions relied primarily on staff training, with the LIS serving an auxiliary role in process monitoring and KPI reporting. This limited resource investment yielded substantial practical benefits, as reflected by two key performance indicators (KPIs): (i) instrument-level median intra-laboratory TAT (Figure S1), and (ii) the compliance rate for intra-laboratory TAT < 70 min (Figure S2).
Following implementation, the analyzers previously associated with the longest delays demonstrated the greatest improvements. For example, the median TAT for the Roche Cobas e602 declined from 152 min in September to 107 min in December, while the Stago Evolution improved from 95 to 79 min. The TAT compliance rate for Roche Cobas e702 increased from 35.5% to 56.3%. In contrast, high-throughput hematology analyzers (Sysmex XN-9000 and XN-350) consistently maintained a compliance rate above 97%, confirming that resources were effectively targeted to areas with genuine inefficiency. These findings suggest that this approach delivers a favorable return on effort, even for laboratories operating under stringent budget constraints.
Limitations and future directions
This study was carried out in a single cancer hospital, which means the results may not apply to all types of hospitals or clinical laboratories. The system we used also relies on an existing LIS, so hospitals without such systems may need additional resources to apply this approach.
In the future, more studies could test this method in different types of hospitals to see how well it works in other settings. It would also be useful to explore whether adding features like automated alerts or predictive modeling could make the system even more effective. Finally, a cost-benefit analysis could help hospitals understand the value of this kind of digital process improvement.
Conclusion
Integrating a LIS-based digital shadow with Lean Six Sigma reduced intra-laboratory TAT and provided a repeatable framework for ongoing control. By turning routine time-stamps into stage-specific indicators, delays between receipt and accessioning became measurable and actionable, enabling targeted interventions rather than lab-wide, non-specific fixes.
The observed improvements not only reduced intra-laboratory delays but also established a replicable model for continuous quality enhancement in clinical laboratories. Our findings suggest that detailed, instrument-specific workflow analysis is crucial for identifying hidden delays. Embedding such insights into the LIS enables real-time monitoring and supports early intervention—an essential step toward proactive quality management.
As healthcare systems increasingly embrace digital transformation, our study demonstrates a feasible and effective pathway for integrating advanced process monitoring with structured quality improvement frameworks. Future research should focus on multi-center validation, cost-effectiveness analysis, and the potential extension of this approach to other diagnostic and logistical domains within hospital systems.
In summary, our study demonstrates that a digital shadow approach can provide hospital administrators and policymakers with actionable, real-time data on laboratory operations. By enabling data-driven decision-making, our system can inform targeted interventions to optimize workflow, enhance staff utilization, and ensure timely patient care. Adoption of such digital solutions can foster a culture of continuous improvement and accountability, ultimately advancing hospital performance and patient outcomes at both institutional and system-wide levels.
Supplemental Material
sj-docx-1-dhj-10.1177_20552076251375939 - Supplemental material for Optimizing clinical laboratory efficiency through digital shadow and lean six sigma integration: A real-time monitoring approach to reduce intra-laboratory turnaround time
Supplemental material, sj-docx-1-dhj-10.1177_20552076251375939 for Optimizing clinical laboratory efficiency through digital shadow and lean six sigma integration: A real-time monitoring approach to reduce intra-laboratory turnaround time by Xinjian Cai, Yiteng Lin, Lili Zhan, Qiuxia Lu, Zhenzhen Wu and Xinyu Lin in DIGITAL HEALTH
Footnotes
Acknowledgments
We thank all participating departments for their contributions.
Ethical statement
This project analyzed de-identified operational time-stamps from the laboratory information system to evaluate and improve intra-laboratory TAT. No patient interactions occurred and no personally identifiable information or test results were accessed. The Institutional Ethics Committee of Cancer Hospital, Chinese Academy of Medical Sciences & Peking Union Medical College, Shenzhen Hospital confirmed that formal ethics approval was not required for this activity. Per IEC policy, protocol numbers are not assigned to quality improvement.
Authors’ contributions
All authors made significant contributions to the work reported, whether in the conception, study design, execution, acquisition of data, analysis and interpretation, or in all these areas. They participated in drafting, revising or critically reviewing the article, gave final approval of the version to be published, agreed on the journal to which the article was submitted, and agreed to be accountable for all aspects of the work.
Funding
The authors disclosed receipt of the following financial support for the research, authorship, and publication of this article: This work was supported by the Sanming Project of Medicine in Shenzen Municipality, (grant number No.SZSM202311002).
Declaration of conflicting interests
The authors declared no potential conflicts of interest with respect to the research, authorship, and publication of this article.
Data availability
The datasets used and analyzed during the current study are available from the corresponding author on reasonable request.
Supplemental material
Supplemental material for this article is available online.
References
Supplementary Material
Please find the following supplemental material available below.
For Open Access articles published under a Creative Commons License, all supplemental material carries the same license as the article it is associated with.
For non-Open Access articles published, all supplemental material carries a non-exclusive license, and permission requests for re-use of supplemental material or any part of supplemental material shall be sent directly to the copyright owner as specified in the copyright notice associated with the article.