
Abstract
Objective
This study investigates the effect of data breach incidents on IT investment at neighboring hospitals.
Methods
Hospital data are collected from the California Department of Health Care Access and Information and matched with the breach archive provided by the U.S. Department of Health and Human Services Office for Civil Rights to construct a set of breached hospitals. Using a community detection algorithm, neighborhoods of hospitals are constructed to serve as the treatment group of breached hospitals against unaffected hospitals. To control for potential differences between affected and unaffected communities, hospitals are matched using propensity score matching. Subsequently, the effect of data breach incidents on IT investment at neighboring hospitals is estimated using a difference-in-differences model.
Results
Analysis of hospital financial data from 2011 to 2017 revealed that neighboring hospitals responded to hacking/IT data breaches with a statistically significant 51% increase (p < 0.05) in IT capital investment in the year following exposure to the breach event. This association was substantially magnified in hospitals with above-median net income, demonstrating a 163% (p < 0.01) increase in IT capital expenditure. However, hospitals with lower net income showed no significant change in IT capital investment. Notably, we observed no statistically significant changes in overall IT expenditure or IT labor costs across any hospital category. Geographically, hacking/IT incidents predominantly occurred in major urban areas where market concentration was lower (HHI of 1243 in treatment groups vs. 1961 in control groups).
Conclusion
Data breaches involving hacking/IT incidents at a neighboring hospital could nudge a hospital toward increased IT capital investment. This may result from neighboring hospitals acknowledging the need to take preventive measures. Hospitals should be strategically encouraged to reinforce cybersecurity capacity to minimize loss from future attacks.
Keywords
Introduction
The extensive use of electronically protected health information (PHI) has rendered healthcare providers vulnerable to data breaches. The annual number of healthcare data breaches of 500 or more records exhibited an upward trend, reaching 642 incidents in 2020, a threefold increase from 2010. 1 The Breach Notification Rule under the Health Insurance Portability and Accountability Act defines a data breach as an “impermissible use or disclosure under the Privacy Rule that compromises the security or privacy of the protected health information”. 2 Approximately 270 million healthcare records are known to have been lost, exposed, or disclosed due to the 3705 data breach incidents between 2009 and 2020. Floyd et al. 3 predicted that the high value of personally identifiable information and PHI would continue to motivate attackers to target healthcare providers. 3
In the event of a data breach regarding personal health information, healthcare providers must provide notification to affected individuals, the Secretary of Health and Human Services (HHS), and the media (when necessary). 2 Furthermore, the provider may face a penalty and may open itself up to cases of civil litigation by affected patients, amounting to non-negligible operational costs. 4 Recently, the spike in data breach incidents in both healthcare and non-healthcare sectors following the COVID-19 pandemic has motivated the administration and Congress to advocate for increased governmental involvement in cybersecurity. 5
While data breaches in healthcare have been widely documented in terms of frequency and scope,6–9 relatively few studies have conceptualized them as organizational learning triggers within interconnected systems. Prior work has primarily examined breach responses from an internal risk management or compliance perspective,10,11 with limited attention to how breaches at one institution may signal risk to others. Theoretical frameworks such as institutional theory 12 and observational learning 13 suggest that organizations often adapt their behavior by monitoring peer experiences—especially when facing uncertainty or high reputational risk. In the healthcare context, where hospitals operate within dense patient-sharing networks, 14 such peer-driven responses to external events may be especially salient.
Building on this conceptual foundation, recent literature underscores the growing urgency for hospitals to invest in cybersecurity and IT infrastructure. Ahouanmenou et al. 15 conducted a systematic review of hospital cybersecurity studies aligned with National Institute of Standards and Technology (NIST) and ISO 27001 frameworks, revealing that hospitals emphasize technical protections, such as access control and identity management, while paying less attention to management practices, policies, processes, and organizational culture. 15 Similarly, Ewoh and Vartiainen reviewed vulnerabilities in U.S. healthcare systems and identified sociotechnical risks, such as outdated infrastructure, rapid digitalization, and limited investment in human factors, as key contributors to data breach exposure. 16
Organizational responses to data breaches have also been the focus of recent reviews. Nemec Zlatolas et al. highlighted a growing interest in advanced technologies, such as blockchain and artificial intelligence, for breach prevention, alongside traditional defenses like encryption and access control. 17
Healthcare leaders are actively investing in IT security to address these risks. According to the 2024 HIMSS Healthcare Cybersecurity Survey, about 55% of healthcare cybersecurity professionals anticipated an increase in cybersecurity budgets in 2025, while only 4% expected a decrease. 18 Many hospitals are also adopting more sophisticated frameworks, such as zero-trust architecture, to contain threats and limit the potential spread of breaches. A zero-trust approach verifies every user and device while segmenting network access. This strategy significantly limits malicious actors from lateral movement within the system and helps isolate compromised endpoints. 19
Emerging technologies are also being piloted to strengthen hospital cybersecurity further. Blockchain-based patient record systems aim at improving secure data sharing and record integrity. 20 In addition, the U.S. Department of Health and Human Services launched the ARPA-H “UPGRADE” program, a $50 million initiative to develop an autonomous cybersecurity suite that can detect and respond to threats in real time. 21
Looking ahead, hospitals are preparing for quantum threats by following the NIST 2024 release of post-quantum cryptography algorithms. The American Hospital Association encourages institutions to establish quantum-readiness roadmaps and begin migration planning. 22
Data breaches can be particularly threatening to healthcare providers, considering how such institutions control a large volume of protected health data rich with personal information. Remedial actions ordered by the Office for Civil Rights (OCR) after a breach, such as implementing new systems and security applications, are realized in increased health information technology spending following a data breach at a given hospital. 10 However, these remediation efforts may introduce usability challenges and unintended side effects, disrupting patient care and, thus, hospital quality. 11
Healthcare institutions near a breached institution can glean valuable lessons on preempting a similar breach within their organization. Such learning is particularly pertinent when estimating the scale and severity of potential threats. Evidence from interviews of chief information officers, chief information security officers, and healthcare cybersecurity experts at hospitals suggests that hospital management is aware of and constantly threatened by successful cybercriminal exploits and the following repercussions at other hospitals. 23 Interviews suggested that management is welcoming to strategies that reinforce cybersecurity capacities. As data breach incidents are publicized via the HHS and the media, we assumed that data breaches are public information to some extent and further suggest that this information is likely to affect hospital operators within a neighborhood of shared patients.
This study investigates the effect of data breach incidents on IT investment at neighboring hospitals. Moving beyond prior research that primarily focused on the direct consequences for breached hospitals, we explore how hospitals adjust their IT investments in response to a neighbor's breach. Utilizing hospital financial data from California from 2011 to 2017, we employ a robust methodology. This includes constructing hospital neighborhoods using a community detection algorithm (CDA) based on patient flow data and controlling for potential biases through propensity score matching (PSM). The effect on IT investment is then estimated using a difference-in-differences model.
Motivation
Understanding how hospitals respond to a neighbor's breach is increasingly important in today's healthcare environment. While prior studies have focused on the consequences of a breach for the affected hospital, less attention has been paid to the spillover effects on neighboring facilities. We define spillover effects as the indirect consequences of a breach at one hospital on the IT investment behavior of its neighbors. Neighboring hospitals have facilities operating within the same community, defined by networks of shared patients. These networks, identified using patient flow data that captures where patients seek care, represent markets where hospitals serve overlapping populations.
Although studies such as Choi et al. 10 and Choi et al. 11 have established how hospitals respond internally to data breaches through remedial IT investment, these works do not explore how such incidents influence the behavior of external, nonbreached hospitals. This oversight is significant given the visibility of breach incidents and the shared operational environments across hospital networks.14,23 To our knowledge, there is no empirical research examining whether hospitals learn from or respond to breaches experienced by neighboring institutions.
More broadly, prior work on cybersecurity responses has often been siloed at the organizational level, neglecting how interorganizational dynamics shape cybersecurity behavior. For example, Anderson and Moore 24 and Gordon et al. 25 examine cybersecurity investment from an economic or decision-theoretic standpoint but do not account for behavioral contagion effects. Similarly, while Kwon and Johnson 26 highlight organizational learning from internal incidents, the notion of learning from external peers remains underdeveloped in the empirical literature.
A distinct and underexplored literature gap exists in understanding the drivers of proactive cybersecurity investment in the healthcare sector, particularly concerning spillovers.
Studies from other sectors have identified breach-related spillover effects. For instance, the financial impact of a cyberattack spreads to peer firms and suppliers, causing them to increase cash reserves as a precautionary measure. 27 The retail sector has demonstrated a reputational contagion effect, as seen with the 2013 Target data breach, which negatively impacted competing retailers’ stock prices. 28 The study noted that managers can use strategic factors like IT and marketing to help protect their firms from this type of spillover.
A study identified a unique patient-centric spillover effect from a ransomware attack on a healthcare delivery organization. The attack led to an increase in cardiac arrest cases at nearby, unaffected hospitals, with decreased survival rates likely due to ambulance diversions and longer transport times. These findings highlight how a single cyberattack can disrupt an entire regional healthcare system. 29
Given the increasing digital interdependence of health systems and the public availability of breach data (e.g., via the HHS Breach Portal), it is plausible that hospitals monitor breaches at peer institutions and adjust their strategies accordingly. Such observational responses align with institutional theory 12 and observational learning theory, 13 both of which emphasize how organizations mimic others under uncertainty or threat. By identifying this gap, our study adds to the literature by investigating the external effects of breach events within interconnected hospital systems.
With the rise in publicly available breach information and the growing interconnectedness of hospitals through shared patients, there is a timely need to investigate how hospitals learn from each other in response to cyber threats. The present study contributes to this emerging field by quantifying the relationship between data breaches at one hospital and subsequent IT investment at its neighbors—offering a new dimension of analysis beyond individual institutional responses.
Furthermore, an existing body of empirical evidence supports a correlation between a healthcare provider's investment in health IT and their subsequent hospital productivity and the quality of care delivered.30–33 Given these findings, it is worth examining the impact of specific exogenous events, such as data breaches, on the investment decisions of hospitals. This investigation could yield meaningful insights, particularly in terms of understanding the implications that follow a data breach incident at a healthcare provider.
In sum, we examined the impact of a data breach incident at a given hospital on the IT investment behavior of neighboring hospitals. We posit that this indirect effect may be more consequential than the direct impact of a data breach on the victim hospital's IT investments. The rationale behind this lies in the heightened awareness that a data breach in proximity can generate, alerting nearby hospitals to potential threats. This amplified vigilance could expedite the implementation of preventive measures to address existing vulnerabilities before cybercriminals can exploit them. Consequently, this can benefit neighboring healthcare institutions and the wider healthcare sector.
Materials and methods
Empirical model
This study primarily focuses on changes in the IT investment of hospitals following the initial data breach incident at a neighboring hospital. This association is investigated using a generalized difference-in-differences (DID) model, often utilized in event studies that evaluate the effects of changes in healthcare policy.10,11,34 Using reported breach data disclosed by the HHS OCR and patient flow data, groups of hospitals corresponding to each breach occurring at a hospital are constructed. Changes in operational behavior for relevant neighboring hospitals are assessed by investigating hospital financial data.
A change in IT investment induced by a data breach at a neighboring hospital is estimated using a conventional two-way fixed effects panel regression model (equation (1)) as follows:

The following hospital characteristics are included in
In equation (1), the existence of hospitals with multiple neighboring breaches poses a challenge in identifying the effect of a single breach event. On one extreme, one could assume that the first breach in the vicinity could incur a change in investment behavior that would last throughout the period of interest. On the other extreme, one could speculate that every additional breach in the vicinity affects the IT investment decision at a neighboring hospital. Although reality would most likely lie between the two extremes above, there is a loss of information in presuming a single identification method. Therefore, this study minimized the possibility of misspecification by focusing on the initial breach that occurred in the neighborhood. In practice, the hospital-year observations from which hospitals are exposed to second or third breaches were removed, and thus, estimations relevant only to the initial breach were generated.
The validity of the causal claim of the DID model rests on the crucial “parallel trends” assumption, that is, in the absence of a neighboring data breach, the IT investment trends of our treatment and control hospitals would have remained parallel. This key assumption is empirically supported by our event study analysis (see Tables 2–4). The statistically insignificant coefficients for these prebreach periods indicate no preexisting differential trends between the groups, strengthening the validity of our model.
Community detection
By uncovering the community structure based on patient flow data via a CDA, we defined the set of neighboring hospitals to which a given hospital belongs. A strong stream of literature in health services research suggests that CDAs perform significantly well in defining hospital groups in terms of model flexibility and validity, hence offering a better tool to assess the behavior and dynamics of groups of hospitals.35–37 Specifically, the Louvain algorithm, often used in identifying healthcare provider communities, is applied in this study.36–38 Further, an often-used measure of the strength of generated communities—the modularity score a (equation (2))—was used to assess the validity of the generated community structure. Using the said algorithm, we identified 17 communities to which our set of hospitals were assigned.
Propensity score matching
Another issue that required attention was the disproportionately frequent occurrence of data breaches in urban areas. This may simply be a matter of the concentration of hospitals in urban areas. At the same time, hospitals in urban areas may also be assumed to have different characteristics from those in suburban or rural areas. Because the identification strategy of this study intends to exploit the difference between hospitals within the community of a breached hospital and hospitals that have never been exposed to breaches (both themselves and at neighboring hospitals), the location of breach events may incur treatment-selection bias in the investigation of the association between said events and IT investment.
Therefore, we applied the PSM method to identify matches of peer hospitals between those assumed to be affected by breaches in neighboring hospitals (treatment group) and those that have never been exposed to breaches to any extent (control group). As we intend to estimate changes in IT investment after a neighboring breach, the hospitals in the treatment group were matched based on relevant pretreatment hospital characteristics. Specifically for hospitals in the treatment group, we used hospital-year observations corresponding to three years before exposure to neighboring breaches to remove the possibility of breaches affecting their operational behavior. We applied one-to-one nearest neighbor matching without replacement to match hospital-year observations that are closest in propensity scores. After pairs of hospital-years were generated, comparisons between the two hospitals over the time frame of interest were evaluated. We assessed the performance of the propensity score model by investigating changes in standardized mean differences (or standardized bias) and variance ratios in the treatment and control group hospitals before and after PSM.38–41 The final sample of hospitals used in the analysis satisfies the guidelines of balance suggested in previous studies.
Data
Two datasets were utilized in this study. First, hospital characteristics and financial data from 2011 to 2017 were extracted from the hospital financial disclosure reports made available by the California Department of Health Care Access and Information (HCAI). The HCAI also publishes each hospital's patient origin data for each year, which is used in community detection. Second, data breach reports corresponding to healthcare providers in California were obtained from the U.S. HHS OCR.
Health Care Access and Information data
Hospital Annual Disclosure Report data provides hospital characteristics and a rich set of desk-audited data on hospital finances, including full reports of balance sheets, statements of changes in equity, income statements, statements of cash flows, revenues, expenses, cost allocation statistics, calculations, labor hours, and hourly rates.
The subjects of this study included general acute care hospitals with 100 or more licensed beds from 2011 to 2017. Hospitals with fewer than 100 beds were excluded because the financial statements of smaller hospitals omitted key data elements required for estimation. Noncomparable reports (e.g., Kaiser hospitals or state hospitals) as specified by HCAI were excluded from the study sample. For data consistency, reports that covered less than 365 days were excluded. Furthermore, for hospitals that experienced data breach incidents, hospital-year observations after the year of the breach were excluded from the study sample. The final set of hospitals is comprised of 1317 hospital-year observations of 234 unique hospitals over the period of 7 years. Hospitals in the control group—those hypothesized to have no association with data breaches—total 852 hospital-year observations (64.7%), while those in the treatment group total 465 (35.3%) hospital-year observations.
To construct sets of neighboring hospitals for each given hospital, patient flow data from the HCAI were utilized. The ‘patient origin/market share dataset’ provides information on what area a facility's patients come from and where patients from a certain ZIP code area go for hospital treatment. For this study, the total number of inpatient discharges for a given area was used to assess the association of hospital utilization between two ZIP code areas. One caveat was that the patient flow data published by HCAI reports are only available from 2012.
Data breach reports
Pursuant to the HITECH Act, the Secretary of Health and Human Services is obligated to post a list of breaches of unsecured PHI affecting 500 or more individuals. We used this data to construct a database of breaches that had occurred at healthcare providers in California. Afterward, the reported data breach incidents were manually matched to the HCAI hospital database using the hospital name, address, and geographical coordinates.
Data breach incidents classified as ‘hacking/IT incidents’ were selectively used in the analysis. Hacking/IT incidents corresponding to the HCAI hospital dataset totaled 13 cases from 2009 to 2017, affecting over 4.8 million individuals. Of the 13 cases, three occurred in 2014, 1 in 2015, 4 in 2016, and 5 in 2017. No recorded hacking/IT incidents corresponded to the hospital database before 2014.
It should be noted that the database of data breach reports may not reflect the actual number of breaches that have occurred; breaches before October 2009, the founding of the OCR breach archive, and breaches affecting less than 500 individuals are not accounted for in this study. The omission of these incidents may incur bias in the subsequent estimates. However, considering that hacking/IT incidents rapidly rose after 2016 and hospitals were less equipped with IT infrastructure vulnerable to breaches in the early 2000s, we assume that the breaches in this data set were the initial exposures of hospitals to hacking incidents. Moreover, this study disregards the possibility that small, unreported breaches could significantly impact the investment behavior of neighboring hospitals.
Results
Descriptive statistics
The occurrence of data breaches by year and area is plotted in Figure 1. One noticeable point is that almost all hacking/IT incidents occurred in major urban areas, calling for adjustments for the potential discrepancy in hospital operations induced by geographical characteristics.

Hacking/IT incidents in California (2007–2017).
Descriptive statistics of hospital characteristics and financial data are reported in Table 1. From 2011 to 2017, the mean annual revenue of general acute care hospitals with more than 100 licensed beds was $267.65 million for the control group and $276.98 million for the treatment group. The mean value of total annual assets was $374.28 million and $357.89 million in the respective groups, and that of total labor input, composed of salaries, wages, employee benefits, and professional fees for all personnel, was $168.31 million and $178.75 million. The mean annual cost of IT capital adoption is $7.02 million for the control group and $7.46 million for the treatment group, and labor expenditures in IT were $2.94 million and $3.49 million in the respective groups, though, for both variables of both groups, distributions are severely skewed.
Descriptive summary of treatment and control hospitals.
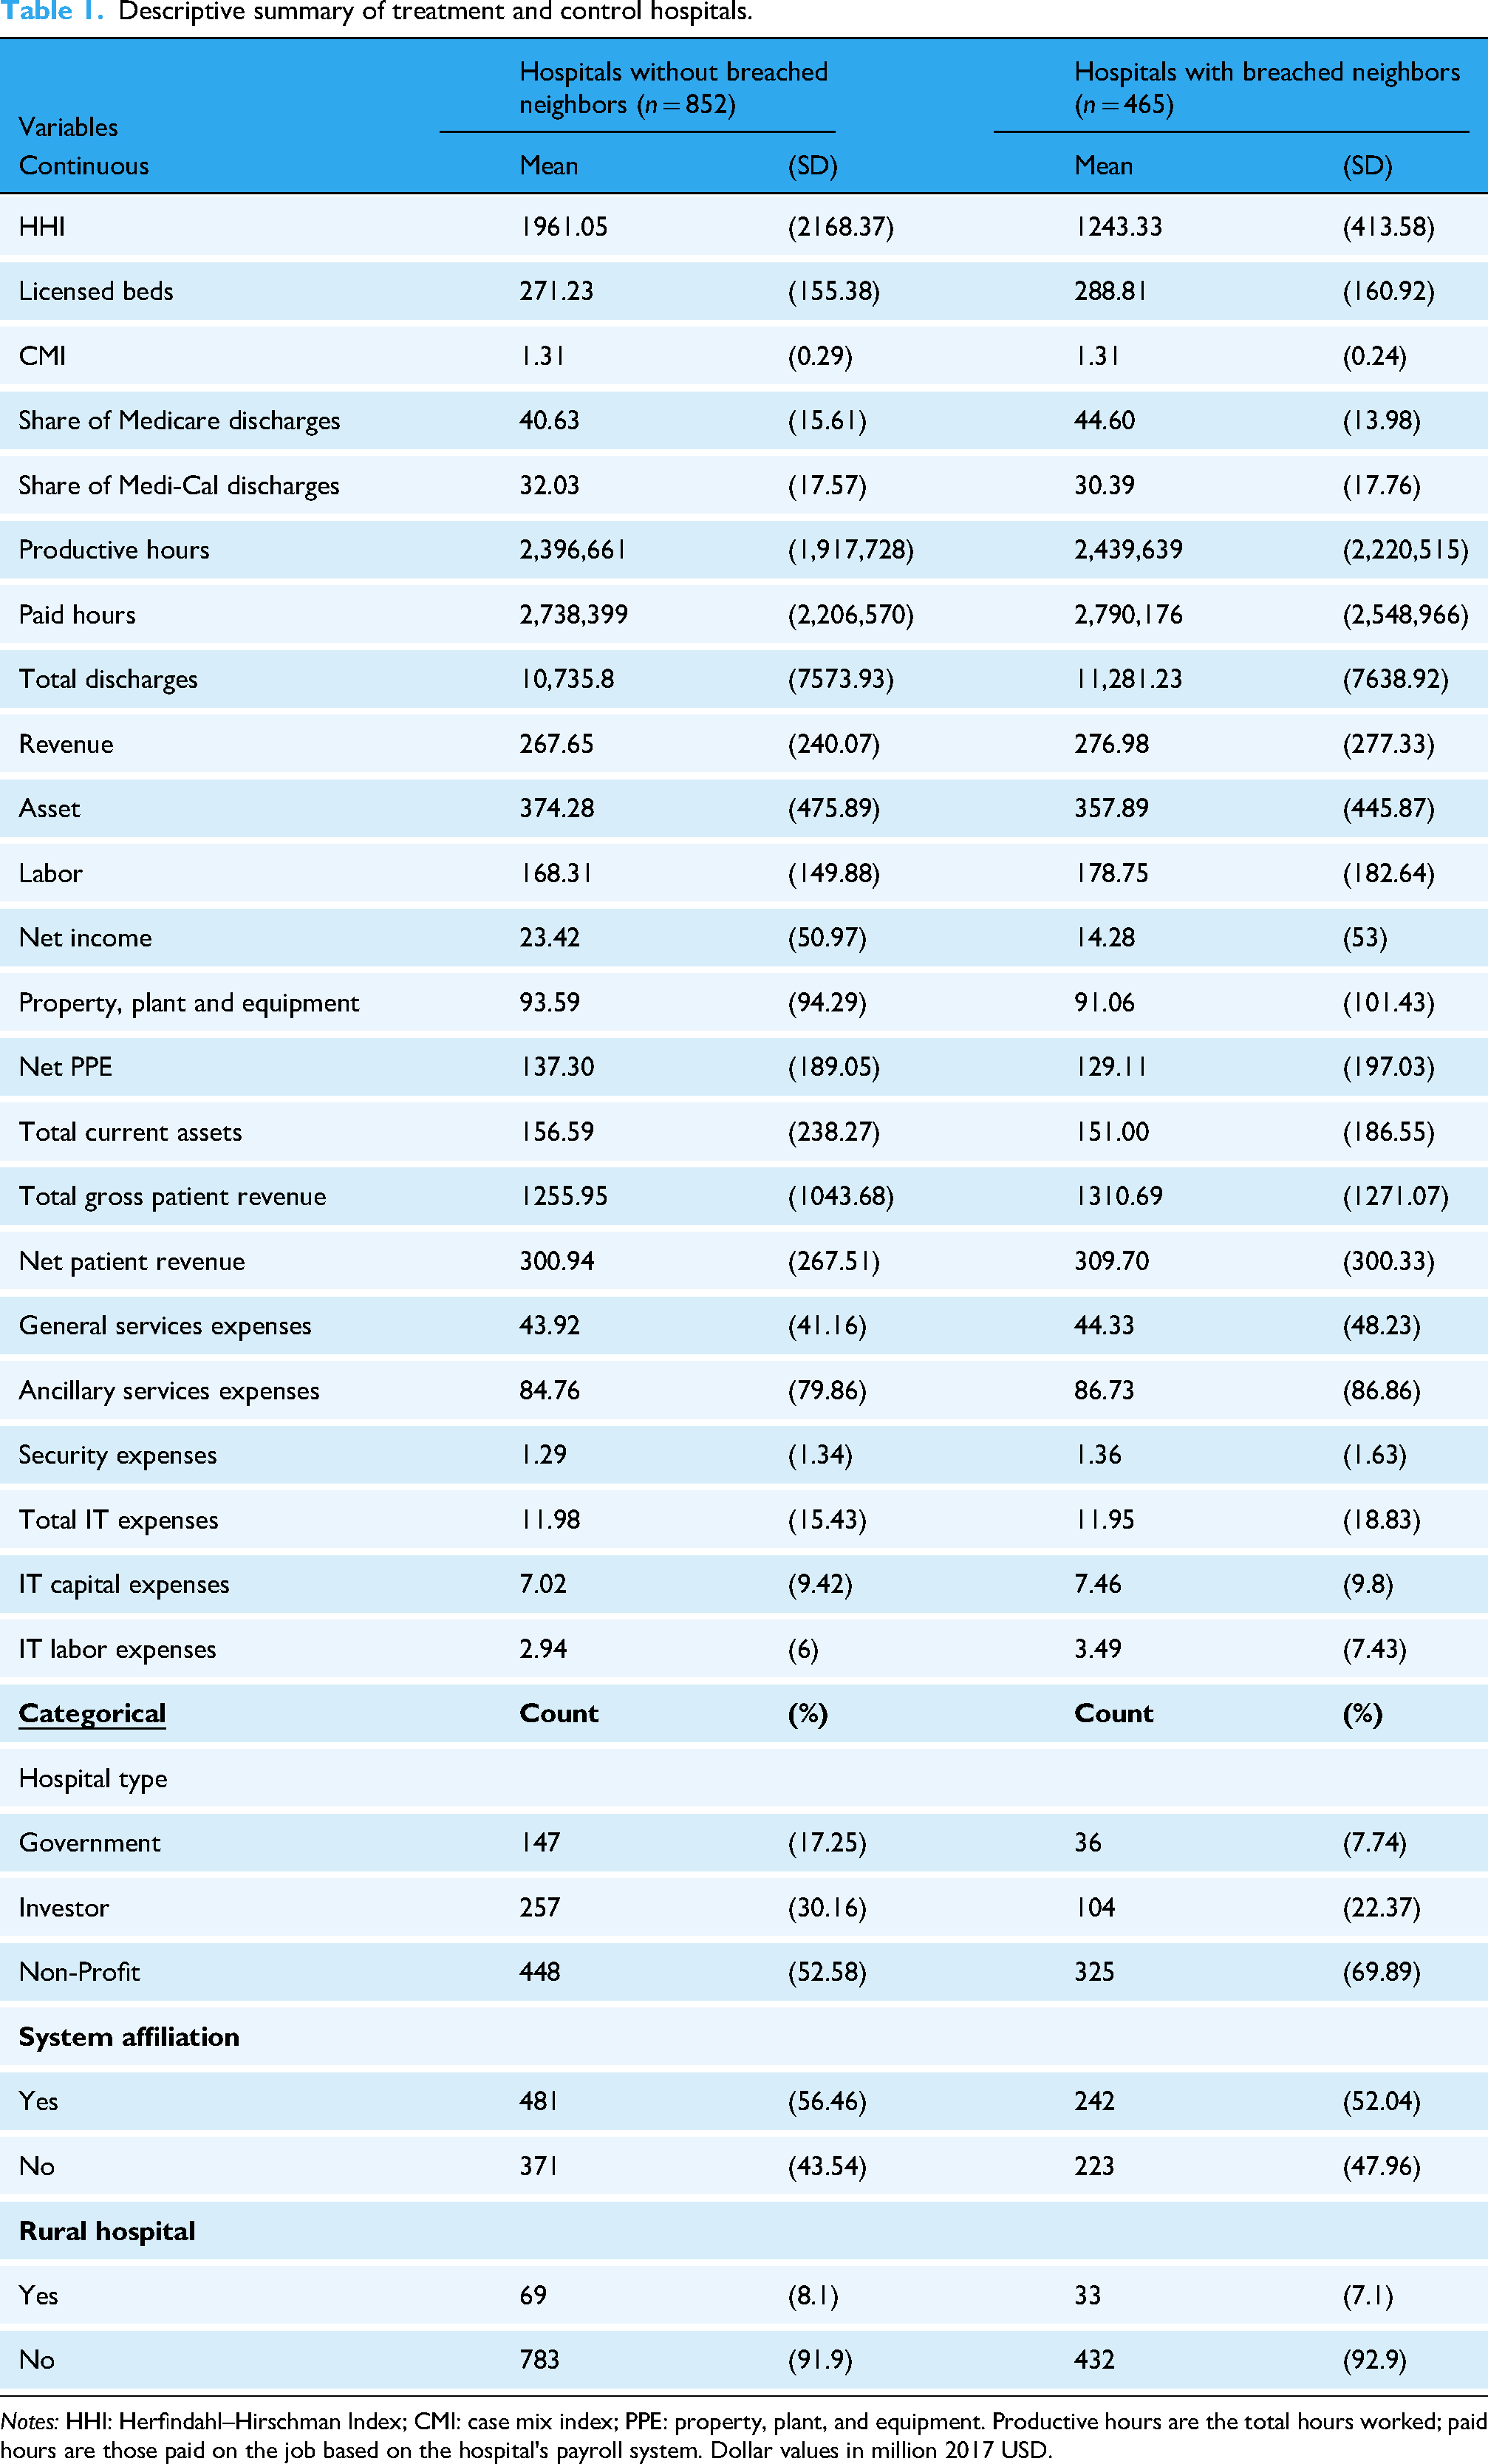
Notes: HHI: Herfindahl–Hirschman Index; CMI: case mix index; PPE: property, plant, and equipment. Productive hours are the total hours worked; paid hours are those paid on the job based on the hospital's payroll system. Dollar values in million 2017 USD.
The average case mix index of hospitals in both groups was tied at 1.31, and hospitals in the treatment group are slightly larger, with approximately 290 licensed beds compared to the control group's 270. On average, 40–45% of hospital discharges were Medicare enrollees, and approximately 32% were Medi-Cal enrollees. One parameter indicative of the geographical differences between the treatment and control groups is HHI. While the average HHI is approximately 1961 in the control group, the average HHI of the treatment group is 1,243, suggesting that the treatment group has a less concentrated market. This is further accentuated by the distinct difference in proportions of nonprofit, for-profit, or government-controlled organizations constituting the two groups. Total discharges per year are slightly higher for hospitals in the treatment group, at approximately 11,300 discharges compared to 10,700 discharges at hospitals in the control group.
Regression results
Regression results are reported in Tables 2–4 b and plotted in Figures 2–4. To address the concern that hospitals with fewer resources may not possess the capacity to respond to breaches by increasing investment, we divided the sample of hospitals by mean net income and estimated the panel regression model (equation (1)). Hence, the column heading (1) All hospitals of Tables 2–4 and the panel (A) of Figures 2–4 used all hospitals in the propensity score matched sample, the column heading (2) Upper 50% and the panel (B) used hospitals with average net income in the upper 50%, and column heading (3) Lower 50% and panel (C) used hospitals with average net income in the lower 50%. This classification allowed for testing the proposition that hospitals may choose to invest in IT only when they retain sufficient resources.

Event study plots on total IT expenditure, by average net income.

Event study plots on IT capital expenditure, by average net income.

Event study plots on IT labor expenditure, by net income.
Panel event study results on total IT expenditure, by average net income.
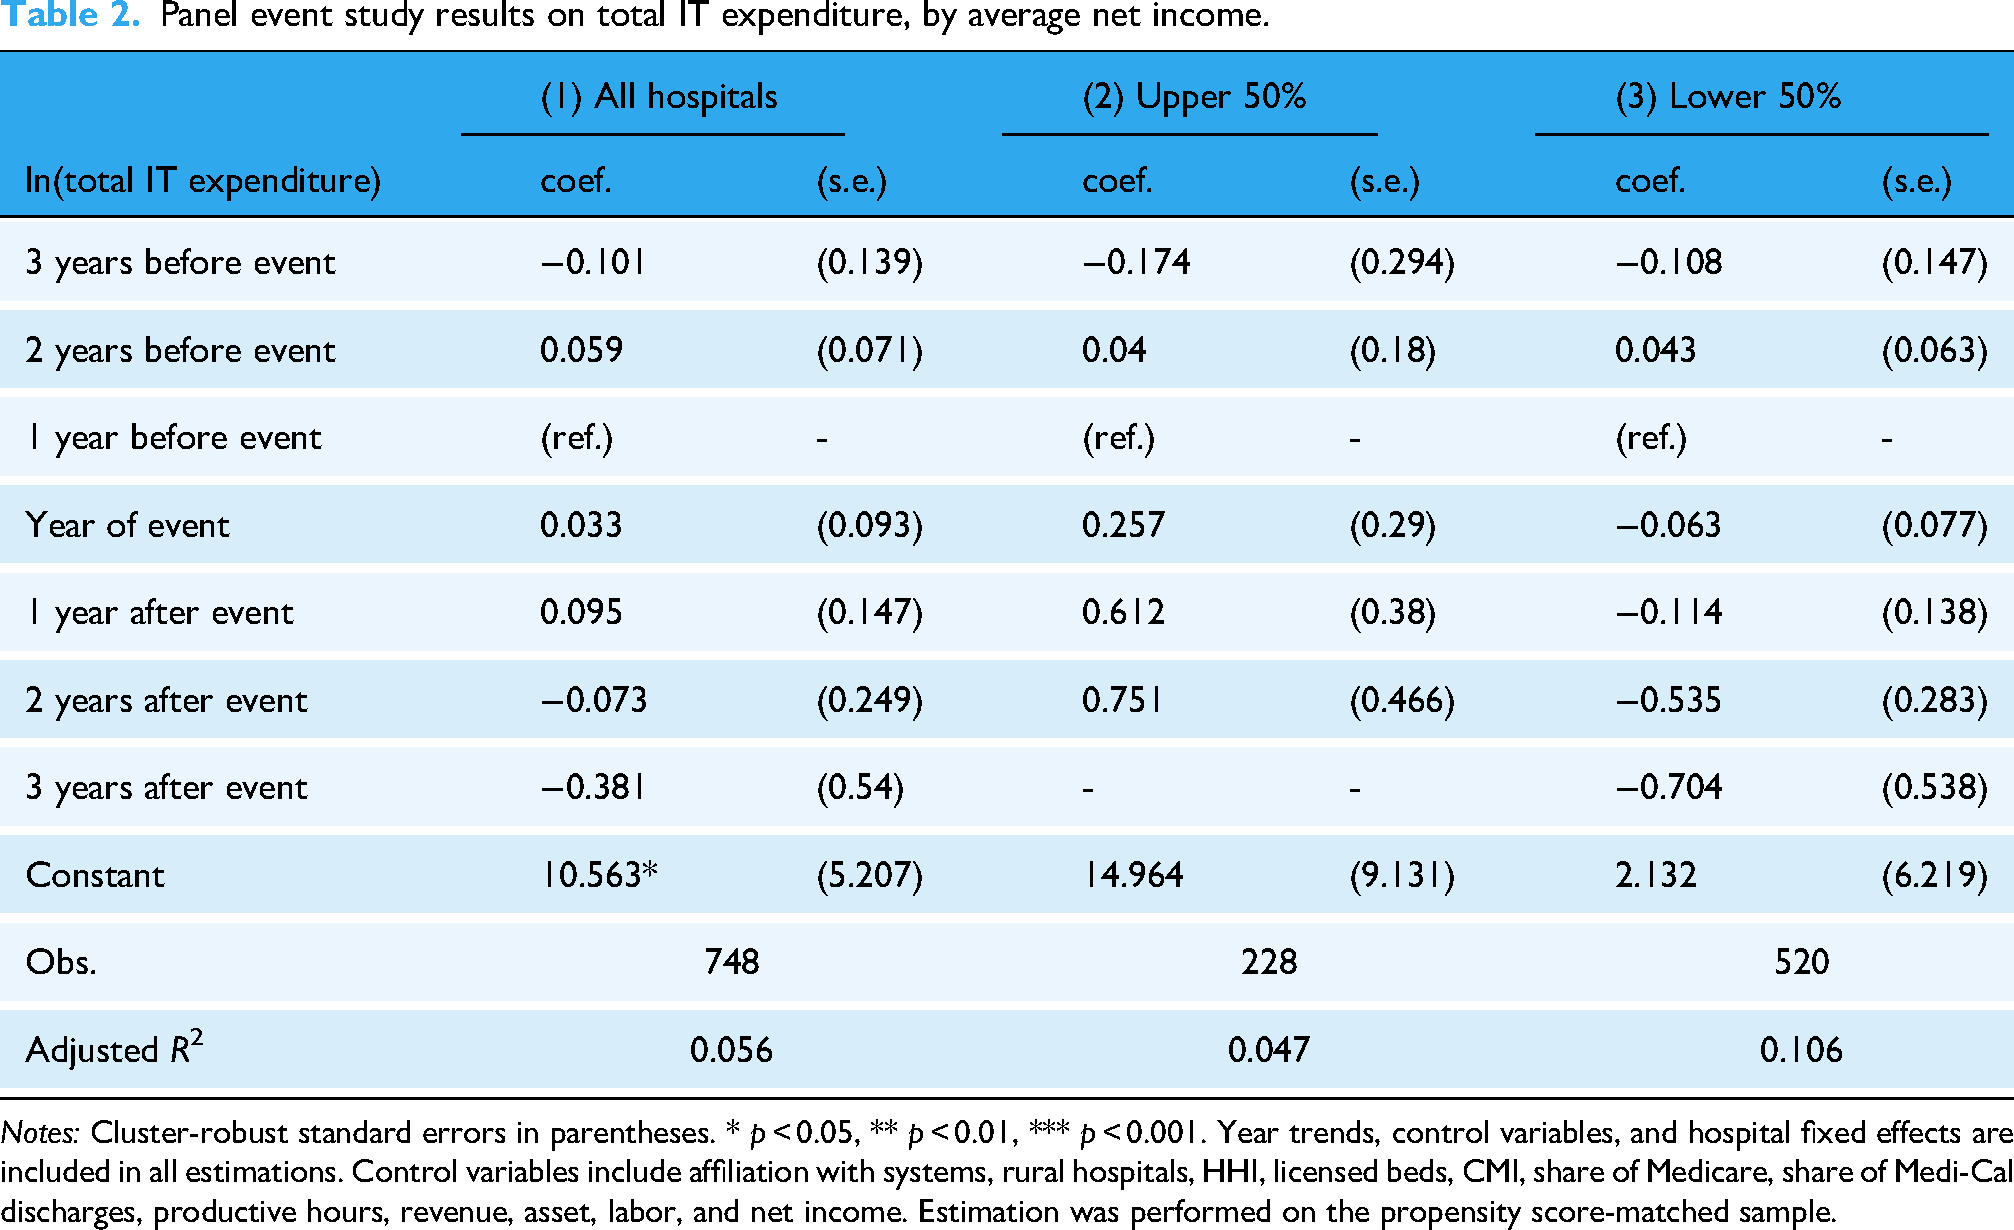
Notes: Cluster-robust standard errors in parentheses. * p < 0.05, ** p < 0.01, *** p < 0.001. Year trends, control variables, and hospital fixed effects are included in all estimations. Control variables include affiliation with systems, rural hospitals, HHI, licensed beds, CMI, share of Medicare, share of Medi-Cal discharges, productive hours, revenue, asset, labor, and net income. Estimation was performed on the propensity score-matched sample.
Panel event study results on IT capital expenditure, by average net income.

Notes: Cluster-robust standard errors in parentheses. * p < 0.05, ** p < 0.01, *** p < 0.001. Year trends, control variables, and hospital fixed effects are included in all estimations. Control variables include affiliation with systems, rural hospitals, HHI, licensed beds, CMI, share of Medicare, share of Medi-Cal discharges, productive hours, revenue, asset, labor, and net income. Estimation was performed on the propensity score matched sample.
Panel event study results on IT labor expenditure, by average net income.

Notes: Cluster-robust standard errors in parentheses. * p < 0.05, ** p < 0.01, *** p < 0.001. Year trends, control variables, and hospital fixed effects are included in all estimations. Control variables include affiliation with systems, rural hospitals, HHI, licensed beds, CMI, share of Medicare, share of Medi-Cal discharges, productive hours, revenue, asset, labor, and net income. Estimation was performed on the propensity score matched sample.
For Tables 2–4, the coefficients refer to the estimated effect of a neighboring breach with respect to years before and after the year of the initial breach at a neighboring hospital. To capture the increase in investment in the same year of a neighboring breach, the reference year (base period) was set at one year before the exposure to a neighboring breach. The coefficients thus capture the difference between hospitals in the treatment group and the control group, adjusting for the difference between the two groups in the reference year. 42 The log-transformed dependent variable allows us to interpret the exponentiated coefficient as percentage changes in IT investments.
Table 2 displays DID estimates for total IT expenditure. While the signs of the estimates for the impact of a neighbor's breach in relatively well-off hospitals were different, Upper 50% compared to Lower 50%, the difference was not statistically significant. However, Table 3 showed that a neighbor's breach was associated with an approximately 51.13% (exp(0.413) = 1.511) increase in IT capital expenditure one year after the breach.
This relationship was accentuated in the cases of hospitals with higher average net income (Table 3), where the increase in IT capital expenditure was 163.28% (exp(0.968) = 2.633) one year after the breach. This is distinguishable from the case of hospitals with lower net income, where capital expenditures showed no significant change. Regarding IT labor expenditures, although the signs of the DID coefficients were consistently negative across all specifications; there was no evidence of any significant change following a breach at a neighboring hospital.
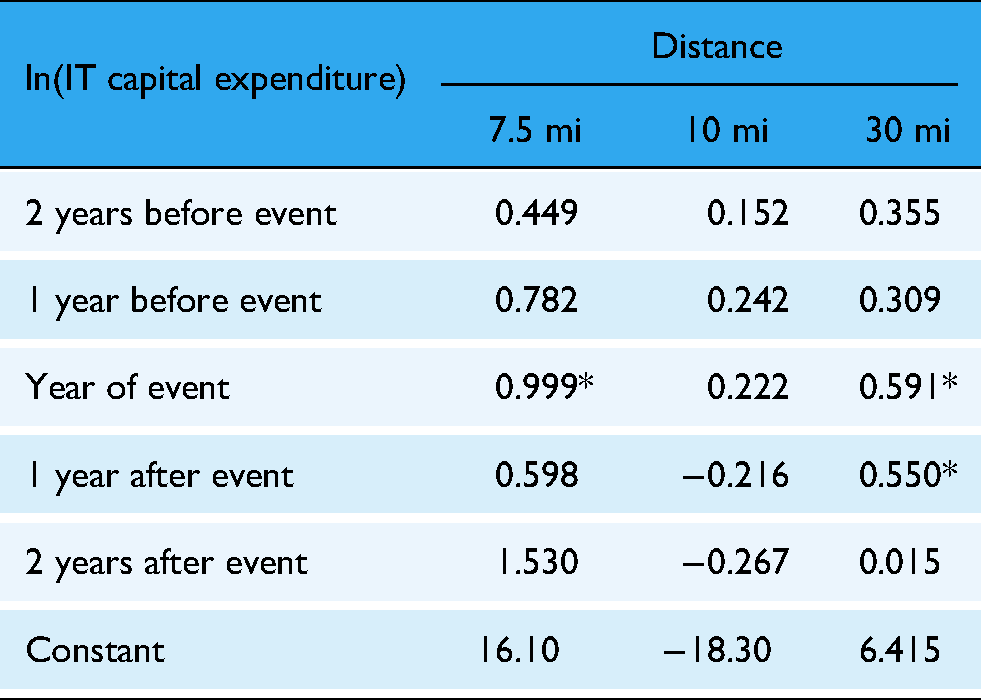
To assess the sensitivity of our estimates to the definition of neighborhood, we reestimated the baseline model using alternative specifications of hospital proximity, such as fixed-distance radii (7.5, 10, and 30 miles) (see Appendix 2). The key finding remains statistically significant across most specifications, thereby supporting the robustness of our results.
Discussion
As hospital data breaches involving hacking increase, hospitals seem to have a clear incentive to invest further in their health IT infrastructure and personnel. We discovered that data breaches involving hacking/IT incidents at a neighboring hospital could nudge a hospital toward increased IT capital investment. This relationship varied by the hospital's financial status, as poorer hospitals’ IT capital investments were not sensitive to a neighbor's breach. In this sense, one may suggest that investing in IT—as much as hospitals may wish to be responsive to potential attacks—is put off when a hospital lacks financial resources.
While several studies have highlighted the positive aspects of IT investment for providers and patients, few studies exist on how a provider chooses to make this investment. Indeed, as in Choi et al., 10 hospitals that experienced a data breach incident decided to make this investment, perhaps as part of a remedial effort to prevent further incidents. 10 Building on this literature, we showed that breach incidents are associated with increased health IT capital investment in neighboring hospitals. It is plausible to suggest that this results from neighboring hospitals acknowledging the need to take preventive measures against data breaches.
Nevertheless, other specifications do not support positive findings of increased IT capital expenditures, as overall IT expenditures or spending on IT personnel showed no significant response to neighboring breaches. This suggests that the observed increase in IT capital investment may be a targeted and selective response, rather than a broad-based shift in IT spending strategy. Specifically, while capital investment (e.g., equipment and infrastructure) increased significantly after a neighboring hospital experienced a breach, there was no corresponding rise in IT labor expenditures (such as staffing, salaries, and benefits). This divergence implies that hospitals may prioritize technological upgrades over workforce expansion when addressing cybersecurity threats.
One potential explanation for this pattern lies in the substitution effect between IT capital and IT labor, as proposed in prior studies.43,44 The contrasting signs in estimates for capital and labor expenditures support the hypothesis that hospitals may view capital solutions (e.g., automation, security software) as effective replacements for additional personnel. Yet this explanation remains empirically inconclusive in our findings and warrants further study.
This dynamic is further complicated by ongoing labor market constraints in the U.S., particularly in the technology sector. According to the 2024 ManpowerGroup Talent Shortage Report, 73% of employers report difficulty hiring qualified workers, with IT roles among the hardest to fill. Additionally, the U.S. labor force participation rate remains at 62.6% as of April 2025, below pre-pandemic levels (Bureau of Labor Statistics). These shortages may limit hospitals’ ability to scale up cybersecurity teams, even when they recognize the need to do so.
Furthermore, the findings likely reflect internal budgeting processes and external labor market constraints of hospitals. From a budgeting perspective, one-time capital expenditures are often easier to approve and fund from capital reserves than increases to operational budgets, which must account for the long-term costs of salaries, benefits, and training. This is compounded by a highly competitive labor market for cybersecurity professionals. Therefore, even if a hospital identifies a need for more staff, the ability to recruit and onboard qualified personnel quickly is limited. The decision to invest in capital may therefore be as much a reflection of these constraints as it is a strategic preference.
While the analysis relies on data concluding in 2017, the trends identified provide a highly relevant perspective on present-day cybersecurity investment behavior in the healthcare sector. This study identifies a spillover effect driving increased IT capital investment in response to a neighbor's data breach. Given that the frequency, scale, and financial impact of cyberattacks on healthcare have intensified dramatically since 2017, it is plausible that this pattern of observational learning and reactive investment has not only persisted but has become even more pronounced.
Furthermore, our finding that hospitals selectively increased capital spending without a corresponding rise in labor expenditures is a dynamic that resonates strongly with current market conditions. As noted in the 2024 HIMSS Healthcare Cybersecurity Survey, a majority of healthcare organizations continue to plan for increased cybersecurity budgets, indicating sustained capital allocation toward technological solutions. This capital-focused approach is likely reinforced by the recent IT talent shortages reported, which constrains the ability of hospitals to expand their internal cybersecurity workforce. Thus, while the data captures an earlier period, it offers relevant insight for interpreting how hospitals navigate the cybersecurity environment of today.
Further research is essential to determine whether capital-heavy investment strategies are effective in ensuring cybersecurity resilience or if underinvestment in labor ultimately undermines the protective capacity of hospitals. Understanding whether this pattern reflects strategic substitution or constrained decision-making will be key to guiding effective policy and organizational responses.
In particular, resource-constrained hospitals, especially those in rural areas, deserve closer attention. These institutions often operate under greater financial constraints, with many falling into the lower half of the hospital income distribution and serving populations with limited healthcare access. Such constraints may make rural hospitals less responsive to cybersecurity threats, even when nearby breaches occur. Limited budgets, under-resourced IT departments, and fewer opportunities for external partnerships can all contribute to delayed or insufficient investments in IT infrastructure. Our findings align with this pattern, suggesting that the financial barriers to IT investment are especially pronounced in resource-constrained settings. Understanding these dynamics is critical for developing policy interventions aimed at reducing cybersecurity vulnerability across geographically and economically diverse healthcare providers.
Conclusion
We demonstrate that hacking and IT data breaches at neighboring hospitals lead to increased IT capital investments, particularly among hospitals with stronger financial resources. These findings underscore the need for healthcare providers to proactively enhance their cybersecurity capacities as a defensive strategy. Despite the observed increase in IT capital expenditures, the overall IT budgets and labor investments showed no significant changes, suggesting a targeted response rather than a broad shift in IT spending priorities.
Our study also opens several promising avenues for future research. First, although this study finds evidence for the association between data breach incidents and IT capital investment at hospitals sharing patient markets, the motivation that leads hospitals to this decision is still ambiguous. Another step that could relieve this uncertainty is investigating patient awareness of hospital data breaches and whether patient awareness of data breaches affects patient preferences for hospitals. Consequently, further research into how patient utilization or hospital revenue trends change at breached hospitals and their neighbors would provide further insight into the hospital decision-making process and serve as meaningful evidence for administering public policy to foster IT investment in healthcare providers. Given that data breach reports are readily available nationwide, if sufficient provider data can be acquired, this study could be expanded nationally to observe the operational behavior of healthcare providers following a data breach. A comprehensive study of hospitals nationwide should provide an even greater volume of information on hospital operations, including state-specific differences stemming from heterogeneous state policy or the availability of EHR infrastructure.
A limitation of our study is its focus on hacking/IT incidents in California, where the relatively small number of breach events raises concerns about unobservable confounders potentially influencing our estimates. The matching procedure mitigated such potential bias in the regression estimates. A further limitation of our study is the HHS OCR breach database, which only includes publicly reported breaches affecting 500 or more individuals since October 2009. Consequently, our analysis does not account for smaller breaches or any incidents that occurred prior to this period. While we assume that the breaches in our dataset represent the most significant and often the initial hacking/IT incidents for these hospitals, we must acknowledge that the omission of smaller or unreported events could introduce bias. If hospitals also responded to minor incidents, our model might underestimate the overall frequency of investment triggers or misattribute a response to a later, larger breach.
Nonetheless, to our knowledge, this study is a novel investigation of the external repercussions of hospital data breaches. Because hospitals store comprehensive information about their patients, the value of their data likely surpasses that of other institutions, rendering them profitable targets for attackers. The growing cybersecurity threats against hospitals reflect these incentives. In this sense, the notion that hospitals should and are responding to data breach incidents at neighboring hospitals is an aspect that should be considered when assessing the consequences of said events. Hospitals should be strategically encouraged to reinforce cybersecurity capacity to minimize losses from future attacks.
Supplemental Material
sj-docx-1-dhj-10.1177_20552076251375930 - Supplemental material for The impact of data breach on IT investment at neighboring hospitals: Evidence from California Hospitals
Supplemental material, sj-docx-1-dhj-10.1177_20552076251375930 for The impact of data breach on IT investment at neighboring hospitals: Evidence from California Hospitals by Taewon Hwang, Sung J. Choi and Jinhyung Lee in DIGITAL HEALTH
Footnotes
Ethics approval
Not applicable.
Contributorship
Conceptualization: Taewon Hwang and Jinhyung Lee; Methodology: Taewon Hwang, Jinhyung Lee, and Sung J. Choi; Formal analysis and investigation: Taewon Hwang, and Jinhyung Lee; Writing—original draft preparation: Taewon Hwang; Writing—review and editing: Jinhyung Lee and Sung J. Choi; Funding acquisition: Jinhyung Lee; Resources: Jinhyung Lee; Supervision: Jinhyung Lee and Sung J. Choi.
Funding
This work was supported by the Ministry of Education of the Republic of Korea and the National Research Foundation of Korea
Declaration of conflicting interests
The authors declared no potential conflicts of interest with respect to the research, authorship, and/or publication of this article.
Data permission
The data used in our study were obtained from two publicly accessible sources: the California Department of Health Care Access and Information (HCAI) and the U.S. Department of Health and Human Services Office for Civil Rights (OCR) breach portal. They allow users to freely download and use datasets in accordance with its Terms of Use. These terms permit the use and redistribution of content, provided that users comply with relevant laws and provide appropriate attribution. Accordingly, no special permission was required or obtained for the use of these data, as both sources are intended for public use under clearly specified terms.
Supplemental Material
Supplemental material for this article is available online.
Notes
Appendix 1: Model Notation List
Appendix 2: Panel event study results on IT capital expenditure by distance
| ln(IT capital expenditure) | Distance | ||
|---|---|---|---|
| 7.5 mi | 10 mi | 30 mi | |
| 2 years before event | 0.449 | 0.152 | 0.355 |
| 1 year before event | 0.782 | 0.242 | 0.309 |
| Year of event | 0.999* | 0.222 | 0.591* |
| 1 year after event | 0.598 | −0.216 | 0.550* |
| 2 years after event | 1.530 | −0.267 | 0.015 |
| Constant | 16.10 | −18.30 | 6.415 |
References
Supplementary Material
Please find the following supplemental material available below.
For Open Access articles published under a Creative Commons License, all supplemental material carries the same license as the article it is associated with.
For non-Open Access articles published, all supplemental material carries a non-exclusive license, and permission requests for re-use of supplemental material or any part of supplemental material shall be sent directly to the copyright owner as specified in the copyright notice associated with the article.