
Abstract
Objective
With China's rapid aging and urbanization concentrating older adults in cities, urban elder care has become an urgent challenge. Smart home technologies offer support for aging in place but remain underused. This study examines the factors influencing urban elderly individuals’ willingness to use and pay for smart home services in China. It fills a critical research gap in understanding technology adoption for elderly care in the context of large-scale demographic and urban transitions.
Methods
Data was collected from 639 elderly individuals across 12 communities in China through questionnaires in 2021. The study distinguishes between willingness to use, measuring technology acceptability, and willingness to pay, reflecting cost-value perceptions. Given the ordinal nature of the five-point Likert scale responses, ordered logistic regression was employed to analyze factors from three dimensions: predisposing factors (age, gender, marital status), enabling factors (income, insurance), and demand factors (life satisfaction, hospitalization history, health conditions), with appropriate controls for sample characteristics.
Results
The empirical analysis revealed that factors such as age, life satisfaction, income, and health issues (including multiple chronic conditions such as insomnia, memory decline, and mobility problems) significantly impact older adults’ willingness to use smart home services. In this model, age showed a negative effect, with older cohorts being more conservative. In contrast, for willingness to pay, age, hospitalization history, and income were found to be significant factors, with age again associated with increased resistance among the older groups.
Conclusion
The study reveals that income capacity, health transitions, and age barriers critically determine smart home adoption among older adults. Policy implications include tailored digital literacy for older cohorts, subsidies to improve affordability, and integrating smart home consultations into hospital discharge planning. These targeted interventions can bridge the adoption gap and enable aging populations to access smart home health monitoring benefits.
Keywords
Introduction
The global population is aging at an unprecedented rate. According to the World Health Organization (WHO), by 2030, one in six people worldwide will be aged 60 or older. 1 China exemplifies this trend dramatically, with over one-fifth of its population now aged 60 or above, representing nearly 300 million elderly individuals—making it home to the world's largest aging population. 2 Life and health quality is one of the most pressing challenges for older adults in retirement. 3 Traditional health and medical systems are increasingly unable to meet the needs of this growing population. Advances in science and technology have positioned smart homes as a promising tool for elderly care.
Smart homes integrate various devices and applications through home automation, IoT connectivity, and artificial intelligence to enhance elderly individuals’ living experiences and health outcomes.4,5 These systems provide comprehensive support, including fall detection, automated lighting, smart locks, and real-time health monitoring within an Ambient Assisted Living (AAL) framework.6–12 By leveraging machine learning to analyze daily activities and offering features such as virtual assistants, smart homes create an integrated ecosystem that improves both security and quality of life for older adults.
Building on existing definitions of smart homes and the focus of this study, this paper examines smart homes designed for older adults. These include age-friendly home modifications and smart installations, such as elder-friendly bathroom and bedroom equipment, emergency call systems, and remote monitoring technologies for intelligent caregiving. In an aging society, understanding older adults’ willingness to adopt and pay for smart homes, as well as the factors influencing these decisions, is essential. Such insights can guide the adaptation of smart homes to better meet their needs, ultimately enhancing their quality of life.
In recent years, smart homes have become increasingly popular, prompting growing research into the factors influencing their adoption. These factors can be grouped into perceived factors (e.g., privacy and trust, 13 perceived usefulness and ease of use7,14), skill factors (health skills, 15 digital skills 16 ), and external factors (e.g., government guidance 17 ). Adoption willingness and its determinants vary across demographic groups, with studies focusing on young adults,18,19 middle-aged individuals over 40,16,19 and older adults.20,21 Research on older adults’ adoption of smart homes primarily examines three aspects: (1) Factors affecting technology use: Studies identify six key influences on technology adoption in elderly care—challenges in independent living, behavioral choices, personal perceptions of technology, 22 social networks (including intergenerational23,24 and cultural influences 25 ), organizational influences, and the role of the physical environment. 26 (2) Factors influencing the willingness to use (WTU): Research highlights the digital divide among older adults, 16 with perceived usefulness and ease of use positively influencing WTU, 21 while privacy concerns have a negative impact. 20 (3) Factors influencing the willingness to pay (WTP): Compatibility, perceived ease of use, usefulness,27,28 trust in technology, 22 as well as policy guidance, expert opinions, and influential social referents, 29 significantly enhance purchase willingness.
In summary, existing studies have explored the willingness of older adults to use and pay for smart homes and the influencing factors to some extent. However, there remains substantial room for further investigation. This article addresses a key gap in understanding how health-related factors influence elderly individuals’ smart home adoption decisions—an area that has been inadequately addressed in previous studies. Specifically, this article advances the field by: (1) From the perspective of influencing factors, the use and purchase of smart homes are often decisions that require consideration of health-related factors, which have not been adequately addressed in previous studies. This article will examine the factors influencing the WTU and WTP for smart homes among older adults from three aspects: predisposing factors, enabling factors, and demand factors. (2) Regarding research content, existing studies typically discuss the WTU and WTP for smart homes among older adults separately. However, WTU and WTP are at different stages of decision-making and are influenced by different factors. This paper will conduct a comprehensive analysis of both aspects and differentiate the influencing factors. (3) There are few studies focusing on urban elderly in China. As populations age globally, understanding elderly care needs becomes increasingly critical. This study accurately targets respondents aged 50 and above and describes the scope and potential functionalities of smart homes during the survey. This approach ensures methodological precision in our investigation. Study findings will contribute to evidence-based technological development and policy formulation for age-friendly smart home environments.
Methods
Study design
There has been no standardized quantitative tool or survey instrument specifically designed to measure the WTU and WTP for smart homes among older adults. We developed a questionnaire based on the Andersen Behavioral Model 30 and Grossman's Theory of Health Demand. 31 Grossman's theory creates a model that coherently links individuals’ daily health decisions, examining health decisions throughout the entire lifecycle. In the Grossman model, health can be viewed as a consumer good, a production input (factor of production), and capital. Andersen's Behavioral Model of Health Services Use is a conceptual model aimed at demonstrating the factors driving the decision of using health services. According to this model, this study categorizes health-related factors into three groups: predisposing factors (including demographic characteristics such as age and gender; social factors such as education, occupation, and race; social relationships; and psychological factors), enabling factors (including financial and organizational factors), and demand factors (perceived need for health services). 32
Our questionnaire consists of four parts: older adults’ WTU and WTP for smart homes, predisposing factors, enabling factors, and demand factors. From an ethical perspective, this study is solely a survey of older adults’ willingness and does not involve any medical clinical trials or human experiments. The study also adheres to the Declaration of Helsinki. The surveyed elderly individuals remain anonymous, their information is confidential, and the organization to which the authors belong oversees the information collection process related to the survey activities.
Variables and data
Dependent and independent variables
The dependent variables refer to the psychological attitudes of older adults towards the willingness to use (WTU) and willingness to pay (WTP) for smart home services. A five-point Likert scale was used to measure the intensity of older adults’ WTU and WTP for smart homes (1 = “very willing,” 2 = “somewhat willing,” 3 = “neutral,” 4 = “somewhat unwilling,” 5 = “very unwilling”). When conducting the survey, we specified the scope of smart homes (e.g., installing elder-friendly equipment in bathrooms and bedrooms, installing emergency call and remote monitoring systems for intelligent caregiving and other smart home devices relevant to older adults).
The independent variables consist of three parts: predisposing factors, enabling factors, and demand factors. Predisposing factors include age, gender, education, marital status, children, and employment status. All these are categorical variables and were statistically analyzed through single-choice questions (specific questions are provided in Appendix 1).
Enabling factors include income (monthly income), medical insurance. These are also categorical variables and were statistically analyzed through single-choice questions (specific questions are provided in Appendix 1).
Demand factors include psychological and physiological needs. The life satisfaction variable, a psychological demand factor, represents an individual's evaluation of their life and can measure subjective well-being. 33 When inquiring about respondents’ life satisfaction, we also used a five-point Likert scale to represent intensity. Physiological demand factors include hospitalization (hospitalization or illness history in the past year), disability (whether there is a disability), health issues, and activities of daily living (ADL) variables. These variables were statistically analyzed through single-choice questions (specific questions are provided in Appendix 1).
Notably, we also collected data on various health problems encountered by older adults in their retirement through multiple-choice questions (e.g., insomnia, memory decline, vision decline, hearing decline, etc.). Since most of the questions were non-scale questions, we conducted pre-tests to determine their validity. Additionally, the Cronbach's alpha coefficient for variables measured using scales was 0.723. This questionnaire has good validity and reliability.
Data source
The sample data comes from Hangzhou, Zhejiang Province, China. The respondents of this survey were all aged 50 and above, with clear consciousness and thinking ability, and they were voluntary participants. In China, the Law on Protection of the Rights and Interests of older adults defines people aged 60 and above as elderly. However, this study includes participants aged 50–60. Including this age group allows for a comparative analysis of WTU and WTP, particularly enabling comparisons between individuals aged 60 and above and those who are slightly younger.
The questionnaire distributors received standard training. They explained the purpose to the respondents. After obtaining informed consent from the participants, they distributed the questionnaires. The questionnaires were mainly completed by older adults themselves. For those who had difficulty completing the questionnaire, the distributors read the questions aloud and recorded older adults’ responses. This survey was conducted from April to June 2021, covering 12 different communities in Hangzhou. A total of 700 questionnaires were distributed, and 639 were returned. 34
Statistic analysis
(1) Descriptive statistics for WTU and WTP
We compiled statistics on older adults’ WTU and WTP for smart homes, which are presented in Tables 1 and 2, respectively. In Table 1, for WTU, among the 639 participants, 2.5% (n = 16) selected “very willing,” 12.5% (n = 80) selected “somewhat willing,” 30.4% (n = 194) selected “neutral,” 27.5% (n = 176) selected “somewhat unwilling,” and 27.1% (n = 173) selected “unwilling.” For WTP, 1.3% (n = 8) selected “very willing,” 6.6% (n = 42) selected “somewhat willing,” 26.3% (n = 168) selected “neutral,” 28.2% (n = 180) selected “somewhat unwilling,” and 37.7% (n = 241) selected “unwilling.” Comparing the two, older adults in the sample show a lower willingness to pay for smart home technology than their willingness to use it.
(2) Descriptive statistics of predisposing factors for WTU and WTP
The descriptive statistics for WTU of older adults.

Note. The bolded indicates the highest proportion.
The descriptive statistics for WTP of older adults.

Note. The bolded indicates the highest proportion.
According to Tables 1 and 2, the age distribution of participants is relatively even. The data show that among the 639 respondents (see the total column in Table 1), 19.6% are aged 50–59, 26.4% are aged 60–69, 25.4% are aged 70–79, and 28.6% are aged 80 or above. In terms of gender distribution, female participants accounted for 57.4% (n = 367) of the respondents, while male participants accounted for 42.6% (n = 272). Additionally, 74.6% (n = 477) of the respondents were married, while 25.4% (n = 162) were unmarried, which included single, divorced, and widowed individuals. From the perspective of employment status, 85% (n = 543) of the participants were not working, while 15% (n = 96) were working (regardless of whether they were paid).
(3) Descriptive statistics of enabling factors for WTU and WTP
From the perspective of health insurance, the majority of respondents have urban employee health insurance (68.2%, n = 436). In terms of income, the largest proportion of respondents have a monthly income between 2001 and 4000 RMB (53.5%, n = 342), followed by those with an income between 4001 and 6000 RMB, accounting for 29.4% (n = 188).
(4) Descriptive statistics of demand factors for WTU and WTP
In this study, 26.6% (n = 170) of participants reported being “very satisfied” with their lives, and 54.5% (n = 348) reported being “somewhat satisfied.” This indicates a relatively high overall level of life satisfaction among the sample. This is also reflected in the participants’ hospitalization experiences. 74.5% (n = 476) of participants did not have any hospitalization or rehabilitation experiences in the past year, and 5.9% (n = 38) had some degree of disability. The descriptive statistics of ADL show that 92.6% (n = 592) of participants were fully capable of self-care, 6.7% (n = 43) were partially capable of self-care, and 0.6% (n = 4) were incapable of self-care. We paid particular attention to various health issues older adults might have. The statistic of variable health issues shows that 33.6% (n = 215) of older adults had one health issue, 31.3% (n = 200) had two health issues, and 16.4% (n = 105) had three health issues.
Results
In this study, there were many categories for both the dependent and independent variables. Because of this, the Brant test did not converge, which means that the ordered logistic regression model's basic assumption (proportional odds assumption) was violated. To fix this, we combined some similar categories of variables to make the model work better. This approach follows the advice from Murad's research, which suggests that if data don’t fit the proportional odds assumption well, combining categories can help improve the model's fit and accuracy. 35 Additionally, the dependent variables WTU and WTP each have five categories to measure the degree of willingness, some of which can be merged into a single category. For instance, “very willing” and “somewhat willing” can be grouped into “willing,” while “somewhat unwilling” and “unwilling” can be grouped into “unwilling.” Based on this, we followed the work of Preisser et al., merging adjacent categories into one. 36 The categories “1, 2” for WTU and WTP were combined into “willing” (WTU = 1, WTP = 1); “3” was retained as “neutral” (WTU = 2, WTP = 2); and “4, 5” were combined into “unwilling” (WTU = 3, WTP = 3). Therefore, the dependent variables “WTU” and “WTP” were both transformed into ordered three-level variables.
It is important to note that the categories for income and education are more numerous than for other independent variables, and some categories have small sample sizes. Following the approach of Brooks et al., researchers merged adjacent small-sample categories into one category. 37 For the income variable, the categories “8001–10,000” and “>10,000” together account for only 2.1% of the total sample. Therefore, these two categories were combined with the “6001–8000” category to form a larger category “income > 6000,” representing a higher income level.
After these adjustments, the results of the Brant test are shown in Table 3. The p-values of the Brant test for both models are greater than 0.1, indicating that the models do not violate the proportional odds assumption. Therefore, ordered logistic regression can be used for the empirical analysis.
The brand test.

We present the results of the ordered logistic regression analysis in Table 4. The results show that age, income, life satisfaction, and the degree of health issues are significantly associated with older adults’ WTU for smart home. Additionally, age, income, hospitalization status, and the degree of health issues are significantly associated with older adults’ WTP for smart home technology. It is important to note that gender, marital status, employment status, health insurance, and ADL are not significantly associated with older adults’ WTU or WTP for smart home.
(1) The impact of age on WTU and WTP
The result of ordered logistic regression for WTU and WTP.
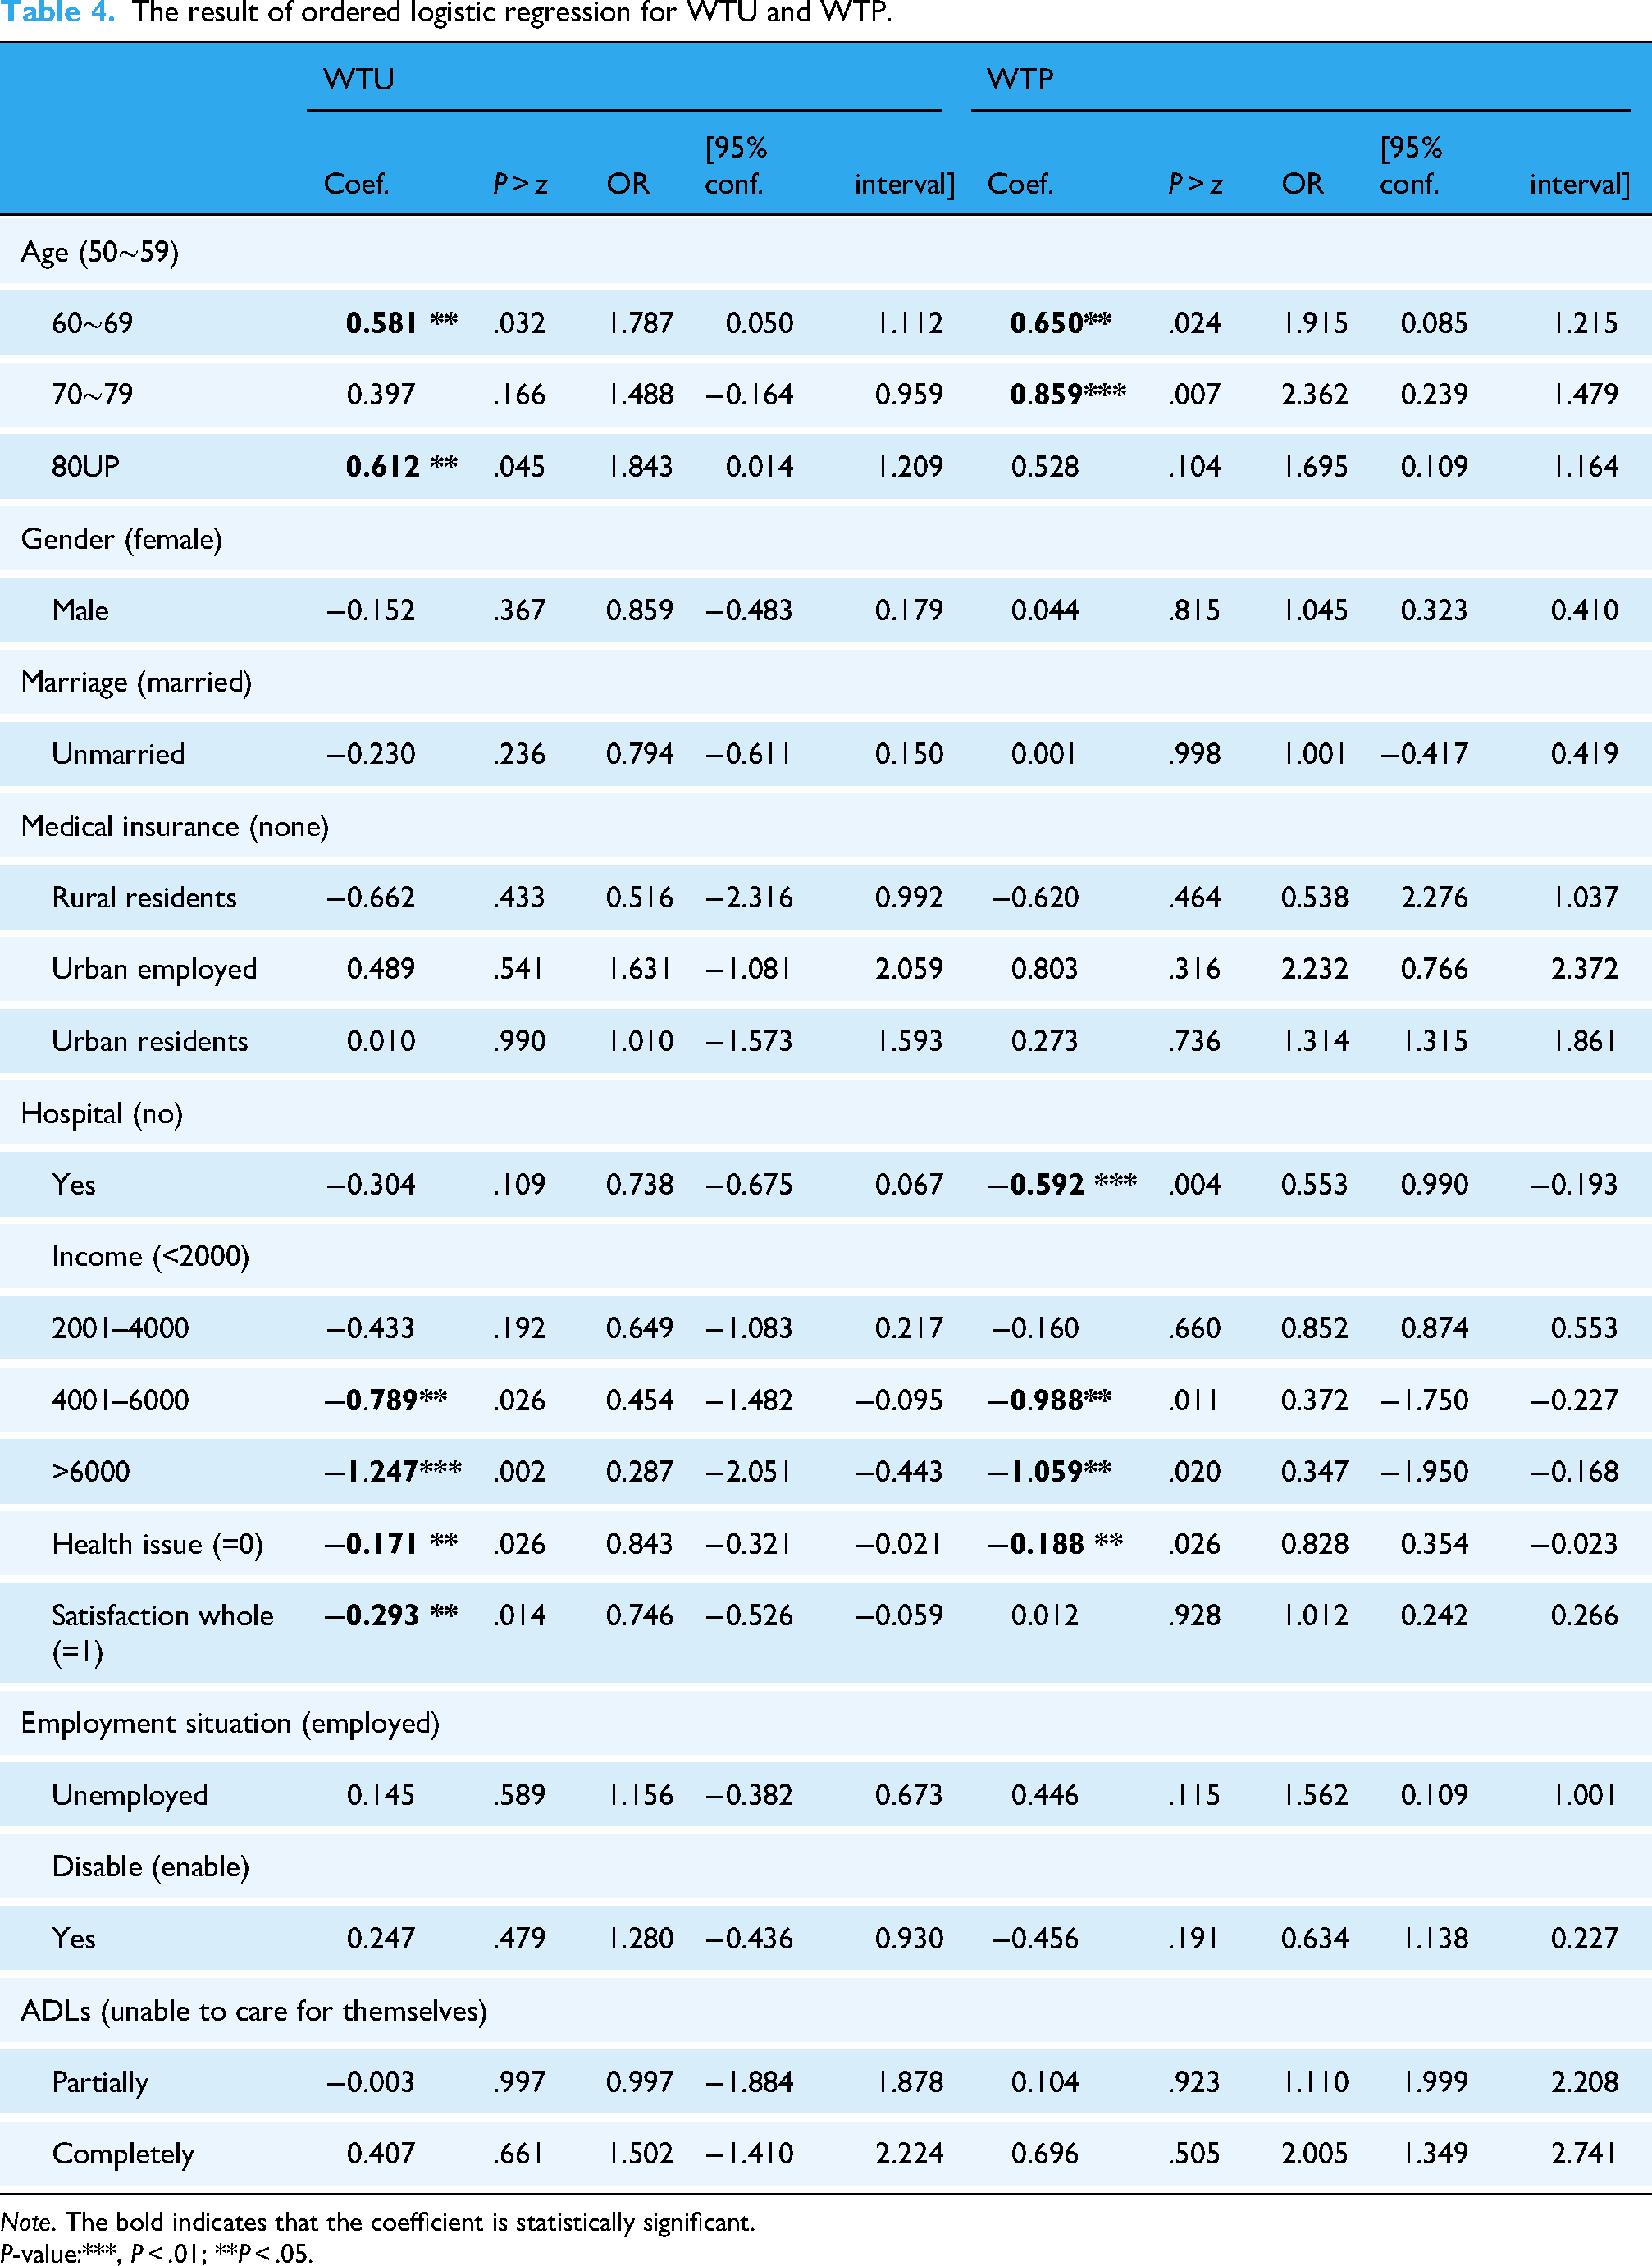
Note. The bold indicates that the coefficient is statistically significant.
P-value:***, P < .01; **P < .05.
According to the results of this study, older urban elderly populations have a lower willingness to use smart homes. The data indicate that the regression results and odds ratios (OR) for the age variable are positive (60–69 years: OR = 1.787, P = .032; 70–79 years: OR = 1.488, P = .166; 80 years and above: OR = 1.843, P = .045). Notably, the odds ratios for different age groups are all greater than 1, which means that compared to the 50–59 age group, older elderly individuals are relatively more conservative. Similarly, when analyzing the willingness to pay for smart homes among different age groups, the results for the age variable remain positive (60–69 years: OR = 1.915, P = .024; 70–79 years: OR = 2.362, P = .007; 80 years and above: OR = 1.695, P = .104). Overall, these results for WTU and WTP suggest that the older adult population, the more conservative in their willingness to use or purchase smart homes.
(2) The impact of life satisfaction on WTU and WTP
The regression results indicate that there is a significant negative relationship between life satisfaction and WTU (coefficient = −0.293, OR = 0.746, P = .014). In this study, life satisfaction was measured using a five-point Likert scale (1 = “very satisfied,” 2 = “somewhat satisfied,” 3 = “neutral,” 4 = “somewhat dissatisfied,” 5 = “dissatisfied”). Therefore, the negative coefficient indicates that, holding other variables constant, as life satisfaction increases by one level (becomes more dissatisfied), the likelihood of respondents being unwilling to use smart home products and services decreases by 0.293. In terms of odds ratios, with other variables held constant, for each unit increase in life satisfaction (becoming more dissatisfied), the odds of an elderly person being “unwilling” to use smart home products, compared to the combined “neutral” and “willing” categories, decreases by 25.4% (this is calculated by 1–0.746 = 0.254). Therefore, the more dissatisfied respondents are with their lives, the higher their willingness to use smart homes. Additionally, the relationship between life satisfaction and WTP was not significant.
(3) The impact of hospitalization history on WTU and WTP
Compared to elderly individuals without a history of illness or hospitalization in the past year, those with a history of illness and hospitalization are more likely to pay for smart home products and services (OR = 0.553, P = .004). For elderly individuals with a history of illness and hospitalization in the past year, compared to those without such a history, and holding all other variables constant, the odds of being “unwilling” to purchase smart home products and services, relative to the combined “neutral” and “willing” categories, decrease by 44.7%. Therefore, elderly individuals with a history of illness and hospitalization in the past year are more likely to purchase smart home products and services compared to those without such a history. It is important to note that hospitalization history is not significantly associated with the willingness to use smart homes.
(4) The impact of income on WTU and WTP
In the survey, the income options for older adults were divided into four categories (1 = “below 2000 RMB,” 2 = “2001–4000 RMB,” 3 = “4001–6000 RMB,” 4 = “above 6000 RMB”). Our research results show that elderly individuals with higher incomes are generally more inclined to use smart homes compared to those with an income of less than 2000 RMB (2001–4000 RMB: OR = 0.649, P = .192; 4001–6000 RMB: OR = 0.454, P = .026; above 6000 RMB: OR = 0.287, P = .002). Notably, the odds ratios decrease in higher income groups, indicating that the proportion of high-income elderly individuals who are unwilling to use smart homes is lower. The same trend is observed in the relationship between monthly income and WTP (2001–4000 RMB: OR = 0.852, P = .660; 4001–6000 RMB: OR = 0.372, P = .011; above 6000 RMB: OR = 0.347, P = .020). This result is consistent with the conclusions of other related studies.
38
(5) The impact of health issues on WTU and WTP
In the survey, we collected information on health issues troubling older adults using a multiple-choice question format. The options included insomnia, memory decline, vision decline, hearing decline, frequent falls, constipation, skin itching, limb and joint pain, and loneliness and anxiety. The number of health issues selected by each elderly respondent was used as an independent variable for regression analysis. The regression results indicate a significant negative relationship between the degree of health issues and WTU (coefficient = −0.171, OR = 0.843, P = .026). The negative coefficient suggests that, holding other variables constant, as the degree of health issues increases, the proportion of respondents unwilling to use smart home products and services decreases by 0.171. In terms of odds ratios, with an increase in the degree of health issues, the likelihood of an individual being “unwilling” to use smart home products, compared to the combined “neutral” and “willing” categories, decreases by 15.7%, assuming all other variables remain constant. There is a similar relationship between the degree of health issues and WTP (coefficient = −0.188, OR = 0.828, P = .026).
Discussion
Why older people don't like smart home?
Our study indicates that the urban elderly population maintains a conservative attitude toward smart homes. Only 2.5% of respondents expressed a strong willingness to actively try smart homes, 12.5% were somewhat willing, 30.4% exhibited a “neutral” stance, and more than half of older adults were unwilling to try smart home modifications. Furthermore, their willingness to pay is lower than their willingness to use. This finding is consistent with previous studies.39,40
The reasons for this outcome are multifaceted. One reason is that current smart home technology is not yet mature. It is in its nascent stages and struggles to fully integrate with the modern healthcare system, thus lacking influence in the healthcare industry. At the same time, smart home brands and such products have not created sufficient market impact, with some products still in the trial phase, leading to a cautious attitude among potential users. Another reason lies in the target customer base. There is a significant digital divide between older adults and other age groups. 41 Additionally, aging-friendly smart homes also face ethical challenges. These ethical challenges manifest across multiple dimensions that directly impact the implementation of smart home technologies for elderly care. First, the deployment of intelligent monitoring systems raises fundamental questions about human dignity in care settings. Mihailov (2024) argues that smart home technologies may compromise the humanistic aspects of elderly care, challenging traditional concepts of dignity and personal autonomy in domestic environments. 42 Second, privacy concerns constitute a significant barrier to widespread adoption. Tian and Wangmo (2024) identify critical privacy issues inherent in smart home health technologies, particularly regarding data collection, storage, and usage practices that may intrude upon older adults’ personal lives and decision-making autonomy. 43 Third, despite the potential benefits of these technologies, substantial practical barriers persist. A comprehensive systematic review by Tian et al. (2024) reveals that while smart home health technologies can enhance self-management and independent living for older persons, significant obstacles remain in terms of usability, social acceptance, and cost-effectiveness. 44 These findings indicate that current barriers to adoption encompass not only technical limitations but also fundamental concerns about user experience and economic accessibility. The convergence of these ethical, privacy, and practical challenges suggests that successful implementation of smart home technologies in elderly care requires a holistic approach that balances technological innovation with respect for human dignity, privacy protection, and user-centered design principles.
Overall, due to the unique characteristics of older adults population and the immaturity of smart home technology, smart homes currently face challenges in gaining widespread acceptance in older adults healthcare system.
Predisposing factors
Among the predisposing factors, age consistently shows a negative association with smart home adoption willingness in the regression analysis. Compared to the youngest cohort (50–59 years), all older age groups exhibit significantly lower WTU and WTP, with odds ratios consistently exceeding 1.0 across age categories (60–69 years: WTU OR = 1.787, P = .032; WTP OR = 1.915, P = .024; 70–79 years: WTU OR = 1.488, P = .166; WTP OR = 2.362, P = .007; 80+ years: WTU OR = 1.843, P = .045). This age-related technology resistance can be attributed to two primary factors supported by extensive empirical evidence. First, the digital divide phenomenon becomes increasingly pronounced with advancing age. 45 Harris et al. 46 documented that a persistent digital divide exists between younger and older generations, with older adults generally adopting current and emerging technologies at a slower pace. This divide extends beyond simple access issues to encompass what McDonough 47 describes as gradations of digital exclusion, where older adults experience limited exposure to digital technologies throughout their formative years, creating psychological barriers and resistance to adoption. The magnitude of this divide is particularly evident in smart home contexts, where multiple technological competencies must be integrated simultaneously. 48 Second, age-related cognitive and physical changes present substantial barriers to technology learning and adoption. Research demonstrates that cognitive deficits, along with physical impairments such as vision and hearing loss and mobility limitations, pose significant challenges in technology use among older adults. 49 These age-related sensorial, physical, and cognitive declines create difficulties in acquiring new technological skills. 50 Furthermore, traditional technology acceptance models have been criticized for neglecting these biophysical factors specific to aging populations, as existing frameworks inadequately address the cognitive and physical decline that characterizes the aging process. 51 The convergence of digital inexperience and age-related functional changes creates a compounding effect that significantly impedes smart home technology adoption among older cohorts.
Contrary to expectations based on existing literature, several traditional predisposing factors demonstrated no significant association with smart home adoption willingness among our elderly sample. Gender, marital status, and employment status all failed to reach statistical significance for both WTU and WTP outcomes. This pattern of non-significance can be primarily attributed to the health-oriented nature of smart home technologies, which fundamentally alters the decision-making hierarchy among older adults. When technologies directly address critical health and safety needs—as smart homes do through monitoring, emergency response, and daily living assistance—individual health circumstances and perceived necessity override traditional demographic predictors. 52 Research consistently demonstrates that older adults show greater motivation to engage with technology when they perceive a clear connection between improved health behaviors and better health outcomes, recognizing the additional health benefits such as enhanced autonomy and improved quality of life. 52 This health-driven adoption pattern reflects a utility-maximizing logic where perceived value of the technology, perceived improvement in quality of life, and confidence in technology use become the dominant predictors of willingness to adopt, effectively rendering conventional sociodemographic characteristics less influential. 53 The convergence toward health-driven decision making among older adults suggests that smart home adoption follows a need-based rather than demographic-based pattern, explaining why gender, marital status, and employment status lose their predictive power in this specific technological context. 54
Enabling factors
Enabling factors, which reflect the structural and resource-based conditions supporting technology adoption, emerge as critical predictors of both WTU and WTP among older adults. Higher income levels are associated with increased WTU and WTP for smart home products and services among these individuals. This income-based differential in technology adoption reflects the convergence of two fundamental mechanisms that systematically influence older adults’ technology decision-making processes. First, financial accessibility represents the most direct pathway through which income constrains smart home adoption among older adults. Smart home technologies typically require substantial upfront investments, including initial device costs, installation fees, monthly subscription services, and ongoing maintenance expenses that can be prohibitive for elderly individuals with limited fixed incomes. 55 Research consistently identifies funding constraints and cost concerns as primary barriers to smart home technology adoption among older adults. 56 These financial barriers are particularly pronounced given that many older adults must balance technology investments against essential healthcare and living expenses, effectively positioning smart home technologies as unattainable luxuries rather than feasible health investments. 57 Higher-income elderly populations possess greater financial capacity to absorb these costs without compromising their essential needs, enabling them to view smart home technologies through a utility-maximizing lens focused on long-term health benefits rather than immediate economic constraints. Second, income serves as a proxy for broader socioeconomic advantages that facilitate technology adoption through enhanced digital capital and support systems. The digital divide research demonstrates that lower income is consistently associated with reduced technology access and usage among older adults, reflecting systematic inequalities in digital opportunities. 58 Higher-income older adults typically possess enhanced educational attainment, increased technology exposure through social networks, and greater access to technical support systems—factors that collectively reduce technology anxiety and increase adoption confidence. 59 These socioeconomic advantages create cumulative effects where financial capacity combines with enhanced digital literacy and support resources to substantially increase both willingness to use and willingness to pay for smart home technologies among higher-income elderly populations. 60
The results for medical insurance status indicate that whether elderly individuals have health insurance is not significantly correlated with their WTU for smart homes. This is primarily because China's current health insurance does not cover smart home products and services. From the perspective of insurance policies, there should be active screening and evaluation of appropriate smart home products or services for inclusion in health insurance coverage. This would enhance the prevalence and utilization of smart home products and services.
Demand factors
Among psychological demand factors, life satisfaction significantly negatively predicts elderly individuals’ willingness to use smart homes. This counterintuitive finding suggests that dissatisfaction with current life circumstances may motivate elderly individuals to seek technological solutions that promise improved quality of life, enhanced independence, or better health management. Research indicates that older adults’ technology adoption willingness is strongly associated with perceived improvements in quality of life attainable from technologies. 61 When experiencing life dissatisfaction, elderly individuals may perceive smart homes as potential remedies for the sources of their discontent, whether these stem from health limitations, social isolation, or reduced autonomy. Smart home technologies offer capabilities that directly address multiple dimensions of psychological well-being, including personal growth, autonomy, environmental mastery, and positive relationships. 62 Specifically, seniors show greater motivation to engage with technology when they perceive a clear connection between improved health behaviors and better health outcomes, recognizing the additional benefits such as enhanced autonomy and improved quality of life. 63 This suggests that psychological dissatisfaction creates a readiness to explore technological alternatives that might fulfill unmet psychological needs. Notably, this psychological dissatisfaction drives interest but not necessarily financial commitment, possibly due to resource constraints or uncertainty about the technology's ability to address their underlying concerns.
Among physiological need variables, hospitalization history and the degree of health issues significantly predict smart home adoption willingness, while disability status and ADL limitations do not. This pattern reveals that acute health events and accumulated health burdens are more powerful motivators than stable functional limitations. Hospitalization represents a critical transition that heightens awareness of health vulnerability and creates immediate needs for continuous monitoring and support. 64 The post-hospitalization period fundamentally alters older adults’ perception of their health fragility, making them more receptive to technologies that can facilitate aging in place, reduce hospitalization risks, and avoid institutionalization. 63 Similarly, elderly individuals managing multiple health conditions recognize the potential of smart home technologies to coordinate complex care needs, monitor multiple symptoms, and prevent health crises. Modern smart home technologies incorporate various sensors that can passively and non-invasively collect health data, significantly contributing to safety and enabling older adults to maintain mobility at home. 65 These technologies serve as valuable complements to physical primary care by reducing costs, improving healthcare access, and enabling continuous patient monitoring. 66 The non-significance of disability and ADL suggests that elderly individuals may have already adapted to stable limitations through conventional means, whereas recent hospitalizations and multiple health issues create new, unmet needs that smart home technologies can uniquely address. This finding implies that smart home marketing and design should target elderly individuals experiencing health transitions or managing multiple conditions, as these groups demonstrate the highest receptivity to technological health solutions.
Limitations
This study has certain limitations. First, this research did not include factors that might help explain older adults's participation in smart homes, such as intergenerational relationships and digital skills among older adults. Future research should examine the impact of these factors on older adults’ WTU and WTP for smart homes. It is worth noting that the digital divide may be a potentially significant factor in the use of smart homes. In advancing smart homes, future research can analyze the extent to which older adults’ ability to use digital technology influences their willingness to use and willingness to pay for smart homes technology. Thus, it can investigate how to bridge the digital divide among older adults to reduce health inequalities.67,68
Second, the evaluation of smart homes adoption is subject to the influence of selective non-participation. This selective non-participation may hinder the expression of the needs and interests of certain target groups and bias the research results. The data sample for this study was collected through questionnaires, which may introduce a degree of selective non-participation bias.
Third, this study is based on a relatively small sample of elderly individuals, which limits the generalizability of the findings. The sample was drawn from several different communities within one city, so the needs of older adults population might vary by region. Therefore, this research would be extended to different cities or regions with varying economic conditions and levels of technological development, and the results could be compared with those of this study.
Conclusion
This study examined factors influencing elderly individuals’ willingness to use (WTU) and willingness to pay (WTP) for smart home technologies using the Andersen Behavioral Model. Our empirical analysis revealed that age negatively affects both WTU and WTP, indicating older cohorts are more conservative toward smart home adoption. Income positively influences both WTU and WTP, with higher-income elderly showing greater receptivity to smart home technologies. Among demand factors, life satisfaction negatively predicts WTU but not WTP, suggesting that dissatisfied elderly seek technological solutions but may lack financial commitment. Hospitalization history significantly increases WTP but not WTU, while the degree of health issues positively affects both WTU and WTP. Notably, traditional demographic factors including gender, marital status, employment status, disability, and ADL showed no significant effects, indicating that smart home adoption is primarily driven by economic capacity and health-related needs rather than conventional sociodemographic characteristics.
Based on these findings, three policy recommendations emerge. First, governments should implement age-differentiated smart home promotion strategies with enhanced digital literacy programs specifically targeting the 70+ age groups who demonstrate the highest resistance to adoption. Given that age-related cognitive and physical barriers compound with digital inexperience, these programs should incorporate hands-on training, simplified interfaces, and peer-learning approaches that address both technological anxiety and functional limitations. Such targeted interventions are essential because our results show that age remains the strongest predictor of technology resistance, with odds ratios for unwillingness increasing substantially in older cohorts. Second, financial support mechanisms including means-tested subsidies, tax incentives, or installment payment plans should be established to address the income-based adoption gap. Since our analysis demonstrates that elderly with monthly incomes below 4000 RMB show significantly lower adoption willingness, and given that smart home technologies require substantial upfront investments averaging 10,000–30,000 RMB for basic systems, financial assistance programs could transform these technologies from perceived luxuries to accessible health investments. Such programs should prioritize low-income elderly who may benefit most from smart home health monitoring but currently face prohibitive financial barriers. Third, healthcare systems should integrate smart home technology education and setup into post-hospitalization discharge planning, particularly for elderly with multiple chronic conditions. Our findings reveal that hospitalization experiences and accumulated health issues significantly increase adoption willingness, suggesting a critical window of opportunity during health transitions. By incorporating smart home consultations into discharge protocols, training hospital staff on available technologies, and potentially bundling basic monitoring devices with post-acute care packages, healthcare providers can capitalize on heightened receptivity while addressing immediate safety and monitoring needs. This approach is particularly crucial given that 25.5% of our sample experienced hospitalization in the past year, representing a substantial population ready for technological health solutions.
Footnotes
Acknowledgments
We would like to thank all the older adults who took part in the survey.
Ethics approval and consent to participate
One Belt-One Road Strategy Institute, Tsinghua University, approved this study. This study complies with the Declaration of Helsinki. Both written and verbal consent were obtained from the participants prior to the interviews for this project. People's information is confidential.
Consent for publication
Our manuscript does not contain any person's data (including any individual details, images, or videos).
Clinical trial number
This study does not involve clinical trials of any drugs or medical devices. It is a survey-based study focusing on the willingness to use and willingness to pay for digital health technologies such as smart home services among elderly individuals. Therefore, clinical trial registration is not applicable to this study.
Contributorship
HS analyzed and interpreted the survey data regarding older adults’ willingness to use and pay for smart home, writing the initial draft. HQ did the substantive translation, funding acquisition, and writing—review and editing. KY performed conceptualization, validation, supervision, and writing—review and editing. All authors read and approved the final manuscript.
Funding
The authors disclosed receipt of the following financial support for the research, authorship, and/or publication of this article: This article is supported by Zhejiang Provincial Philosophy and Social Sciences Planning Project, “Pilot Reform of Basic Research Funding for Provincial Universities” (24NDJC322YBMS).
Declaration of conflicting interests
The authors declared no potential conflicts of interest with respect to the research, authorship, and/or publication of this article.
Availability of data and materials
Data available on request; any of the authors should be contacted to request the data.
APPENDIX 1
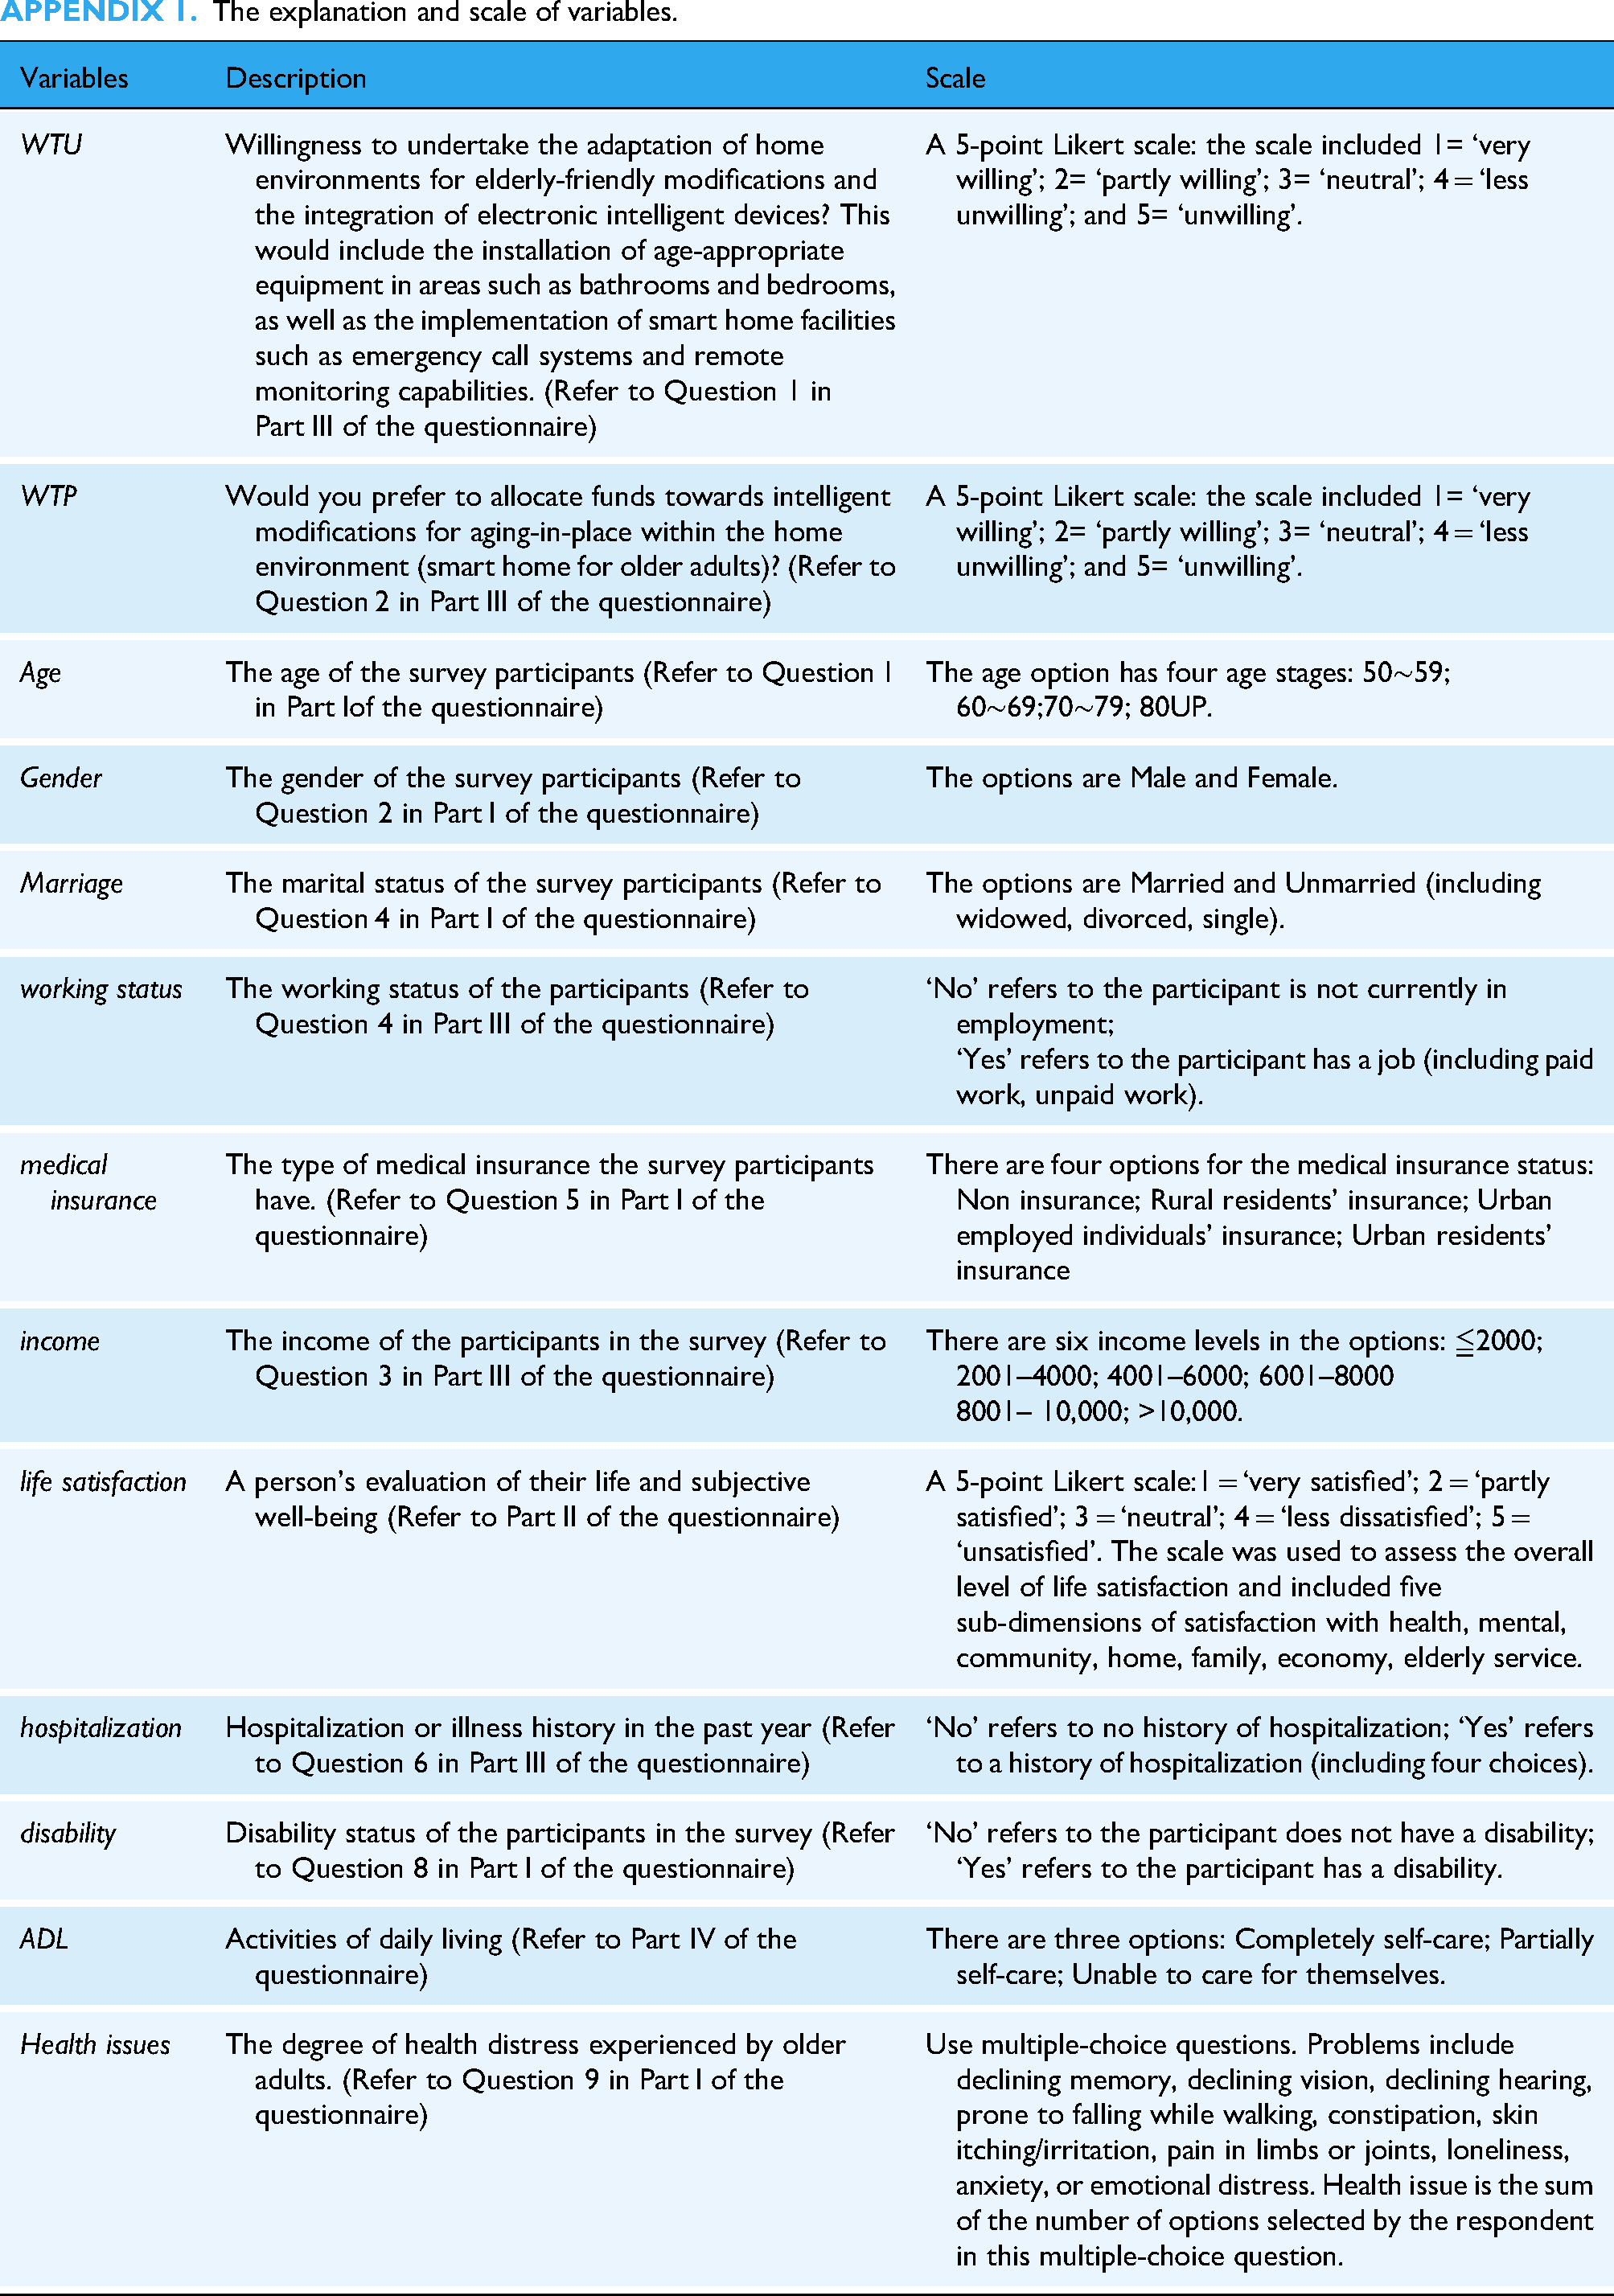
The explanation and scale of variables.
| Variables | Description | Scale |
|---|---|---|
| WTU | Willingness to undertake the adaptation of home environments for elderly-friendly modifications and the integration of electronic intelligent devices? This would include the installation of age-appropriate equipment in areas such as bathrooms and bedrooms, as well as the implementation of smart home facilities such as emergency call systems and remote monitoring capabilities. (Refer to Question 1 in Part Ⅲ of the questionnaire) | A 5-point Likert scale: the scale included 1= ‘very willing’; 2= ‘partly willing’; 3= ‘neutral’; 4 = ‘less unwilling’; and 5= ‘unwilling’. |
| WTP | Would you prefer to allocate funds towards intelligent modifications for aging-in-place within the home environment (smart home for older adults)? (Refer to Question 2 in Part Ⅲ of the questionnaire) | A 5-point Likert scale: the scale included 1= ‘very willing’; 2= ‘partly willing’; 3= ‘neutral’; 4 = ‘less unwilling’; and 5= ‘unwilling’. |
| Age | The age of the survey participants (Refer to Question 1 in Part Ⅰof the questionnaire) | The age option has four age stages: 50∼59; 60∼69;70∼79; 80UP. |
| Gender | The gender of the survey participants (Refer to Question 2 in Part Ⅰ of the questionnaire) | The options are Male and Female. |
| Marriage | The marital status of the survey participants (Refer to Question 4 in Part Ⅰ of the questionnaire) | The options are Married and Unmarried (including widowed, divorced, single). |
| working status | The working status of the participants (Refer to Question 4 in Part Ⅲ of the questionnaire) | ‘No’ refers to the participant is not currently in employment; ‘Yes’ refers to the participant has a job (including paid work, unpaid work). |
| medical insurance | The type of medical insurance the survey participants have. (Refer to Question 5 in Part Ⅰ of the questionnaire) | There are four options for the medical insurance status: Non insurance; Rural residents’ insurance; Urban employed individuals’ insurance; Urban residents’ insurance |
| income | The income of the participants in the survey (Refer to Question 3 in Part Ⅲ of the questionnaire) | There are six income levels in the options: ≦2000; 2001–4000; 4001–6000; 6001–8000 8001– 10,000; >10,000. |
| life satisfaction | A person's evaluation of their life and subjective well-being (Refer to Part Ⅱ of the questionnaire) | A 5-point Likert scale:1 = ‘very satisfied’; 2 = ‘partly satisfied’; 3 = ‘neutral’; 4 = ‘less dissatisfied’; 5 = ‘unsatisfied’. The scale was used to assess the overall level of life satisfaction and included five sub-dimensions of satisfaction with health, mental, community, home, family, economy, elderly service. |
| hospitalization | Hospitalization or illness history in the past year (Refer to Question 6 in Part Ⅲ of the questionnaire) | ‘No’ refers to no history of hospitalization; ‘Yes’ refers to a history of hospitalization (including four choices). |
| disability | Disability status of the participants in the survey (Refer to Question 8 in Part Ⅰ of the questionnaire) | ‘No’ refers to the participant does not have a disability; ‘Yes’ refers to the participant has a disability. |
| ADL | Activities of daily living (Refer to Part IV of the questionnaire) | There are three options: Completely self-care; Partially self-care; Unable to care for themselves. |
| Health issues | The degree of health distress experienced by older adults. (Refer to Question 9 in Part Ⅰ of the questionnaire) | Use multiple-choice questions. Problems include declining memory, declining vision, declining hearing, prone to falling while walking, constipation, skin itching/irritation, pain in limbs or joints, loneliness, anxiety, or emotional distress. Health issue is the sum of the number of options selected by the respondent in this multiple-choice question. |