
Abstract
Background
Epilepsy is a sensitive social and health issue that causes sudden death in epilepsy. Awake and sleep electroencephalogram (EEG) first test confirms 80% of patients with confirmed epilepsy. Explainable artificial intelligence (XAI) for epileptic seizures (ESs) emerged to overcome drawbacks of artificial intelligence (AI) models like lack of right to explain, fairness, and trustworthiness, and an overwhelming paper was published. However, there is a lack of reporting interpretable and performance tradeoffs, stating the most interpretable AI applied, describing the most useful waveforms learned in XAI models, documenting areas of interest, and identifying the relationship between frequency bands and epilepsy. Therefore, this systematic review aims to comprehensively evaluate the performance and the interpretability of interpretable AI methods used for ES monitoring using an EEG.
Methods
This study followed PRISMA guidelines for systematic review. Advanced search queries were hardheaded into five reputable databases. Rayyan online platform for a systematic review was used. The disagreement was resolved through discussions.
Results
Twenty-three papers are included. A total of 14 datasets are used. A total of 16,200 populations are participated in all the included studies. CHB-MIT Dataset is frequently used (12 times). Minimizing the number of waveforms learned will increase the accuracy and reduce the memory used. Interpretability to accuracy trade-offs are observed in the studies included.
Discussion
The result of this systematic review implies that further studies are needed on interpretable to accuracy tradeoffs, multi-modal care recommendations, and onset early warning to minimize sudden unexpected death in epilepsy and damage. Optimizing waveforms for ESs needs more investigation. Subjective matrices must be investigated very well before being used by XAI. This study has no ethical considerations associated with it. It has been registered with PROSPERO: registration number: CRD42023479926.
Keywords
Introduction
The brain controls vision, breezing, thought, memory, emotion, temperature, hunger, touch, and motor skills. 1 Epileptic seizures (ESs) are a non-communicable chronic sickness of the brain that distresses people of all ages. Seizures are the electrical generation of uninhibited brain cells in a patient, which can illustrate various symptoms.2,3 Globally, over 70 million people have ESs, the most common neurological disease.4,5 Early demise in society with seizures is up to three times more than in the overall population.6,7 Early death as a result of sudden death in epilepsy like accidents, status, and epileptics rates are more than 20 times higher. Additionally, patients and their caregivers/parents suffer from shame and isolation worldwide. 5 Approximately 80% of the population with ESs lives in low- and middle-income countries.8,9 Over 75% of patients living with ESs in low-income countries do not get the care and treatment desired.10,11 It is estimated that on-time intervention, proper diagnoses, and treatments make more than 70% of patients living with ESs live free of it. 11
ES diagnosis is based on symptoms, physical signs, and electroencephalogram (EEG) test results, 12 computed tomography scan, and magnetic resonance imaging. 13
The German psychiatrist, Hans Berger discovered the human EEG in 1929.14,15 It is an electrical activity of the brain during brain tests extracted from EEG. 14 Brain activity changes from normal if someone has an ES. The change is also called epileptiform brain activity. An EEG is a core for correct management and diagnosis of epilepsy status. If possible, there should be 24-hour availability of reported EEG with monitoring facilities.14,15
The clinical applications of EEG monitoring help determine the characterization of seizure type, convulsive nerve attack diagnosis, differentiating night-time ES and parasomnias, diagnosis of psychogenetic non-ES, quantification of interictal epileptiform discharges or ES frequency, and evaluation of candidates for epilepsy surgery.16–18 About half of suspended ES populations show inter-ictal epileptiform discharge in the first EEG examination. 19 The use of sleep studies is recommended for all ages. 20 Awake and sleep samples taken yielded 80% of patients with confirmed ES.20,21 Echoing EEG samples of adults exhibited up to four times increase of ES. 19
Epilepsy patients choose antiepileptic medication and prediction.22,23 EEG results into the multi-axial diagnosis of ES, in standings of whether the ES illness is generalized or focal, symptomatic or idiopathic, or special ES syndrome.23,24
Typically, as depicted in Figure 3 EEG signals are divided into four periods. 25 Inter-ictal, an seizure-free interval found between the post-ictal and the pre-ictal; ictal, matching to the ES; post-ictal, a stubborn period after the ES; and pre-ictal, before the ES. 26
Artificial intelligence (AI) for ES diagnosis supports doctors’ decision-making.27,28 Most widely used different AI algorithms (machine learning and deep learning) maintain high accuracy.27,29 However, they lack trustworthiness and ethical AI.30,31 To overcome these problems interpretable AI is emerged.32,33 There is a wealth of information available on the use of explainable artificial intelligence (XAI) in the detection of ESs through EEGs. Therefore, this review aims to comprehensively evaluate published papers on interpretable AI for ES diagnosis using an EEG.
Electroencephalogram
EEG is a test to screen the signal sensitivity of the head thereby detecting disorders like epilepsy, if any, using electrodes. EEG recording can use: (1) surface electrodes: located on the superficial of the scalp. It is most common. (2) Cortical conductors: located on the superficial of the mind at the time of surgical procedure. (3) Depth electrodes: inserted deep into the brain to detect deeper foci of seizures.
EEG recording represents the activity of the surface layer of the brain. It is an output of the EEG machine. It is also known as an invasive method to record the microscopic electric movement by locating windows on the scalp. 34 Throughout painless examination, small windows are placed on the scalp to extract the electric signals formed in the mind. These electrodes are placed by a conventional rule from 10–20 international EEG locating systems (Figure 1) and are monitored by doctors. The 10–20 international EEG locating system waveforms reflect the cortical electrical activity.35,36

International 10–20 EEG placement system.
The EEG activity signal intensity is quite small. It is measured by microvolts (mV). It detects the populational level of neural activity. EEG is good for monitoring population-level neural activities in behaving teams. It cannot reveal anything about the activity pattern of a single neuron. It just gives an overview of activities; no intricate details are provided by EEG.
Surface layer of the brain
The surface layer of the brain is divided into four geographical regions (F-frontal, C-central, T-temporal, and P-partial). As Figure 1 shows, electrodes are placed by conventional rule from 10–20 (10–20 international EEG locating system). Its waveforms reflect the cortical electrical activity.35,36 First and foremost, nasion is located near noise. The second nasion is inserted at the rear of the scalp, and the electrodes will be positioned at a 10% distance from the nasion to the back. Finally, other electrodes will be placed at 20% distance from the current position. The even numbers show that it is from the right head side and the odd numbers show that the electrodes are from the left head side.
In the order of higher frequency to lower, the five brain waveforms are: gamma, beta, alpha, theta, and delta (Figure 2).
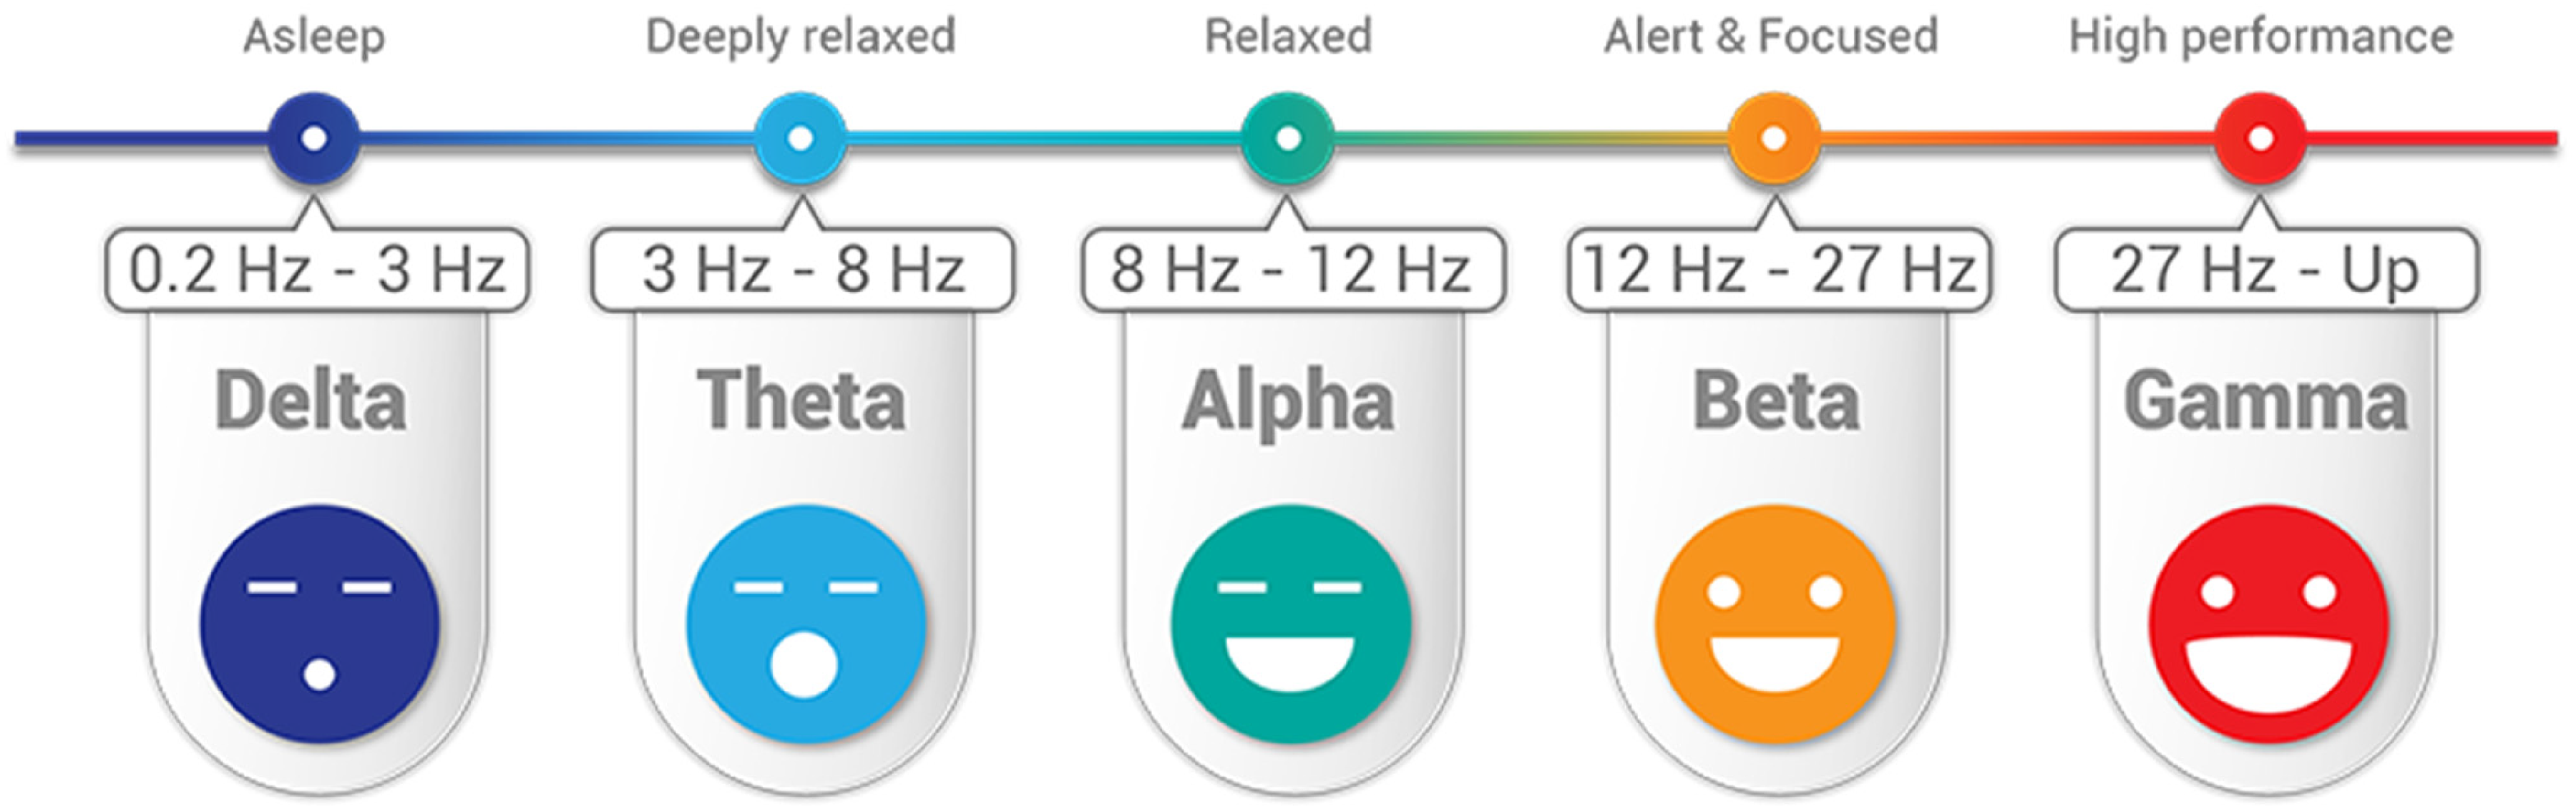
Five different waveforms of EEG from the brain to diagnosis of epilepsy.
Beta (β) is 12–27 Hz waves per second. It is present in the EEG of healthy people. It can be caused by medications (benzodiazepines) or may indicate muscle activity (artifact). Beta waves are symptoms of conscious states such as calculation, reading, thinking, cognitive reasoning, or speaking. However, too much beta activity may lead to stress and anxiety—and overwhelming stress and anxiety are symptoms of ES onset in the coming minute or an hour.
Alpha (α) 8–12 Hz: indicates normal posterior activity in relaxed, awake patients with eyes closed; disappears with attention, stress, etc. Alpha waves are the “frequency bridge” between our conscious thinking (beta) and subconscious (theta) mind. ESs, especially clonic seizures, result in the patients with the loss of consciousness.
Theta 3–8 Hz and delta (Δ) < 3 Hz: waves seen in sleep and certain pathologic conditions; benzos and barbs do induce slowing; abnormal in the awaken adults. Much lower levels of gamma activity are recorded during mental disabilities. Theta wave is a symptom of a trance or hypnotic state.
EEG signals and features for ES diagnosis
A study 37 used original EEG signals. Discrete Fourier transform and discrete wavelet transform (DWT) methods were used before feature extraction. The glioblastoma multiforme fusion and genetic algorithm are used to classify EEG signals. Three groups of EEG signals (ictal-normal-interictal) from the EEG database of the University of Bonn 37 were evaluated.
A study 38 extracted and used multi-domain features like time, frequency, time–frequency, and entropy-based features to represent the features of EEG signals. Additionally, the study states that including several features may decrease the classification accuracy. Therefore, important features are more designated and founded on their important scores. ES classification of EEG signals was done by using an extreme gradient boosting classifier. 38
In a study 39 10 features were extracted from the EEG. Nevertheless, the features were reduced, and three features, including amplitude range, band frequency, and their proposed feature like crest range, were selected for classification. We can see several patterns on the brain surface EEG tracing during seizure (Figure 3).

Brain EEG recording and each stage pattern.
Inter-ictal spike is highly synchronized with one single inter-ictal spike. It indicated the area of potential seizure onset. It does not mean seizure but it shows reduced frequency to develop into seizure.
The silent period is typically right after we may see increased frequency and spike. In between seizures, the brain may be silent.
Ictal seizure: spike and frequency are related to what is going on in the brain electrometry. This is during a seizure. This is characterized by corrupted surrounding neutrons.
Post-ictal depression: characterized by flat, quiet, high frequency, and very low amplitude activity.
Interpretable AI for epileptic seizure diagnosis
A study 40 states that complex deep learning algorithms are applied in medical rehearsal sparsely. Additionally, deep learning algorithms are not trusted by doctors because of their inadequate explanation. The black-box nature of the deep learning model hinders its interpretability. 41 The use of AI models with low transparency or interpretability also raises concerns about accountability, patient safety, and decision-making. 42 Additionally, users have the right to explanation as declared by the EU Artificial Intelligence Act and the EU General Data Protection Regulation (GDPR). 43 Articles 13–15 of the GDPR do give individuals the right to receive “meaningful information about the logic involved” in automated decisions. 43 ESs result in sudden unexpected death. Therefore, the detection of epilepsy seizure results is very sensitive. 44 Even though ES is diagnosed through EEG, reading EEG needs highly professional experts and AI. A study 45 discussed that experienced doctors (neurophysiologists) detect epilepsy by visually scanning the EEG signals for pre-ictal, inter-ictal, and ictal activities (discussed in the section “EEG signals and features for ES diagnosis”). They look like spikes, sharp waves, and spike-and-wave discharges 45 and may refer to these waves as “epileptiform abnormalities” or “epilepsy waves.” The reading needs an accurate explanation to convince the patients and their families. So, it necessitates interpretable AI. XAI is a growing field that provides new methods that explain and interpret the results produced by machine learning models. Therefore, interpretable AI methods were used for ES diagnoses using EEG as shown in Figure 4 and an overwhelming paper was published. The previous review paper 44 provides a review of neural network-based ES detection methods. However, the paper 44 lacks a thorough analysis of current trade-offs between interpretability and performance, the application of interpretable AI to the diagnosis of ESs, the identification of the most helpful waveforms learned in XAI models, visual representations of EEG, and the relationship between frequency bands and epilepsy. Therefore, this study was proposed to pose gaps for future researchers by discussing the challenges or risks associated with using black-box AI models in ES diagnosis and how interpretable methods can address these concerns. Therefore, using black-box AI models in medicine in general and for ES diagnosis, in particular, resulted in disallowing the right of explanation guaranteed in Articles 13–15 of the GDPR.

XAI for epileptic seizure diagnosis architecture.
This study set the following leading review questions:
To what extent there is interpretability and performance tradeoffs in interpretable AI for ESs? How is interpretable AI applied to ES diagnosis? What are the most useful waveforms learned in XAI models for ES based on the activation differences? To what extent region of interest for EEG-based ES monitoring is recommended? How are brain EEG frequency bands related to ESs?
Methods and analysis
Information sources
Terms like Epileptic Seizure diagnosis, Epileptic Seizure detection, ES, AI, artificial intelligence, XAI, explainable, interpretable, deep Learning, and machine learning by connecting them using negation, conjunctive, and disjunctive logical operations were used. They were used in advanced searching from databases like Scopus, PubMed, IEEE Xplore, Web of Science, and ScienceDirect. Their bibliographic data is exported to ris, CSV, and bib file extensions. The file was downloaded and processed for further preprocessing. Figures 5 and 6 show that journal articles are the largest sources of evidence for this review.

Extracted papers source type and corresponding number of papers.

Extracted papers source type Picart.
Search strategy
Advanced search terms were used to find the titles and abstracts of the published research articles and conference proceedings papers (Table 1). There is no time limit on the search. On 12 November 2023, articles were searched. For articles and titles published in the English language accessed on 12 November 2023, we searched PubMed, Web of Science, ScienceDirect, Scopus, IEEE Xplore, and Google Scholar using the following search terms: “Interpretable Artificial Intelligence,” “Epileptic Seizure diagnosis,” “Electroencephalogram,” “XAI,” and “EEG.”
Search queries applied to databases.

Inclusion and exclusion criteria
PRISMA guidelines for systematic review were used in writing this report. 46 The PICOTS outline is used for exclusion and inclusion criteria as shown in Table 2.
Exclusion and inclusion conditions.

XAI: explainable artificial intelligence; AI: artificial intelligence; EEG: electroencephalogram.
Inclusion criteria: Explainable machine learning, deep learning, and AI combined with papers that include explainable are included. Only conference proceedings papers and research articles published are included. Articles concentrating explicitly on interpretable AI/XAI and approaches for ES finding using an EEG were included.
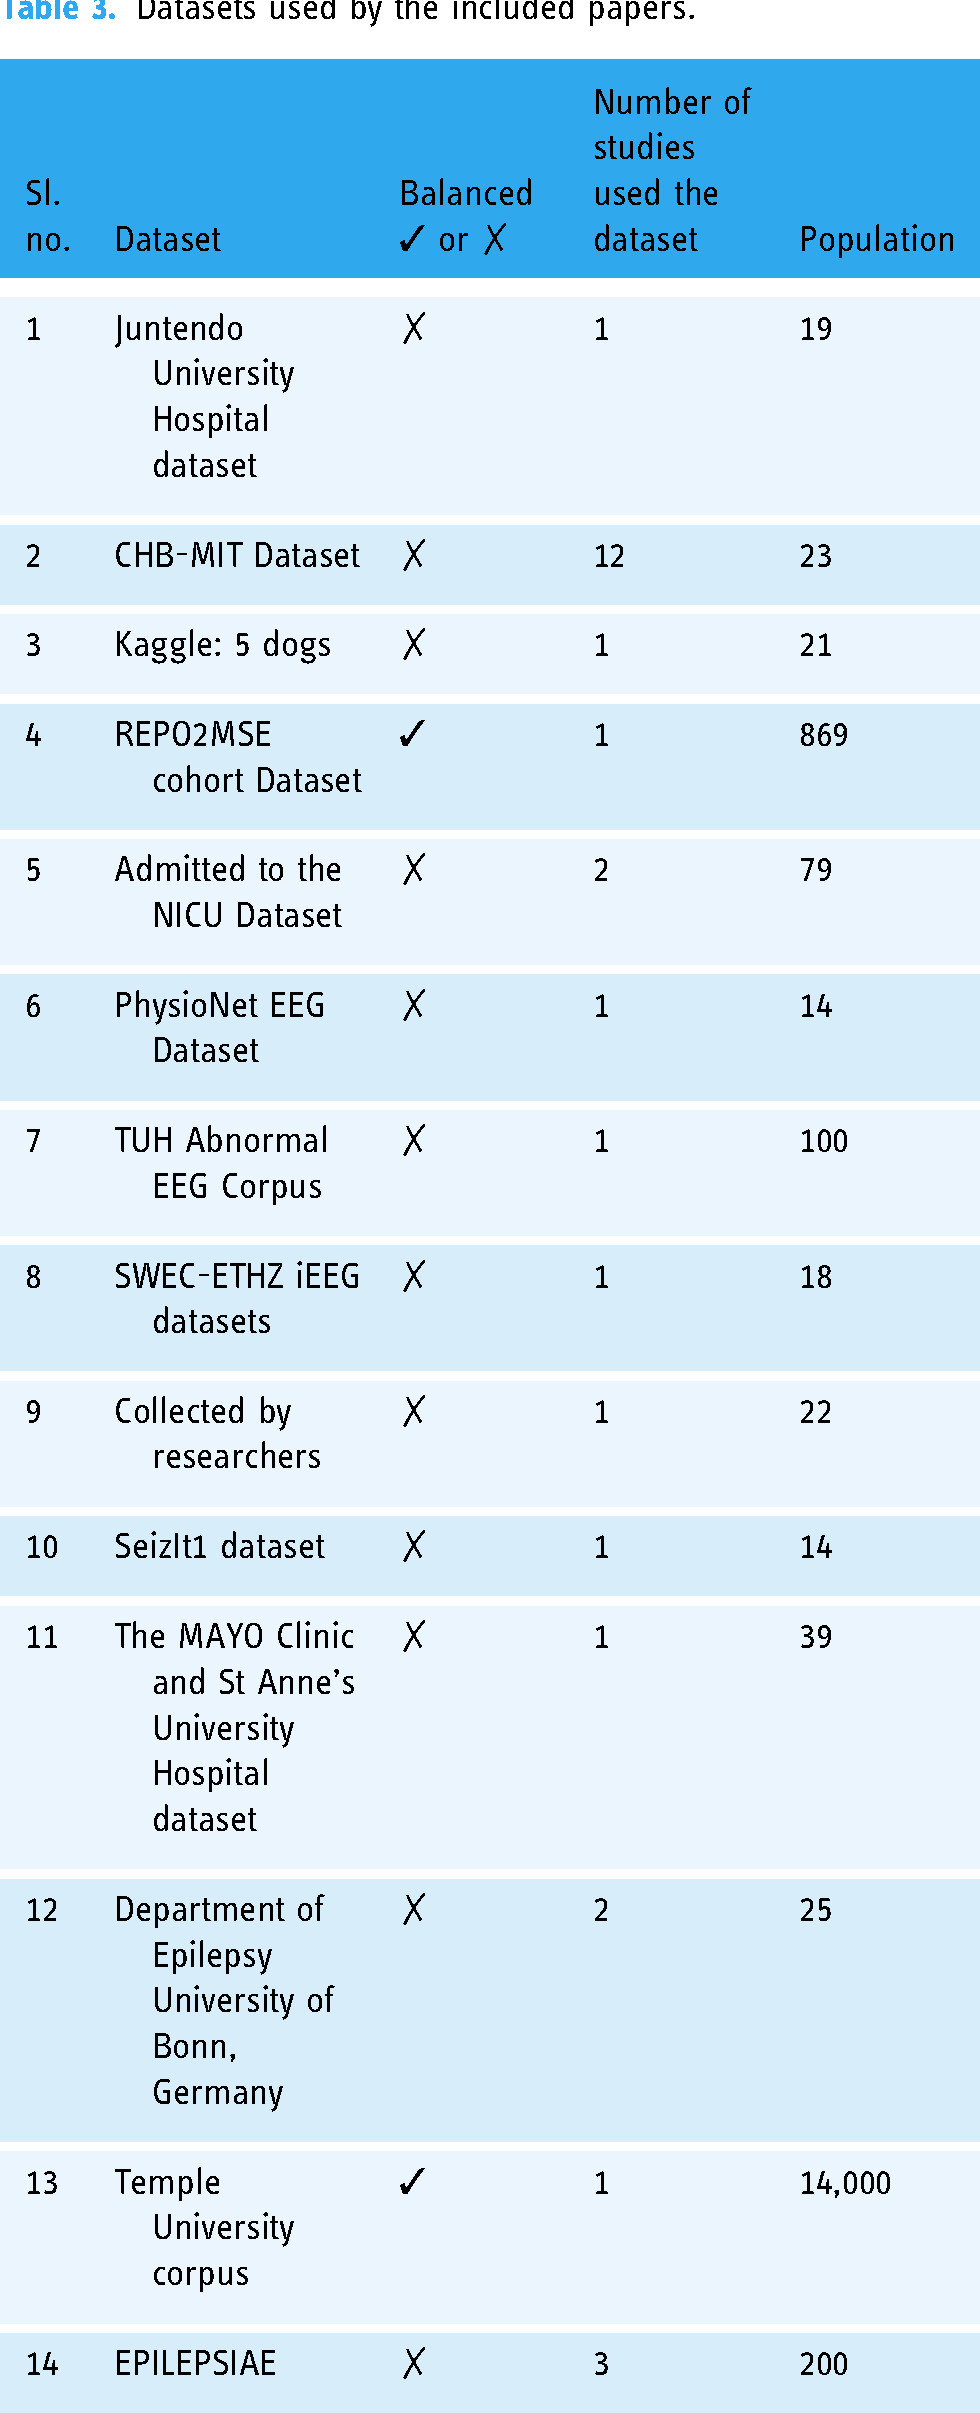
Datasets used by the included papers.
All papers commence with applicable technologies nevertheless used for dealings further than ES finding using an EEG were excluded, even though they were stated in a different place in the reports. Peer-reviewed research and conference proceedings articles on ES patients using explainable machine learning/AI/deep learning on image or physical examination are included. Papers with both title and abstract in the English language were searched on 12 November 2023 and included.
We have compared explainable machine learning diagnoses for ES patients between different patient datasets, different explainable machine learning algorithms used, natural exposure, environmental exposure, and medical exposure.
Data management
Management of references from the bibliographic databases was done using Rayyan for Systematic review. 71 Bibliographic databases such as CSV, ris, and bib were downloaded. They were imported to the online platform Rayyan for systematic review. 71 Research papers and conference proceedings were screened, identified, and reviewed using the software. The PICOS predetermined inclusion/exclusion eligibility criteria are applied to the study (Table 2). Duplicate articles were detected using the Rayyan for Systematic review. 71 The reviewers independently reviewed the detected duplicates. They label it as resolved and duplicate. Papers labeled duplicate were removed. The papers labeled resolved were added to the next process which is inclusion and exclusion using the automated Rayyan online platform. Disagreements during the screening and selection process were resolved by discussion. The duplicate detection feature was also overcome by manually comparing the digital object identifiers using Microsoft Office Excel. Full-text articles were imported into Zotero and analyzed.
Quality assessment
We have evaluated studies that lack study design, or analysis led to distorted performance or there is an inadequate model to address the research question. However, PROBAST is not designed for all multi-variable diagnostic or prognostic studies; it is good to best fit for this study. Therefore, quality and risk of bias are assessed using the Prediction Model Risk of Bias (ROB) Assessment Tool (PROBAST). Two independent reviewers (DKG and WJ) were initially evaluated for the risk of bias. We then reviewed each study using the PROBAST and disagreements between reviewers were resolved by discussion.
Subgroup analysis
Age-based, geographical region-based, and gender-based subgroup analysis was conducted. Parameters are the most risk factors for detection that were studied. An randomized controlled trials that includes plans for conducting subgroup analyses should stratify participants to treatment by target subgroups to minimize subgroup differences.
Results
This study identified 388 records from databases (PubMed = 40, ScienceDirect = 98, Google Scholar = 126, Scopus = 82, IEEE Xplore = 42) using advanced search indicated in Figure 7. Before inclusion and exclusion are applied to the screening, duplicate records were detected (n = 70). Duplicate records were removed (n = 30); 34 records were resolved and 6 were labeled not duplicates. Inclusion and exclusion criteria are defined in Table 2. Search terms defined as inclusion and exclusion criteria are given into the automation tool Rayyan. The tool highlights the inclusion terms with green and exclusion terms with red. Based on the highlighted terms in the abstract and title of the extracted papers imported into the tool, reviewers label the paper with “include,” “exclude,” or “maybe” by clicking the buttons. The papers labeled “included” are papers that have inclusion terms in their abstract and title and do not have exclusion terms. The papers labeled “exclude” are papers that have exclusion terms in their abstract and title. The papers labeled “maybe” are papers which do not have inclusion and exclusion terms in their abstract and title or need more investigations to decide or label it. After more investigations are conducted from full documents of the papers and other related resources, they are labeled as included or excluded.
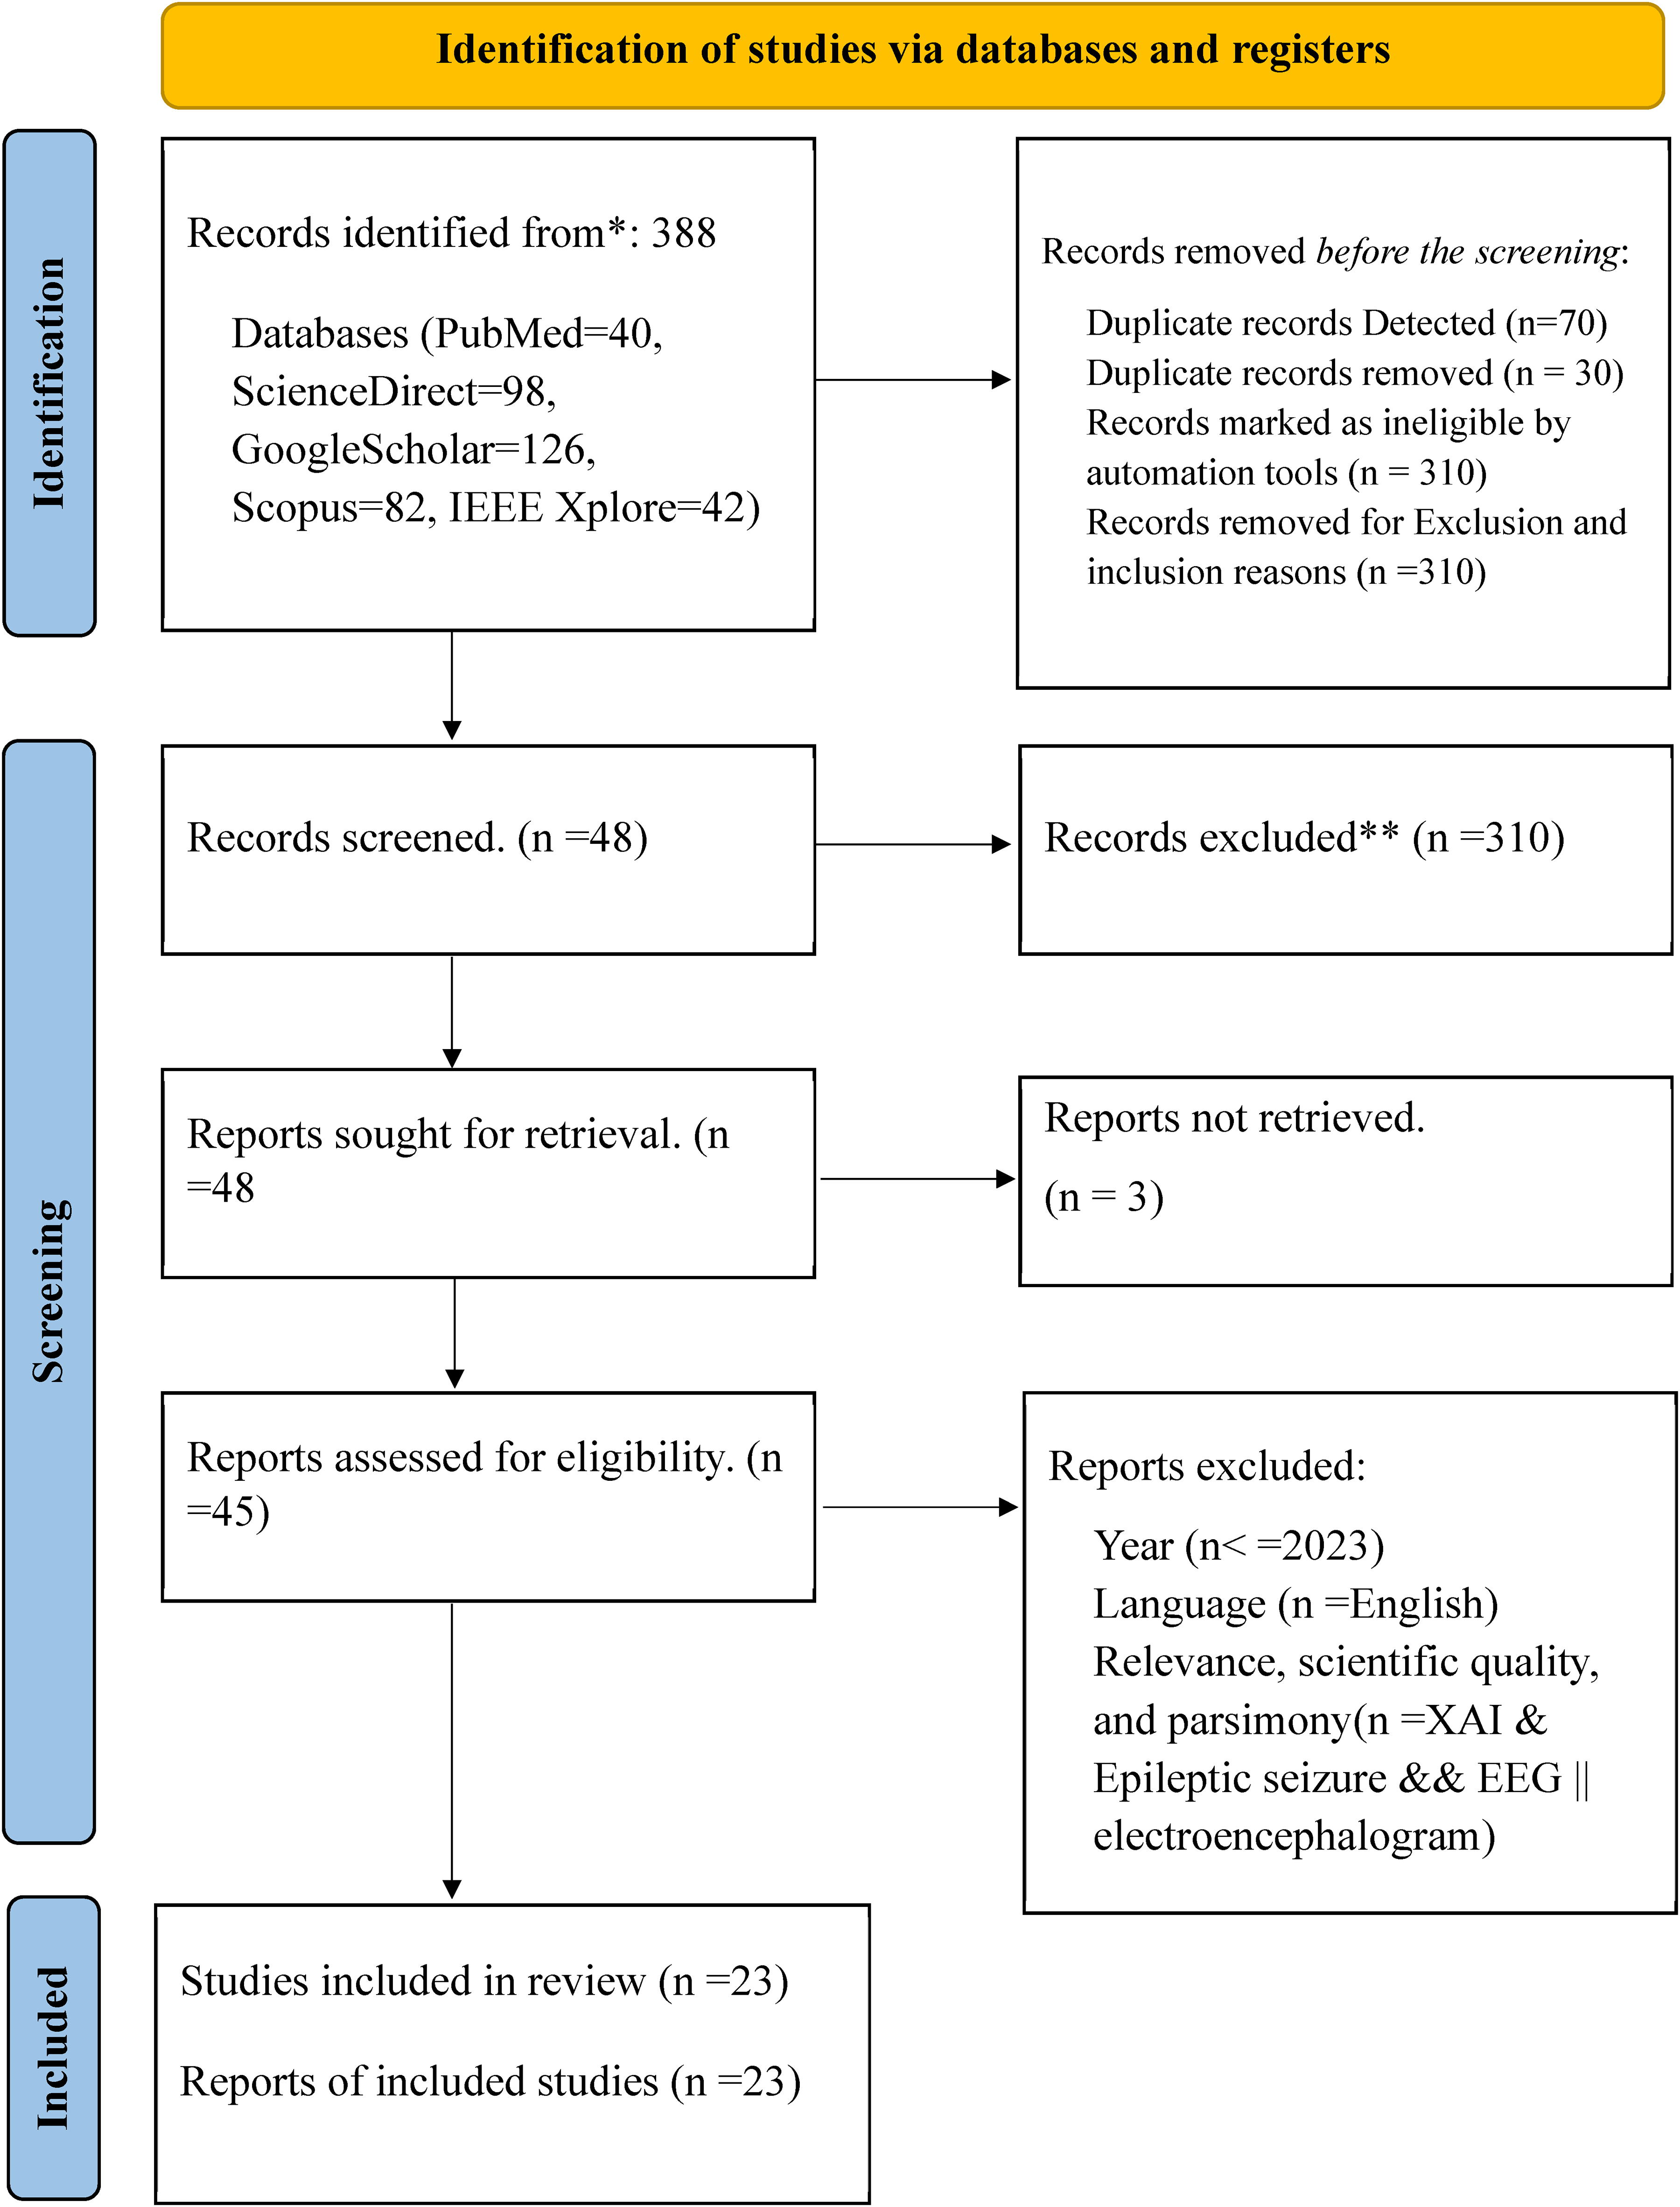
PRISMA diagram used for this study.
Records are marked as ineligible by the automation tools based on the defined search terms available in the title and abstract (n = 310) and records are excluded by exclusion and inclusion reasons (Figure 7). Forty-eight studies were screened from 388 records as eligible for the next process (Figure 7). Therefore from 48 papers, 45 papers were downloaded and read for scientific quality, relevance, parsimony, language, and year of publication. Finally, 23 papers became eligible and were selected for report writing (Figure 7).
Datasets
Fourteen different EEG datasets are used in the studies included. The dataset provided by the Boston Children’s Hospital called CHB_MIT is most frequently used in the study included. It is adopted for most experiments. 48 Twelve out of 23 (52.17%) of the included studies used this dataset (Table 4). A study 26 discussed seven EEG datasets used for the ES disease diagnosis. These datasets and their corresponding patient number and age range are as follows: the CHB-MIT Dataset is only for 23 patients and their age is limited to 1.5–22; Bonn University dataset is used for 25 patients and the age limit is not defined; and the EPILEPSIAE is used for 200 patients and the age limit is not defined. In most datasets, 12 out of 14, or 85.71% are not balanced (Table 4). Most of the papers used up-sampling and down-sampling to balance these imbalanced datasets. Only 2 out of 14 (14.28%) datasets used in the included studies used a balanced dataset. This affects the generalizability of the findings. This implies that the study needs more data collection to improve model representativeness. However up-sampling and down-sampling are used to balance datasets as optional solutions, and it is not easy to bridge research to application of interpretable AI in ES. Majority of the studies included are used neonatal and children's datasets; for example, admitted to the neonatal intensive care unit (NICU) Dataset and CHB-MIT Database. This might affect the generalizability of the findings.
Overview of reviewed papers on XAI for epileptic seizure disease diagnosis by mutually exclusive and collectively exhaustive research questions.
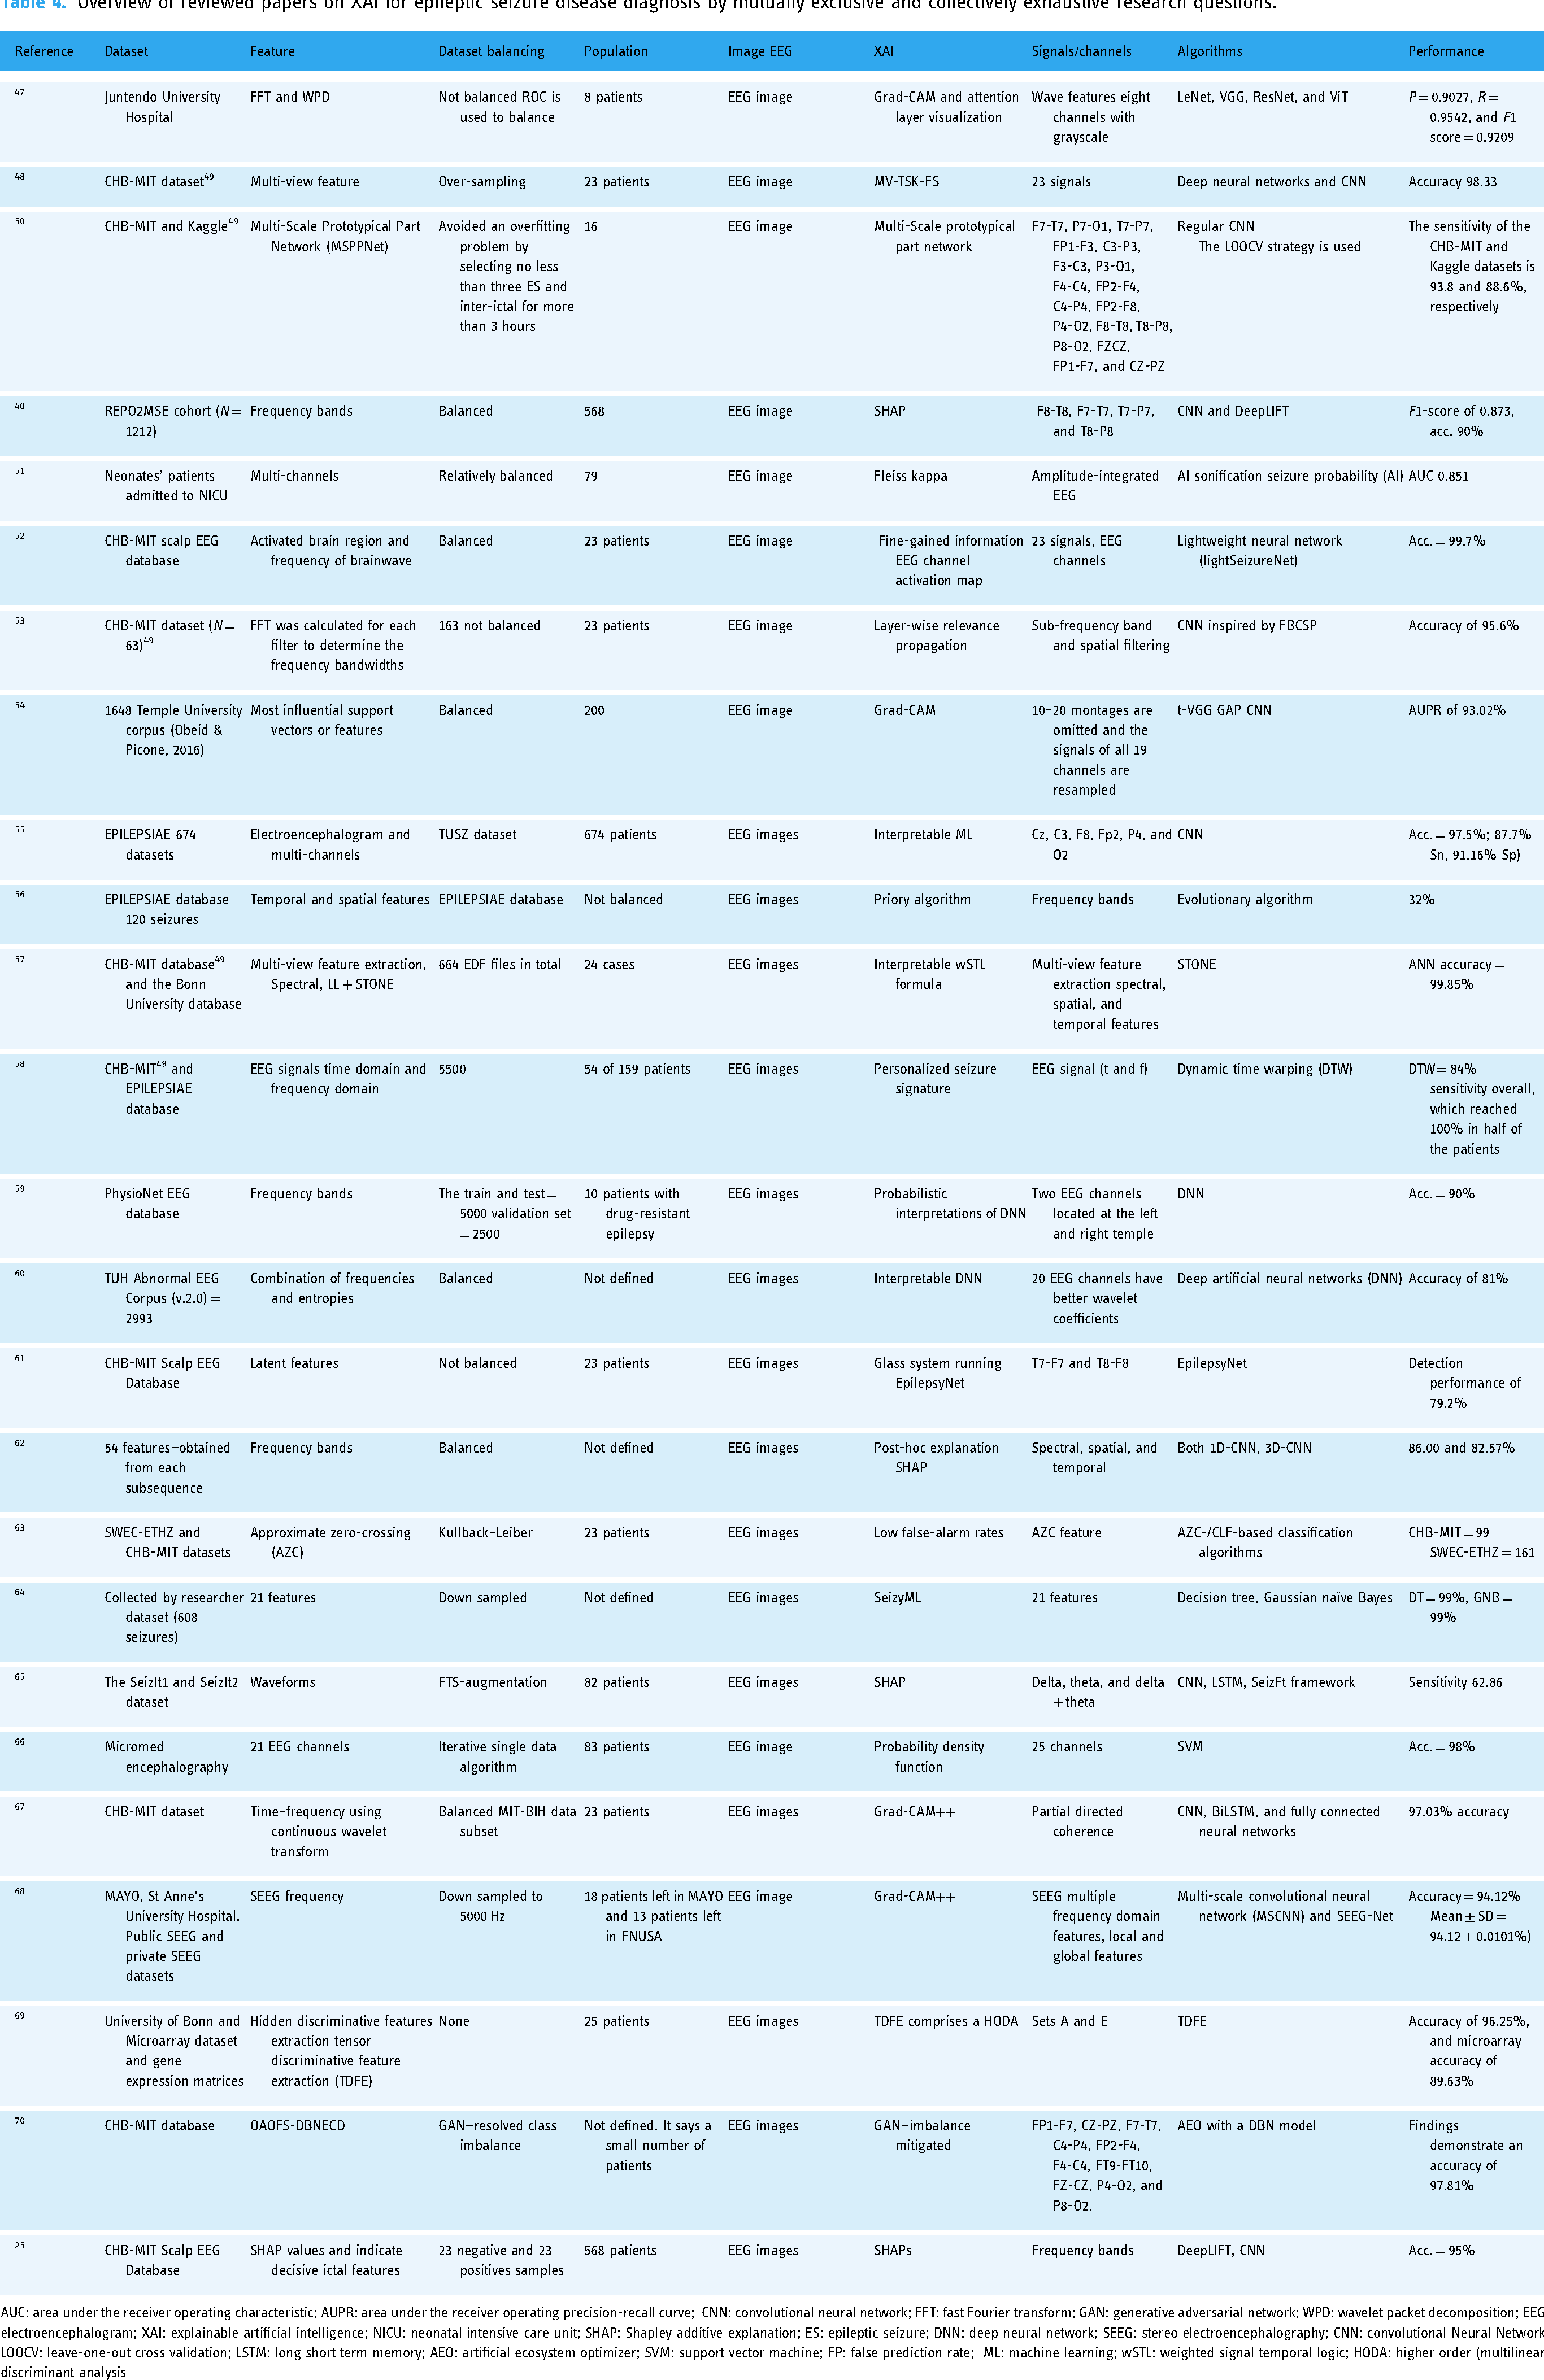
AUC: area under the receiver operating characteristic; AUPR: area under the receiver operating precision-recall curve; CNN: convolutional neural network; FFT: fast Fourier transform; GAN: generative adversarial network; WPD: wavelet packet decomposition; EEG: electroencephalogram; XAI: explainable artificial intelligence; NICU: neonatal intensive care unit; SHAP: Shapley additive explanation; ES: epileptic seizure; DNN: deep neural network; SEEG: stereo electroencephalography; CNN: convolutional Neural Network; LOOCV: leave-one-out cross validation; LSTM: long short term memory; AEO: artificial ecosystem optimizer; SVM: support vector machine; FP: false prediction rate; ML: machine learning; wSTL: weighted signal temporal logic; HODA: higher order (multilinear) discriminant analysis
Figure 7 shows which dataset is used in most of the included studies. Only two studies used more than one dataset to train and test their model. A study 63 used CHB-MIT and SWEC-ETHZ iEEG datasets; a study 57 applied the CHB-MIT datasets 49 and the Bonn University dataset; and a study 58 used CHB-MIT 49 and EPILEPSIAE databases. All datasets mentioned above (Table 4) are used in at least one paper. However, the most frequently used datasets have a small number of populations like the CHB-MIT Dataset. 49 Datasets having a large number of populations are not frequently used as expected relative to the CHB-MIT Dataset (Figure 8). Based on the above datasets we can determine that there is a spatial gap to work on. Most of the datasets are collected from a specific hospital, implying that they are from certain geographical areas. Therefore, it is difficult to bridge research and practice with available single datasets. So, it needs to merge existing datasets from different geographical areas or gather another dataset that represents diversity on the globe and different corners of the globe to overcome spatial gaps.

Datasets used by the included papers.
Features used
A study 57 discussed that most of the signals in the CHB-MIT database 49 comprise 18 or 23 frequencies. A few comprehend 24–26 frequencies. However, all are not important equally. Minimizing the number of features like signals/channels to only important features maximizes the performance of the algorithms.
Explanation algorithms used
Explanation algorithms used like Gradient Class Activation Map (GRAD-CAM), GRAD-CAM++, Shapley additive explanations (SHAP), local interpretable model agnostic explanation (LIME), and interpretable weighted Signal Temporal Logic (wSTL) formula are used in different included papers.
SHAPs use feature’s Shapley values. Feature’s Shapley values are weighed according to how well they contribute to a prediction. SHAPs and LIMEs were utilized to assess the significance of each EEG channel. 72 Additionally, the Spearman's rank correlation coefficient was calculated to analyze the relationship between the EEG features of epileptic signals and their corresponding importance values. 72
GRAD is the most used explanation algorithm when we compare it with others. It weighs the two-dimensional activations by the average gradient. It employs Shapley values to highlight areas of interest. Nevertheless, the applicability of GRADs is restricted to various families of convolutional neural network models. 73 This includes convolutional neural networks that incorporate fully connected layers, such as those from the visual geometry group, as well as networks designed for structured outputs, like captioning tasks, and those utilized in scenarios involving multi-modal inputs or reinforcement learning, all without necessitating architectural modifications. 73 Additionally, it can be integrated with current fine-grained visualizations to produce a high-resolution, class-discriminative visualization.
Improved gradient class activation map (GRAD-CAM++) is used for better localization of objects as well as explaining occurrences of multiple objects of a class in a single image when compared to GRAD. 74 The improved GRAD is like GradCAM but it uses second-order gradients.
A study 57 used CHB-MIT 49 and the Bonn University databases. Multi-view feature extraction spectral, Signal Temporal Logic (STL) plus signal temporal logic neural network (STONE) for balancing the datasets is used. So, the study reported that the artificial neural network classifier has achieved an accuracy of 99.85%. Additionally, the study used an explainable wSTL method that is like natural language.
In the future, researchers can explore self-XAI and new explanation algorithms, testing the existing algorithm findings in larger and more diverse datasets or investigating.
Tradeoffs between AI interpretability and model performance
The measure most papers consider to prove the model performance and interpretability is diverse. This resulted in tradeoffs between the AI algorithm’s interpretability and its model performance. Accuracy to interpretable trade-offs is a fundamental challenge in XAI. In epileptic diagnosis and detection, both accuracy and explanation are high priority. However, using EEG (image and video analysis) is the best option for ES diagnosis and detection. It needs complex algorithms to achieve high accuracy (Figure 9). However complex algorithms are difficult to interpret as expected. Simple algorithms are easy to interpret, however, they are difficult to discover hidden patterns within the images and videos to achieve high accuracy. This resulted in accuracy to interpretability tradeoffs due to deep learning being good at discovering hidden patterns that resulted in high accuracy. However, they are difficult to know how they discover hidden patterns even for their developers. One of these can be the cause of tradeoffs.

Accuracy to interpretability trade-off.
Simplification: Simplicity and interpretability have a direct relationship (Figure 9). Simplification is one way of making models interpretable. Simple models like linear regression are more interpretable than complex models like deep neural networks (DNNs). This is true for all machine learning models and is not limited to linear regression model. 75 Therefore, as simplicity increases the interpretation also increases. However, oversimplified models may fail to handle complex data, resulting in decreased performance. Simplicity has an inverse relationship with accuracy.
Bias in interpretability tools themselves: the tools and methods used to define the model may have their own biases, which may lead developers or users to be deceived about how the underlying model works. It is important to understand that maintaining interpretability, fairness, and efficiency in AI models often requires compromises. The goal of many developers is to find the right balance so that the model is efficient and easy to understand while minimizing bias. It is also important to carefully consider and evaluate to ensure that efforts to improve one (e.g., disclosure) do not harm the other (e.g., fairness).
Disparate impact: It turned out that when interpreting the standards, certain characteristics related to protective characteristics, such as race and gender, were referred to. Removing these features for the sake of fairness may make the model easier to interpret but may also reduce its power. Moreover, the removal of these features is not always related to bias, as bias can manifest itself in important features.
Post-hoc interpretability: Some methods interpret patterns in the black box after training. These explanations may not reflect the complex workings of the model, but they may provide people with a more “intuitive” explanation. This can lead to misunderstandings or not being trustworthy.
Feature importance misunderstood: When critical tools are used to demonstrate which input is most effective in decision-making, characteristics that affect marginalized groups can be revealed. If not treated properly, biases may go unreported or be exacerbated.
Over-reliance on interpretability: If model developers or stakeholders are concerned about the importance of interpretation, they may choose or rely on a model that is interpretable but is more likely to be accurate and biased against an unfair model because it is easier to understand.
Quality assessment
Quality assessments are evaluated based on the PROBAST. The tool creates judgments for each result and distribution of risk-of-bias judgments within each bias domain. We identified that in most of the studies, the overall risk of bias domain has a low risk of bias (Figure 10). As indicated in Figure 10 traffic light visualization diagram is used to show the existing risk of bias in the included studies. The PROBAST is limited as it is not designed for all multi-variable diagnostic or prognostic studies.

Quality assessment.
Discussion
This systematic review aims to comprehensively evaluate both the performance and interpretability of XAI methods used for ES monitoring using an EEG. To meet this objective, we have interpreted the results obtained in the section “Results” and Table 3. However, the pictorial investigative procedure of EEG data is time-consuming for clinical experts. It is indispensable for ES diagnosis. To hinge the problem AI algorithms are used for ES classification, forecasting, and diagnosis by identifying only seizures and non-seizures. These AI algorithms give low accuracy but with easy explanations. The deep learning algorithm is also used with improved and high accuracy but is difficult to understand even for the developers. Thus, the resulting deep learning algorithm is vulnerable to accuracy to explanation tradeoff. Therefore, seizures are expected to be detected with convincing accuracy and the right to explanation. Additionally, explain the detection basis, and provide reference information to clinical experts and patients to build trust.
To do so different researchers proposed different approaches. In a study, 47 some commonly used visual diagnosis mechanism models like deep residual network, very deep convolutional neural network, LeNet, and vision transformer (ViT) to the EEG image cataloging job were applied.
Random channel ordering (RCO) is a data augmentation method. It is used for adjusting a channel to generate new images. 47 Interpretation of models like Grad-CAM and attention layer methods are also used. 47
The multi-scale prototypical part network model measures the similarity between the inputs and prototypes to make final predictions by providing a transparent reasoning process and decision basis. 50 Additionally, a study 50 developed a self-interpretable deep-learning model for ES prediction.
Datasets used
A total of 14 datasets were used from 23 studies included. CHB-MIT scalp EEG database is the most used dataset; 12 papers out of 23 included papers used it. 48 This dataset is collected and adopted for the experiment from the Boston Children’s Hospital. EEG signals are acquired for more than 12 consecutive hours from a patient organized into 24 groups. Additionally, two public ES EEG datasets CHB-MIT and Kaggle are studied.
Data augmentation and balancing
Different data augmentation and balancing methods like RCO, up-sampling and down-sampling, sliding windows, and synthetic minority over-sampling technique (SMOTE) are used. Sliding windows and SMOTE are the most frequently used for dataset balancing. 50 RCO is most widely used for augmentation of the datasets. It creates an image that is slightly different from the existing minority to make a number of datasets balanced with the majority. Therefore, it enables the model to achieve good performance. 47
Feature extraction
Many feature extraction methods are used and identified by the included studies. Deep multi-view feature learning uses initial acquisitions of initial multi-view features like time–frequency signal, frequency domain signal, and time–frequency signal through discrete Fourier transform (DFT) and wavelet packet decomposition (WPD). 48 Deep multi-view feature learning will be supported by deep frequency domain feature, deep time domain feature, and deep time frequency. 48 It merges these deep multi-view features acquired into one and generates the final prediction output using deep multi-view feature learning. 48
Principal component analysis (PCA) is a commonly utilized method in computer science to minimize the number of dimensions in input data while preserving the most important variations. 76 It is a statistical technique that converts higher-dimensional data into lower-dimensional representations.
Fast Fourier transform (FFT) is a mathematical method that transforms a signal from the time domain into the frequency domain. 77 It decomposes the original arrangement into a series of short sequences. 77 It has speed and memory efficiency over DFT.
WPD initially referred to as optimal sub-band tree structuring, is also called wavelet packet decomposition (WPD), and at times simply as wavelet packets or sub-band tree. 78 This method is a wavelet transform that processes the discrete-time (sampled) signal through a greater number of filters compared to the DWT. 79
A study 48 stated that a feature extraction method called deep multi-view is identified as better performing than PCA, FFT, and WPD. Using the methods, the accuracy of the model is improved by 4%. 48 Time, frequency, and time–frequency domain features are used as input by FFT and WPD. 48
Performance
A study 50 has been tested on two datasets. The algorithm they used resulted in 93.8% sensitivity and 0.054/h false prediction (FP) rates on the CHB-MIT dataset and 88.6% sensitivity and 0.146/h FP rate on the Kaggle dataset. 50
Additionally, a study 50 identified that deep learning is rarely implemented in medicine and is not trusted by doctors because there is insufficient explanation of neural network models. Therefore, online detection of ESs through deep learning models from EEG signals requires relating some properties of the model with expert clinical knowledge.
A study 25 reported on three aspects of deep learning provided on a large time scale from the aggregation of classification results on signal segments. Visual interpretation of EEG-based relevant frequency patterns learned based on activation differences was highlighted. Using the DeepLIFT method, their relation with gamma, beta, delta, and theta frequency bands and identification of signal waveforms were performed toward the ictal class.
Generally, studies used merging more than one dataset and simplified the algorithm maintaining high accuracy when we compared with studies that used only one dataset. A study 52 used a lightSeizureNet to overcome the performance and interpretability tradeoff due to complexity. So, this study maintained an accuracy of 99.7%.
A study 57 used CHB-MIT 49 and the Bonn University database. Multi-view feature extraction spectral, LL + STONE is used to balance the datasets. The study reported that the artificial neural network classifier achieved an accuracy of 99.85%. Additionally, the study used an interpretable wSTL formula. It is easy to understand because it is homogeneous to natural language.
XAI used
Processing EEG images enables suppleness to use various algorithms like deep learning and machine learning models. The included studies used the following algorithms for explanations: Grad-CAM++, SHAPs, Grad-CAM, interpretable wSTL formula, MV-TSK-FS, Grad-CAM and attention layer visualization, MV-TSK-FS, multi-scale prototypical part network, Fleiss kappa, fine-gained information EEG channel activation map, layer-wise relevance propagation, Grad-CAM, interpretable machine learning (ML), priory algorithm, personalized seizure signature, probabilistic interpretations of DNNs, interpretable DNN, glass system running EpilepsyNet, post-hoc explanation, low false-alarm rates, SeizyML, probability density function, tensor discriminative feature extraction comprises a higher order (multilinear) discriminant analysis (HODA), and generative adversarial network (GAN-imbalance mitigated (Table 4). Visual explanation like SHAPs was most frequently used (four times) in the included studies and gradient class activation mapping (two times) and enhanced gradient class activation mapping (two times) are the most widely used explanation algorithms for this problem. The GRAD and attention layer methods calculated the measure of seizure degree and explained the model very well. 47 Visual explanation is the most common form of interpretable AI in medical image analysis; it is also called saliency mapping. 80 It shows the region of interest of an image for a decision. 80
The GRAD method was used to examine forecasts completed by the t-VGG GAP prototypical and structures that allowed the model to make accurate verdicts. The heat maps resulting from the GRAD system were then overlapped on the novel input and reoccurring shapes were recognized. The model offered the capability to distinguish inter-ictal spikes and subordinate them with a positive diagnosis. Additionally, it is accomplished to designate other known features that are discriminatory for ES, such as ES emancipations, trips to patients, and public involvement.
Tradeoffs between AI interpretability and model performance
Accuracy and interpretability most of the time have an inverse relationship. This resulted in tradeoffs between the AI algorithm’s interpretability and its model performance. From 23 studies, 21 papers (91.3%) used deep learning algorithms. This is natural; deep learning algorithms are good in image and video processing. EEG and iEEG are image data used to diagnose and monitor ES processing. As you can observe from Table 3, 92.3% of studies used deep learning. Their accuracy was more than 95%. However, deep learning algorithms are not easy to interpret, even difficult for their developers to know how they discover the hidden pattern. Additionally, studies used decision tree algorithms and linear algorithms but the accuracy is less. Nature of these trade-offs and the factors that influence them are simplification and complexity of the algorithms, bias in interpretability tools themselves, disparate impact, post-hoc interpretability, feature importance misunderstood, feature importance misunderstood, and over-reliance on interpretability. Therefore, the tradeoffs between AI interpretability and model performance are from the nature of the algorithms and problem.
Limitations of existing work and future lines of work
In the included papers there is a lack of working on the onset early warning of the ES disease, before the patients are vulnerable to sudden unexpected death. ES diagnosis needs onset early warning to save life from sudden death because of accidents like falling into fire and holes. Additionally, patients are victims of stigmas and discrimination resulting from failure in public and work areas.
To make the dataset balanced, a study 62 did not use the entire dataset defined. The method of excluding some datasets is not defined well. A subgroup of neonatal captured was selected. They did not eliminate waveform pieces. 62 This may have affected the classifiers’ performance. A study 62 recommends clinicians to validate the practical worth of XAI4EEG for medical decision-making. Additionally, a study 51 recommended EEG sonification to detect neonatal seizures as an alternative.
AI machine users like medical professionals and patients have the right to know why and how it made a decision. Saliency detection and interpretable AI are some of the study areas that intend to alleviate the hazards. 51 However, we observe a strong trade-off between the accuracy and performance of XAI/interpretable AI models. 51
Implications for clinical practice
Interpretable AI methods are the best option today to apply to clinical practice. However, the existing state-of-the-art has spatial, temporal, methodological, and theoretical gaps. There is also an imbalance in datasets. The number of populations analyzed in the included studies is not enough for clinical practices. There is also subgroup imbalance like neonatal, children, adolescents, and adults. The dataset balancing within the gender category is also not considered. Based on location, ethnicity, geographical location, and life standards balance should be considered during data collection. Therefore, to bridge the research and clinical practice for ES, a huge and comprehensive research project which overcomes these stated gaps should be conducted.
Conclusion
In total, 23 papers qualified and were chosen for writing reports. The studies incorporated 14 distinct EEG datasets. The CHB_MIT dataset was utilized in the majority of the experiments, with 12 out of 23 studies (52.17%) relying on this particular dataset. Most researchers focused on up-sampling/down-sampling the number of populations within the datasets to achieve balance or normalization during the preprocessing phase. The total number of individual populations utilized is 15,443, with 15,438 being humans and 5 being dogs. The included studies accounted for a total of 16,200 populations. Additionally, six papers employed multiple datasets. An average of 1103.071 populations was utilized across the studies. The most frequently used datasets were those that fall below the average. Out of the 14 datasets, 11 (78.57%) were below the average, while 3 datasets (21.43%) exceeded that average. The foundational discoveries of the model were thoroughly outlined, calculating values to assess the ES degree via the GRAD and attention layer. Multi-view feature extraction methods, including spectral, LL, and STONE for dataset balancing, indicated that the artificial neural network classifier achieved an impressive accuracy rate of 99.85%. Furthermore, the study employed an interpretable wSTL formula that aligns with natural language. Onset early warning allows patients and their caregivers to take preemptive measures based on the provided recommendations, thereby reducing potential harm from improper management before the onset of the disease. Overall performance metrics, such as accuracy, sensitivity, specificity, precision, and recall, were noted in the included studies; however, they are not ideally suited for XAI models. Current state-of-the-art approaches exhibit spatial, temporal, methodological, and theoretical gaps. Consequently, to align research with clinical practice for ESs, a significant and comprehensive research initiative that addresses these gaps is necessary. Although interpretable AI faces challenges in balancing interpretability and performance trade-offs in the context of ESs, it is still utilized for diagnosis purposes. Despite the variety of XAI techniques used, SHAP, Grad-CAM, and Grad-CAM++ remain the most commonly employed explanation algorithms. Our assessment reveals that the included studies did not validate the existence of interpretability and performance trade-offs. Addressing this trade-off is still a significant challenge and a promising area for future exploration. Although different studies analyzed various frequency bands, the most effective waveforms identified in XAI models for detecting ESs involved 18 channels. The study with the highest performance among those included utilized multi-view feature extraction focusing on spectral, spatial, and temporal features. While providing interpretations in plain language is vital, employing the region of interest for EEG-based monitoring of ESs is highly recommended as an explicative method. Among the included papers, research utilizing 18–23 brain EEG frequency bands achieved high accuracy in diagnosing ESs.
Limitations and strengths of the study
Strengths of this study are Rayyan online platform for systematic review is used for duplicate detection, and inclusion and exclusion keyword detection within extracted papers. This platform enables reviewers to easily label the papers imported to it, take notes for each paper, and enable reviewers to search easily for more information. It is also a good environment for reviewers to work independently and follow one another their progress. Every paper published before 12 November 2023 and fulfilling inclusion and exclusion criteria was included.
Limitations of this study are the papers that used the keyword defined in inclusion keywords but not found in the title and abstract are not included. Additionally, papers with both title and abstract in the English language only and published until 12 November 2023 were included. The potential impact of these limitations on the review findings and their generalizability is very low.
Supplemental Material
sj-docx-1-dhj-10.1177_20552076251325411 - Supplemental material for A comprehensive evaluation of interpretable artificial intelligence for epileptic seizure diagnosis using an electroencephalogram: A systematic review
Supplemental material, sj-docx-1-dhj-10.1177_20552076251325411 for A comprehensive evaluation of interpretable artificial intelligence for epileptic seizure diagnosis using an electroencephalogram: A systematic review by Daraje Kaba Gurmessa and Worku Jimma in DIGITAL HEALTH
Supplemental Material
sj-docx-2-dhj-10.1177_20552076251325411 - Supplemental material for A comprehensive evaluation of interpretable artificial intelligence for epileptic seizure diagnosis using an electroencephalogram: A systematic review
Supplemental material, sj-docx-2-dhj-10.1177_20552076251325411 for A comprehensive evaluation of interpretable artificial intelligence for epileptic seizure diagnosis using an electroencephalogram: A systematic review by Daraje Kaba Gurmessa and Worku Jimma in DIGITAL HEALTH
Supplemental Material
sj-xlsx-3-dhj-10.1177_20552076251325411 - Supplemental material for A comprehensive evaluation of interpretable artificial intelligence for epileptic seizure diagnosis using an electroencephalogram: A systematic review
Supplemental material, sj-xlsx-3-dhj-10.1177_20552076251325411 for A comprehensive evaluation of interpretable artificial intelligence for epileptic seizure diagnosis using an electroencephalogram: A systematic review by Daraje Kaba Gurmessa and Worku Jimma in DIGITAL HEALTH
Supplemental Material
sj-xlsx-4-dhj-10.1177_20552076251325411 - Supplemental material for A comprehensive evaluation of interpretable artificial intelligence for epileptic seizure diagnosis using an electroencephalogram: A systematic review
Supplemental material, sj-xlsx-4-dhj-10.1177_20552076251325411 for A comprehensive evaluation of interpretable artificial intelligence for epileptic seizure diagnosis using an electroencephalogram: A systematic review by Daraje Kaba Gurmessa and Worku Jimma in DIGITAL HEALTH
Footnotes
Acknowledgments
First and foremost, Daraje Kaba Gurmessa would like to thank his PhD supervisor, Dr Worku Jimma. His constant support, guidance, and encouragement have been invaluable throughout the entire process of this paper. Gurmessa is profoundly grateful for the immeasurable contributions he made to his development. Second, Gurmessa appreciates Jimma University in general and the information science department in particular for running this program and providing him the opportunity. Last but not least, Gurmessa would like to also appreciate Mattu University for allowing him to earn his PhD.
Contributorship
DKG drafted the title and protocol registration and started the review. WJ reviewed the DKG works and added his contributions. Both authors independently include and exclude papers. The conflicts are resolved by discussion between both authors. Finally, the results are produced by DKG, and WJ reviews them and adds his contributions.
Declaration of conflicting interests
The authors declared no potential conflicts of interest with respect to the research, authorship, and/or publication of this article.
Funding
The authors received no financial support for the research, authorship, and/or publication of this article.
Data availability
Data are available upon reasonable request.
Supplemental material
Supplemental material for this article is available online.
References
Supplementary Material
Please find the following supplemental material available below.
For Open Access articles published under a Creative Commons License, all supplemental material carries the same license as the article it is associated with.
For non-Open Access articles published, all supplemental material carries a non-exclusive license, and permission requests for re-use of supplemental material or any part of supplemental material shall be sent directly to the copyright owner as specified in the copyright notice associated with the article.