
Abstract
Background
Obesity and severe knee osteoarthritis (KOA) lead to significant gait and muscle adaptations. However, the relationship between core muscle strength and the severity of KOA in obese patients remains unclear. This study aimed to determine the association between muscle strength adaptation and the severity of KOA in obese individuals.
Methods
We recruited 119 obese participants with unilateral KOA from January 2021 to December 2023, all classified with mild to moderate KOA grades. KOA severity was assessed using the Western Ontario and McMaster University Osteoarthritis Index (WOMAC), which categorized participants into two groups based on disease severity. Electromyographic data from the psoas, gluteus medius, vastus lateralis, vastus medialis, rectus femoris, medial gastrocnemius, lateral gastrocnemius, tibialis anterior, and biceps femoris muscles were collected during isometric and dynamic knee extension.
Results
Significant differences were observed in all selected muscles between the affected knee joint and the contralateral side during both dynamic and isometric knee extensions. The difference in electromyographic data—including mean absolute value (MAV), root mean square (RMS), and center frequency (CF)—was significantly different across groups categorized by KOA severity. Notably, the MAV values of the vastus medialis, lateral gastrocnemius, and biceps femoris, as well as the CF values of the medial and lateral gastrocnemius, showed no significant differences in some instances during both dynamic and isometric extensions.
Conclusion
This study indicates that obese individuals with KOA exhibit lower muscle intensity and higher fatigability in comparison to the contralateral side during both isometric and dynamic knee extensions. Furthermore, significant reductions in muscle intensity were observed in the psoas, gluteus medius, vastus lateralis, rectus femoris, medial gastrocnemius, and tibialis anterior muscles, correlating with the advanced severity of KOA.
Introduction
Knee osteoarthritis (KOA) affects more than 250 million individuals worldwide and is a leading cause of disability in older adults. 1 The economic burden of osteoarthritis is considerable, with healthcare expenses related to KOA estimated to account for 1% to 2% of the gross national product (GNP) in some developed countries, including the United States and European nations. This financial impact reflects both direct costs, such as medical treatments and surgeries, and indirect costs, including lost productivity and long-term disability support. The prevalence of KOA increases with age, and data suggest that approximately 30% of individuals over 60 years old experience symptoms of KOA.2–4 However, this rate varies considerably by region and population characteristics. Higher prevalence rates are generally reported in developed nations, likely due to longer life expectancies, higher body mass index averages, and lifestyle factors, while lower rates are reported in some developing regions where life expectancy and demographic factors differ. As global populations age, the overall burden of KOA is expected to rise, impacting healthcare systems worldwide.2–4 As the aging population increases, the demand for surgical interventions to alleviate symptoms related to KOA is projected to rise. These interventions often include total knee arthroplasty, particularly for patients experiencing severe symptomatology. However, other surgical options may also be appropriate depending on the individual case and severity of symptoms.
Obesity can induce KOA through mechanisms beyond the increased mechanical load on the joints; it can also lead to muscle dysfunction, which plays a crucial role in the development and progression of KOA. This connection between obesity and muscle dysfunction in the context of KOA is multifaceted and includes factors like altered biomechanics, inflammation, and changes in muscle strength and composition. 5
Clinical gait analysis is a highly effective technique for obtaining accurate and objective biomechanical information, including temporal waveforms, for each lower body joint. 6 The assessment tools used for gait quantification include 3D motion capture, force plates, instrumented mats, wearable sensors equipped with inertial measurement units and surface electromyography (sEMG). 7 Because gait dysfunction can be objectively assessed using sEMG, it has been proposed as an alternative means of evaluating patient disabilities.6–8 sEMG is a non-invasive technique increasingly used for evaluating KOA. It involves recording the electrical activity produced by skeletal muscles, which can be indicative of muscle function and health. sEMG is advantageous as it is less invasive and painful compared to intramuscular EMG, with minimal risk of infection. sEMG's role in KOA assessment is gaining importance, particularly in developing models that help in the diagnosis and evaluation of the condition. Recent studies have shown that sEMG can effectively assess muscle activity patterns in patients, allowing for more personalized rehabilitation strategies and better monitoring of treatment outcomes. 9 As the field evolves, sEMG's role in providing objective measurements of muscle performance makes it a valuable tool in understanding and managing KOA.
In this cross-sectional study, we examined the association of the psoas, gluteus medius, vastus lateralis, vastus medialis, rectus femoris medial gastrocnemius, lateral gastrocnemius, tibialis anterior and biceps femoris muscles strength as well fatigability with WOMAC scores in obese patients with KOA based on sEMG parameters, including mean absolute value (MAV), root mean square (RMS), and center frequency (CF). The WOMAC, or Western Ontario and McMaster University Osteoarthritis Index, consists of three subscales: pain, stiffness, and physical function. Our hypothesis was that muscle weakness and fatigability would closely correspond to the WOMAC and its three subscales and that specific status would change as the disease progressed. By analyzing these relationships, we aim to enhance our understanding of the interplay between muscle strength, obesity, and KOA, ultimately informing rehabilitation strategies and the application of electromyographic analysis.
Methods
Participants
This study was approved by the Ethics Committee of Shanghai Sixth Peoples's Hospital (IRB: 2016-110) and was performed in accordance with the relevant guidelines and regulations. Written informed consent was obtained from all the participants. This study recruited medically obese patients with unilateral KOA who have various degrees of knee pain from January 2021 and December 2023 through advertisements in outpatient buildings and on official social media of Shanghai Sixth Peoples's Hospital.
Participants were excluded for: (a) any prior knee surgery in the lower extremities; (b) record of intra-articular injection of knee within the past 6 months; (c) steroid use within the previous 4 weeks; (d) hip or ankle arthritis or spinal disease on a radiograph; (e) autoimmune arthritis; (f) history of knee/hip replacement or osteotomy; (g) history of knee fracture or lower-limb deformity; (h) inability to walk normally; and (i) inability to communicate normally or poor medical compliance.
A total of 121 medically obese participants with unilateral KOA, ranging in age from 40 to 75 years, were recruited between January 2021 and December 2023 with different KOA grades.
Data collection
Preparation and electrode placement
The portable JoyMotion® (Shanghai Medical Management Co., Ltd, Shanghai, China) sEMG equipment was used to record sEMG activity. The equipment settings included a low-frequency filter of 20 Hz, a high-frequency filter of 1000 Hz, and a common-mode rejection ratio of over 110 dB. Prior to electrode placement, the skin was cleaned with alcohol to decrease signal impedance. Active electrodes were positioned over the motor points of the psoas, gluteus medius, vastus lateralis, vastus medialis, rectus femoris medial gastrocnemius, lateral gastrocnemius, tibialis anterior and biceps femoris muscles for both affected limb and contralateral limb.
Signal normalization procedure
After electrode placement, three amplitude normalization tests were performed for each investigated muscle separately to allow for quantitative comparison of sEMG data between participants. Prior to the normalization tests, each participant completed a warm-up sequence, consisting of stretching for 5 minutes.
During each normalization test, participants received both visual and verbal feedback. The visual feedback was presented as a real-time waveform display of the sEMG signal on a screen, which allowed participants to see the amplitude and fluctuations in muscle activity as they gradually increased their force output. The verbal feedback involved instructions and encouragement from the researcher to guide participants through the process. Participants were instructed to slowly increase their force output until reaching maximum effort, which they held for 3 seconds before relaxing. Each muscle underwent this normalization test three times, with a rest period of 30 to 60 seconds between tests.
Normalization was achieved using the gold standard maximum voluntary isometric contraction (MVIC) test for the muscles gluteus medius, vastus lateralis, vastus medialis, rectus femoris, medial and lateral gastrocnemii, tibialis anterior, and biceps femoris. These MVIC tests were conducted using the Myonline Professional system by DIERS International GmbH, Germany, during a muscle strength assessment. Participants were seated securely on the device, ensuring their pelvis was snug against the backrest. Their lower legs were positioned between the leg extension/flexion pads, and they were fastened with pelvic/hip and thigh straps. The tests involved participants performing maximal knee extension, knee flexion, and ankle dorsiflexion against the rear pad at the ankle joint, one leg at a time, while the non-tested leg remained relaxed and supported.
The normalized data were calculated as follows:
Peak Detection: The highest amplitude recorded during the MVIC tests for each muscle served as the normalization peak. Proportion Transformation: sEMG signals recorded during the dynamic and isometric tasks were transformed by dividing each value by the respective peak amplitude and expressing it as a percentage. This transformation ensured that all subsequent analyses were relative to the maximum capacity observed for each muscle, allowing for standardized comparison across individuals.
By transforming the data into proportion values, we were able to analyze muscle activation as a percentage of each muscle's maximum capacity, reducing the influence of inter-individual variability in absolute sEMG values.
Signal acquisition
After the normalization tests, participants were instructed to perform one normal isometric extension of the knee and a one-leg standing task for 30 seconds. This procedure was designed to capture the sEMG signals during activities that mimic functional movements relevant to daily living, allowing for a more accurate assessment of muscle activation patterns in response to these tasks. By recording muscle activity during both isometric contraction and dynamic stabilization, we aimed to analyze the muscle performance under conditions that closely reflect the functional challenges faced by individuals with KOA.
Signal processing
Data was digitized and stored in CSV format for processing. Data analysis was performed using Python (Version 3.9.10), Key libraries utilized included: (a) NumPy (Version 1.21.3): Used for efficient numerical computations with arrays and matrices; (b) SciPy (Version 1.3.1): Employed for signal processing tasks, including filtering and Fourier transformations; (c) Matplotlib (Version 3.6): Used for generating plots of the signals for visualization; (d) Pandas (Version 2.0): Utilized for data manipulation and extraction. The code for data loading, filtering of raw signals, as well as rectification and smoothing is demonstrated in Supplemental Materials.
Feature extraction
There are two major group parameters that are computed for EMG evaluation, including time and frequency domain parameters. In time domain, RMS is a commonly used measure in sEMG to quantify the level of muscle activity.10–12 It helps in assessing the signal amplitude in a way that is unaffected by the polarity of the signal, providing a measure of the power of the electrical activity produced by the muscles.10–12 In the context of sEMG, RMS is a statistical measure that represents the effective value of the total electrical activity of the muscle as captured by EMG.10–12 It is particularly useful because it takes both the amplitude and the frequency of the signal into account, offering a comprehensive measure of muscle activation.
The MAV is another commonly used feature in sEMG for analyzing muscle activity. It provides a simple and effective measure of the muscle's electrical activity during a given time period.10,13 MAV is the average of the absolute values of the EMG signal amplitude over a specified time period. It represents the overall level of muscle activation, ignoring the polarity of the signal.10,13 MAV is particularly useful because it's relatively easy to compute and is less sensitive to noise, making it ideal for real-time monitoring and analysis in clinical and research settings.10,13
MAV is particularly useful in detecting the onset of muscle activity and can be used in various applications, including muscle fatigue analysis, rehabilitation, and sports sciences.
In frequency domain, the parameter of CF is a parameter used to analyze the frequency content of EMG signals. 14 It provides insights into the muscle's behavior under various conditions, such as fatigue. 14 It is generally used to assess changes in the frequency content of EMG signals over time, which can indicate muscle fatigue; as muscles fatigue, the CF typically shifts to lower frequencies. 14 CF is especially useful in studies focusing on muscle physiology, rehabilitation, and ergonomics.
Statistical analysis
All statistical analyses were performed using IBM SPSS. Initially, groups were compared based on baseline characteristics. For continuous variables, Student's t-tests were conducted. Categorical variables were analyzed using Chi-squared tests or Fisher's exact tests when appropriate.
The sEMG signals of the normalization tests and isometric extension as well as one-leg standing task were full-wave rectified and enveloped with RMS, MAC and CF algorithm with a 50-millisecond window. 9 Each sEMG signal during the isometric extension as well as one-leg standing task was normalized to the corresponding peak value of three normalization tests.
To analyze the relationship between muscle weakness and WOMAC scores, severity was categorized into three groups: mild, moderate, and severe. Each WOMAC question has five possible responses, ranging from none to extreme. The cut-offs for severity were determined by multiplying the midpoint between mild and moderate (1.5) and the midpoint between moderate and severe (2.5) by 24 (the total number of WOMAC questions). Scores below 36 were considered mild, scores between 36 and 60 were considered moderate, and scores above 60 were classified as severe.
Data are presented as mean ± SD. The Shapiro–Wilk test assessed the normality of quantitative data. Continuous variables that followed a normal distribution were compared using the two independent samples t-test, while the Wilcoxon–Mann–Whitney U test was applied for non-normally distributed variables. The Chi-squared test evaluated qualitative data. A one-way analysis of variance (ANOVA) was conducted to compare groups based on KOA severity. Given the potential for multiple comparisons, we adopted a significance threshold of 0.0001 to reduce the likelihood of Type I errors. For further adjustments, a revised significance level of <0.00003 was established based on the Bonferroni method, reflecting the need for stringent criteria in the context of multiple tests performed within this study. 15
Results
Demographic characteristics of participants
In total, 121 obese participants were enrolled in this study, and participants’ demographics characteristics and symptomatic severity were summarized in Table 1. Based on the results of the WOMAC scores, 75 participants were categorized into the mild group, 44 participants were categorized into the moderate group, and 2 participants were categorized into the severe group. However, the 2 participants in the severe group failed to complete the normalization tests. As a result, only participants from the mild and moderate groups were able to perform signal extraction and data analysis.
Subject characteristics.
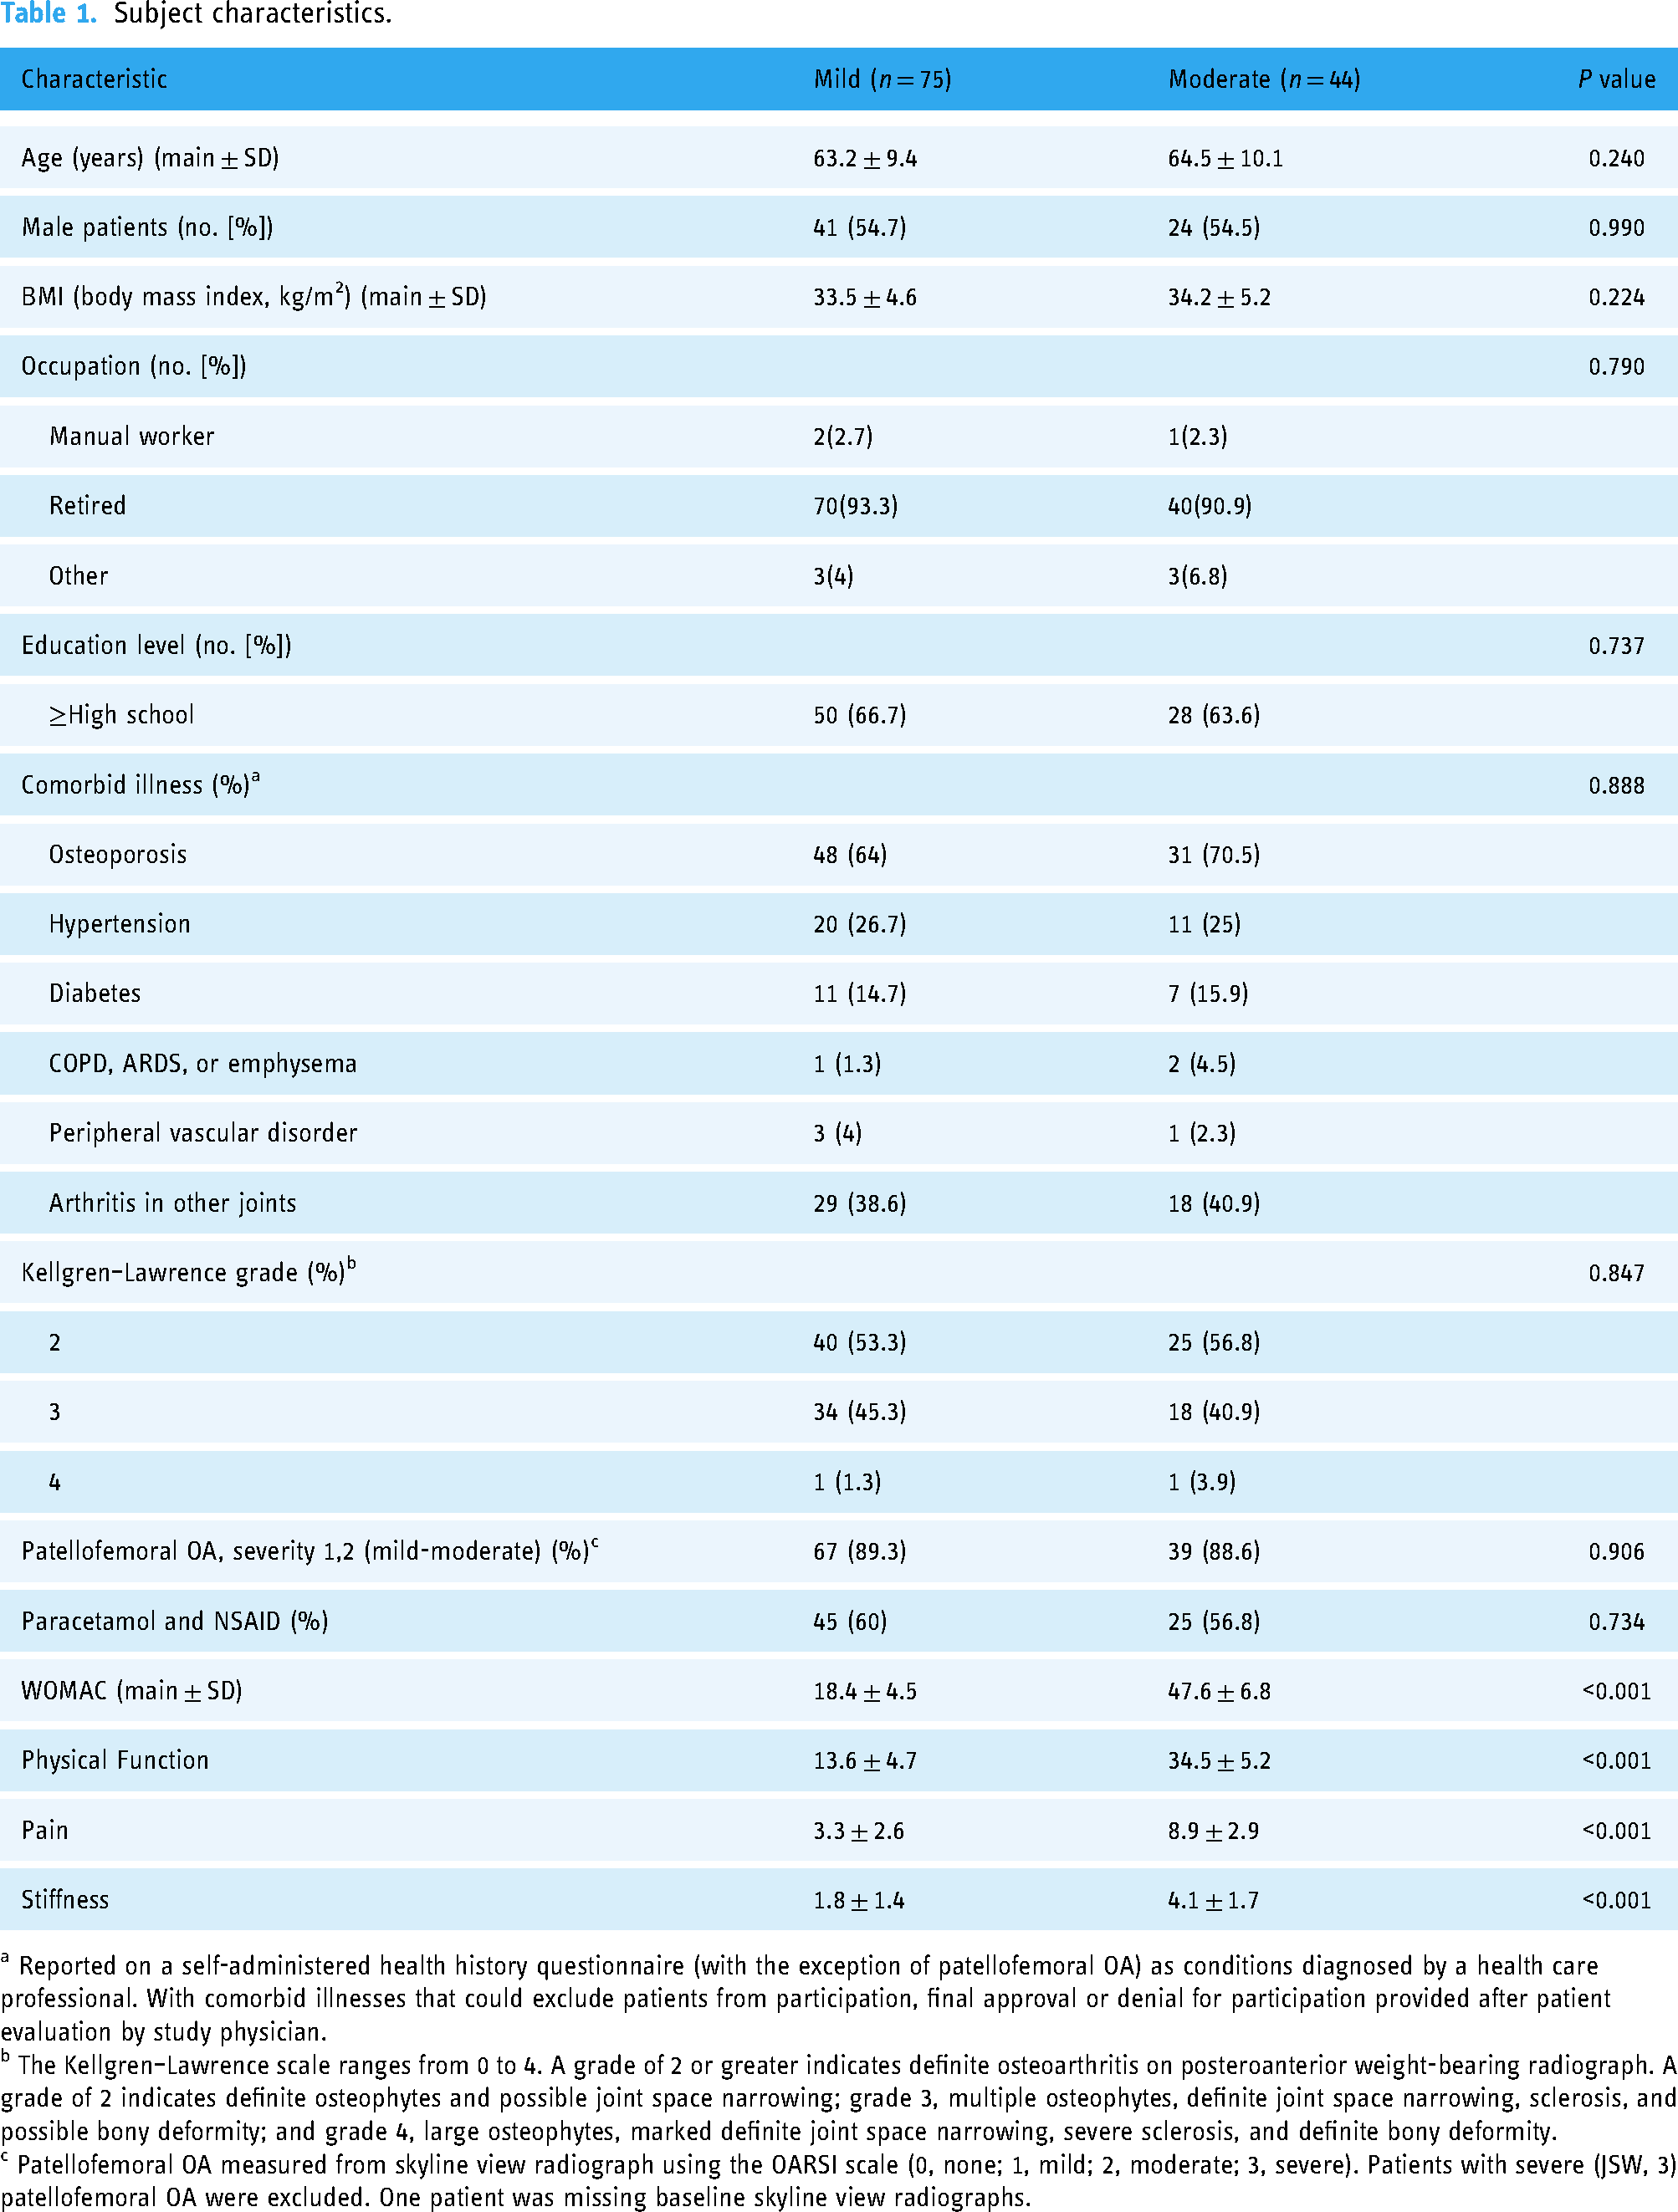
a Reported on a self-administered health history questionnaire (with the exception of patellofemoral OA) as conditions diagnosed by a health care professional. With comorbid illnesses that could exclude patients from participation, final approval or denial for participation provided after patient evaluation by study physician.
b The Kellgren–Lawrence scale ranges from 0 to 4. A grade of 2 or greater indicates definite osteoarthritis on posteroanterior weight-bearing radiograph. A grade of 2 indicates definite osteophytes and possible joint space narrowing; grade 3, multiple osteophytes, definite joint space narrowing, sclerosis, and possible bony deformity; and grade 4, large osteophytes, marked definite joint space narrowing, severe sclerosis, and definite bony deformity.
c Patellofemoral OA measured from skyline view radiograph using the OARSI scale (0, none; 1, mild; 2, moderate; 3, severe). Patients with severe (JSW, 3) patellofemoral OA were excluded. One patient was missing baseline skyline view radiographs.
There was no significant difference between groups for age, BMI, male/female ratio, occupation, education, comorbid illness, Kellgren–Lawrence grade, patellofemoral osteoarthritis, paracetamol, and NSAIDs intake.
Muscle activity during dynamic knee extension
Normalized sEMG values are presented in Tables 2 and 3, showing muscle activity as a percentage of the MVIC peak amplitudes recorded during initial normalization tests. sEMG data during dynamic knee extension revealed some unexpected patterns, where certain muscles showed higher activity on the contralateral side compared to the affected side. Specifically, MAV values for the rectus femoris, tibialis anterior, and biceps femoris were lower on the contralateral side than on the affected side. Similarly, RMS measures for the rectus femoris, vastus medialis, and tibialis anterior, as well as CF values for the vastus lateralis, tibialis anterior, biceps femoris, gluteus medius, and psoas, followed this pattern. During isometric knee extension, this trend continued for MAV and RMS values in the tibialis anterior and CF measures in all muscles except the tibialis anterior (see Table 2). These findings suggest that some muscles on the affected side may be engaging more intensively, potentially compensating to stabilize the affected joint.
Mean and standard deviation of selected muscles’ sEMG characteristics during dynamic knee extension compared to contralateral side.
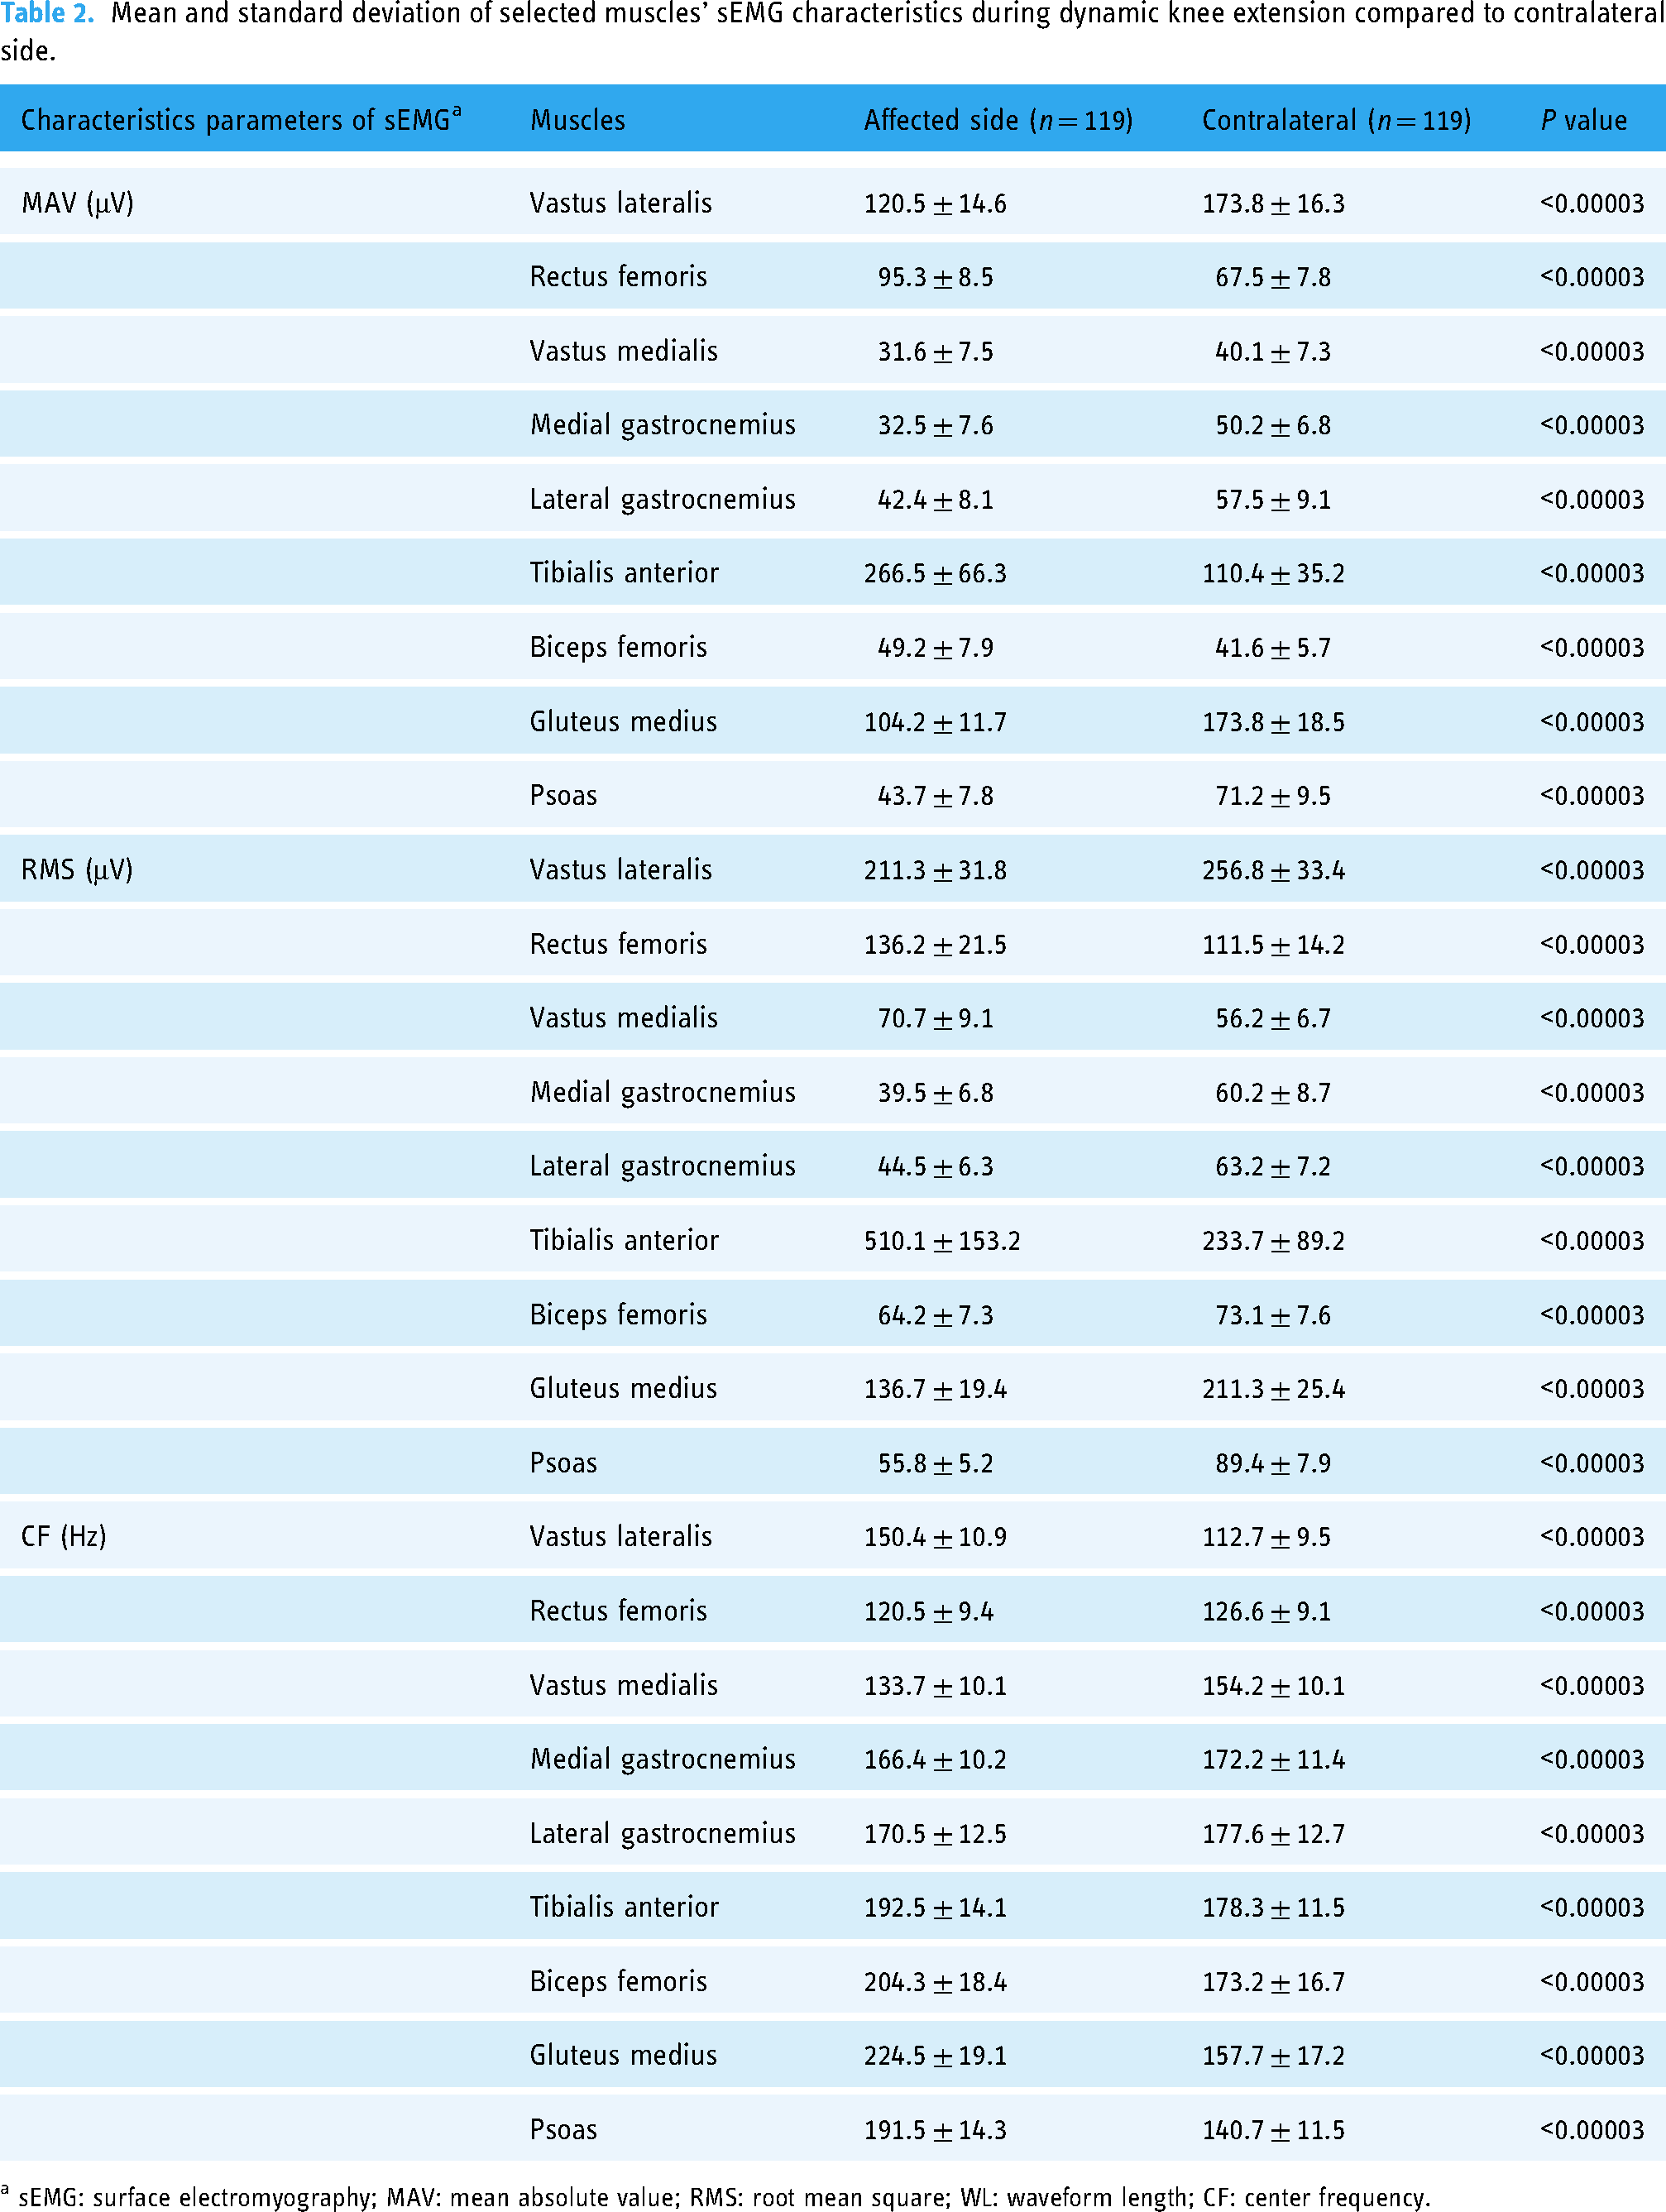
a sEMG: surface electromyography; MAV: mean absolute value; RMS: root mean square; WL: waveform length; CF: center frequency.
Mean and standard deviation of selected muscles’ sEMG characteristics during isometric knee extension compared to contralateral side.

a sEMG: surface electromyography; MAV: mean absolute value; RMS: root mean square; WL: waveform length; CF: center frequency.
Muscle activity during isometric knee extension
Table 3 details the sEMG characteristics during isometric knee extension. Similar to dynamic extension, significant differences were observed between affected and contralateral sides across all parameters (MAV, RMS, CF) for each muscle, with notable reductions in MAV for the vastus medialis and gluteus medius. These differences indicate compromised muscle function in the affected limbs of KOA patients.
Muscle activity by WOMAC severity during dynamic and isometric extensions
Differences in muscle activity between mild and moderate KOA groups were assessed for both dynamic (Table 4) and isometric (Table 5) knee extensions. Patients with moderate KOA showed greater declines in MAV and RMS values in several muscles, such as the vastus lateralis and gluteus medius, compared to the mild group. These findings suggest that KOA severity influences muscle adaptation patterns, highlighting the need for severity-specific rehabilitation strategies.
Mean and standard deviation of selected muscles’ sEMG characteristics different for WOMAC severity groups during dynamic knee extension.

a sEMG: surface electromyography; MAV: mean absolute value; RMS: root mean square; WL: waveform length; CF: center frequency.
Mean and standard deviation of selected muscles’ sEMG characteristics different for WOMAC severity groups during isometric knee extension.

a sEMG: surface electromyography; MAV: mean absolute value; RMS: root mean square; WL: waveform length; CF: center frequency.
Discussion
Overall findings of our study
This study demonstrates that KOA in medically obese individuals is associated with notable declines in muscle activity, strength, and fatigability, as assessed via sEMG during both dynamic and isometric knee extensions. Specifically, muscles on the affected side exhibited lower activation and strength compared to the contralateral side, with substantial reductions in key sEMG parameters, including MAV, RMS, and CF. While our findings demonstrated significant declines in muscle activation in the affected limbs for most muscles, some parameters exhibited unexpectedly higher values on the contralateral side. Specifically, during dynamic knee extension, MAV values for the rectus femoris, tibialis anterior, and biceps femoris were lower on the contralateral side compared to the affected side (see Table 2). Similarly, RMS measures for the rectus femoris, vastus medialis, and tibialis anterior, along with CF measures for the vastus lateralis, tibialis anterior, biceps femoris, gluteus medius, and psoas, followed this pattern (see Table 2). During isometric knee extension, this trend continued for MAV and RMS values in the tibialis anterior, as well as for CF measures across all muscles except the tibialis anterior.
Additionally, the severity of KOA was found to be a significant factor influencing these declines, with patients classified as moderate KOA showing more marked muscle deterioration than those with mild KOA.
Compensatory mechanisms and muscle activity patterns
The higher activity levels observed in specific muscles on the affected side, such as the rectus femoris and tibialis anterior, may indicate compensatory adaptations. This increased activation could reflect an attempt to stabilize and support the compromised joint in KOA, as these muscles may be recruited to offset limitations in joint stability. Conversely, higher activation levels in muscles on the contralateral side for certain sEMG parameters could signify adjustments made by the body to maintain balance and functional symmetry despite deficits in the affected limb. These complex compensatory mechanisms might play a key role in maintaining overall mobility and joint function, despite the asymmetries induced by KOA.
Our findings also suggest that while most muscles showed reduced activity on the affected side, certain muscles, such as the tibialis anterior and rectus femoris, demonstrated higher sEMG values on the contralateral side in some parameters. This may also indicate compensatory adaptations, where the contralateral limb adjusts by increasing muscle activation to maintain stability and function. Such compensatory behavior could be a response to pain or weakness in the affected limb, resulting in an increased reliance on the contralateral muscles for tasks like knee extension.
Our observations therefore reflect a more nuanced pattern of muscle adaptation, where not all muscles on the affected side are uniformly weaker than their contralateral counterparts. The higher MAV, RMS, and CF values on the contralateral side for specific muscles could imply compensatory recruitment, emphasizing the importance of considering each muscle's role in the broader biomechanical context of KOA. Our findings suggest that compensatory adaptations may not follow a uniform pattern, varying instead across different muscle groups.
Our study also reveals task-specific differences in muscle activation between dynamic and isometric knee extension tasks. For certain muscles, such as the tibialis anterior and rectus femoris, recruitment was notably higher on the affected side during one task but not the other. Specifically, dynamic knee extension elicited higher MAV and RMS values for muscles such as the rectus femoris and biceps femoris on the affected side compared to the contralateral side, while isometric knee extension showed this trend predominantly in the tibialis anterior. These task-specific discrepancies highlight that the recruitment demands on muscles vary based on the nature of the task.
The differential recruitment patterns may be explained by the functional demands placed on the knee joint during dynamic versus isometric tasks. Dynamic knee extension involves movement and requires coordination, potentially increasing the need for stabilization and balance. Muscles on the affected side, like the rectus femoris and tibialis anterior, might activate more intensively to control movement through a wider range of motion and to compensate for joint instability in the affected limb. In contrast, isometric knee extension focuses on holding a fixed position, which might require less coordination but a higher degree of static support. This could lead to increased recruitment in muscles such as the tibialis anterior, as it contributes to maintaining joint stability in a static position without the need for dynamic control. These findings suggest that KOA patients may rely on different compensatory strategies depending on the specific demands of the task.
Obesity's role in KOA progression and muscle function
We hypothesize that increased body weight in obese KOA patients may contribute to muscle dysfunction by altering biomechanics, placing additional stress on knee structures, and shifting load-bearing responsibilities to surrounding muscles. This hypothesis is consistent with the literature indicating that obesity can alter gait and joint loading, thereby exacerbating muscle fatigue and reducing muscle efficiency in the affected limbs.16–18 Moreover, the altered biomechanics can lead to changes in muscle function around the knee, potentially resulting in muscle weakness, imbalance, and reduced endurance.19,20 These muscle changes can further exacerbate joint stress and contribute to the progression of KOA.
Furthermore, obesity is associated with changes in muscle composition, such as increased fat infiltration into muscles, which can adversely affect muscle strength and function. The resulting muscle weakness can compromise joint stability and further contribute to the development and progression of KOA. 21
Inflammation's role and adipose tissue in KOA progression and muscle function
While we did not measure inflammatory markers or adipose tissue characteristics in this study, we propose that these factors may play a substantial role in exacerbating muscle dysfunction among obese KOA patients. Previous research has shown that adipose tissue, particularly in obese individuals, secretes pro-inflammatory cytokines that can contribute to systemic inflammation.22–24 This inflammatory state can affect muscles and joints, leading to pain, stiffness, and reduced function, which are characteristic symptoms of osteoarthritis.22–25 We offer this hypothesis as a potential pathway for understanding our findings, suggesting that future research should investigate inflammation and adipose tissue characteristics to clarify their impact on muscle adaptations in KOA.
Influence of KOA severity on muscle activation patterns
Previous studies have highlighted the altered muscle activation patterns in patients with KOA, which are consistent with our findings.26–28 For instance, the significant differences observed in MAV, RMS, and CF suggest that KOA not only affects muscle strength but also muscle coordination and fatigue characteristics.26–30 These changes are more pronounced in the affected knee, indicating a compensatory mechanism or a protective response to pain and joint instability. Our study found obese individuals with KOA also exhibit gait adaptations, which frequently manifest as decreased muscle strength of psoas, gluteus medius, vastus lateralis, vastus medialis, rectus femoris medial gastrocnemius, lateral gastrocnemius, tibialis anterior and biceps femoris muscles. Neuromuscular changes, such as decreased postural control, have also been observed. Nevertheless, it is possible that these adaptations are a consequence of joint morphological changes and pain related adaptation rather than degeneration of related muscles.
Interestingly, the differences in electromyographic data between the affected and contralateral sides were also significantly different among groups based on KOA severity. This suggests that as KOA progresses, the extent of muscle dysfunction and adaptation varies, which could inform targeted rehabilitation strategies. However, it is noteworthy that certain muscles, such as the vastus medialis, lateral gastrocnemius, and biceps femoris, did not show significant differences in MAV or CF values in specific conditions. This may indicate muscle-specific adaptation mechanisms or varying degrees of impact from KOA.
The lack of significant difference in MAV value of the vastus medialis and the lateral gastrocnemius, and CF value of the medial and lateral gastrocnemius during dynamic knee extension, and MAV and CF value of the biceps femoris during isometric knee extension, suggests that these muscles might maintain their function better than others or are less affected by the changes induced by KOA. These muscles might compensate for the deficits in others or may be subjected to different levels of mechanical stress.
Our findings indicate that KOA severity correlates with greater muscle dysfunction, particularly in the vastus lateralis and gluteus medius, where moderate KOA patients experienced more pronounced declines than those with mild KOA. This suggests that disease progression may heighten the need for interventions targeted to the stage of KOA.
Implications for rehabilitation and intervention
The significant reductions observed in MAV, RMS, and CF values across various muscles underscore the need for targeted intervention strategies to address muscle-specific adaptations. Notably, the vastus medialis and gastrocnemius displayed unique responses to KOA progression, maintaining function better than other muscles.
The task-specific recruitment observed in our study suggests that rehabilitation for KOA should incorporate both dynamic and isometric exercises, as each type may target different compensatory mechanisms. By understanding which muscles activate more under different tasks, clinicians can design interventions that promote balanced activation and improve functional stability in patients with KOA. Future interventions could benefit from focusing on these specific muscle groups, potentially incorporating strength and endurance training to mitigate the effects of KOA.
Hypothetical implications for gait adaptability
While gait was not directly analyzed in this study, our findings on muscle strength and function are relevant to the literature on gait adaptability in KOA patients. Research has shown that muscle strength—particularly in the quadriceps and gluteal muscles—plays a crucial role in stabilizing gait and maintaining functional independence. 31 The reductions in muscle strength observed in this study suggest that KOA progression may impair the ability of affected muscles to adequately support gait stability. Specifically, the reduced strength in muscles like the vastus lateralis, gluteus medius, and gastrocnemius could impact joint stability and load distribution during gait, increasing the risk of compensatory adaptations that may lead to altered biomechanics.31,32
This relationship between strength and gait adaptability in KOA is therefore presented as a hypothesis, supported by literature indicating that weakened or fatigued muscles can lead to altered gait mechanics in an attempt to reduce pain or joint loading.27–32 Future studies should investigate the direct relationship between muscle deficits and gait adaptations in KOA patients to better understand how targeted muscle rehabilitation might mitigate these adaptations.
Limitations and future research directions
While our study provides valuable insights, certain limitations should be acknowledged. The cross-sectional design limits our ability to infer causal relationships between KOA severity, obesity, and muscle adaptation. Future studies using longitudinal designs would enhance understanding of these relationships over time. Additionally, expanding the sample to include more diverse demographic and clinical profiles could improve the generalizability of findings. Future research should also explore interventions targeting muscle groups most affected by KOA, as identified by our sEMG analysis, to determine the therapeutic benefits of targeted muscle training.
Conclusion
This study indicates that obese individuals with knee OA adapt lower muscle intensity and higher fatigability when compared to contralateral side during both isometric and dynamic extension of knee joint. Furthermore, significant reductions in muscle intensity were noted in the psoas, gluteus medius, vastus lateralis, rectus femoris, medial gastrocnemius, and tibialis anterior muscles, correlating with advanced severity of KOA.
Supplemental Material
sj-doc-1-dhj-10.1177_20552076241311940 - Supplemental material for Digital assessment of muscle adaptation in obese patients with osteoarthritis: Insights from surface electromyography (sEMG)
Supplemental material, sj-doc-1-dhj-10.1177_20552076241311940 for Digital assessment of muscle adaptation in obese patients with osteoarthritis: Insights from surface electromyography (sEMG) by Xinran Luo, Qiaojie Wang, Hongyu Tan, Wenbo Zhao, Yifei Yao and Shengdi Lu in DIGITAL HEALTH
Footnotes
Acknowledgements
The authors acknowledge the Shanghai Tech University and Shanghai Jiao Tong University for providing the necessary equipment for the study.
Contributorship
Xinran Luo and Qiaojie Wang were responsible for data acquisition and analysis, as well as manuscript writing. Shengdi Lu and Yifei Yao were responsible for study design, project management, manuscript review. Hongyu Tan and Wenbo Zhao, provided support in the experiments or data, and participated in writing and proofreading the manuscript. All the authors have read the last version of paper and consented for submission. Xinran Luo is the first author of this paper, and Qiaojie Wang is the co-first author. Shengdi Lu is the corresponding author of this paper, and Yifei Yao is the co-corresponding author. Hongyu Tan is the second author of this paper, and Wenbo Zhao is the third author.
Declaration of conflicting interests
The authors declared no potential conflicts of interest with respect to the research, authorship, and/or publication of this article.
Funding
The authors received no financial support for the research, authorship, and/or publication of this article.
Supplemental material
Supplemental material for this article is available online.
References
Supplementary Material
Please find the following supplemental material available below.
For Open Access articles published under a Creative Commons License, all supplemental material carries the same license as the article it is associated with.
For non-Open Access articles published, all supplemental material carries a non-exclusive license, and permission requests for re-use of supplemental material or any part of supplemental material shall be sent directly to the copyright owner as specified in the copyright notice associated with the article.