
Abstract
Purpose
The rapid rise in smartphone use has led to declining sleep quality. Excessive internet use has been linked to negative impacts on physical and mental health, and individual personality traits (PT) may contribute to internet addiction and mitigate its harmful effects. This study aims to: (1) examine whether PT mediate the relationship between smartphone use and sleep quality, and (2) investigate whether the relationship between smartphone use and sleep quality varies across different gender and age groups.
Methods
There were 269 participants in the dataset. The daily averages for sleep duration, sleep distraction, and smartphone use were extracted from the usage data acquired through a dedicated smartphone application. Structural equation modeling was employed to investigate the mediating role of personality in the relationship of smartphone use and sleep quality.
Results
Results indicated that PT partially mediated the relationship, with a significant negative indirect impact of smartphone use on sleep quality. Age differences were observed, showing distinct patterns between younger and older participants, while no significant gender differences emerged.
Conclusions
This study found that excessive smartphone use, coupled with low personality indicators, leads to poor sleep quality. Positive personality traits improve sleep outcomes, with age influencing the impact of smartphone use on sleep. Our findings support and contribute to existing concerns about technology overuse and highlight the need for targeted interventions to promote more beneficial technology design and usage patterns.
Introduction
The rapid evolution of Internet technology has made smartphones a primary tool for individuals to access and share information, transforming the way people communicate and interact. The popularity and recent fast developments in the usage of smartphones have changed the way people communicate and share information, also it has changed the users’ interests and demands. 1 The influence of smartphones on different sectors has already been started, that is markets, corporations, society, and even individuals. 2 Researchers have begun examining the complex impacts of smartphones on service providers, consumers, and society, exploring both positive and negative effects to better understand the technology's widespread influence. 3 During the coronavirus disease 2019 lockdown, smartphones were the significant platforms for individuals from several sectors to work from their homes to keep the flow of their businesses’ responsibilities.4,5 Furthermore, students also took advantage of using smartphones having internet facilities to keep progress in their educational and professional careers. 4 Similarly, the use of smartphones has benefited the young generation by enhancing their social skills and allowing them to maintain distance from face-to-face interactions associated with peer influences, stress, and anxiety.6,7 Conversely, excessive smartphone use is linked to adverse effects on well-being, including decreased self-esteem, impaired daily functioning, mood disorders, and poor sleep quality (SleepQ). These negative consequences underscore the importance of responsible smartphone use and further research into its psychological impacts. 8
Smartphone addiction, also referred to as problematic smartphone usage (PSU), is characterized by an excessive reliance on smartphones that disrupts daily life activities, including work, study, and social interactions. 9 It involves compulsive behaviors like the inability to control phone use, anxiety when separated from the device, and overuse despite negative consequences. 10 The concept of PSU aligns with other forms of technology addiction, such as problematic internet usage (PIU), which has been widely studied in recent years. Furthermore, smartphone addiction can significantly affect sleep patterns.9,11 The human body's natural circadian rhythms and sleep-wake cycle play a crucial role in enabling optimal functioning in a dynamic environment, as they synchronize our biology with the day-night cycle. 12 Additionally, the circadian clock ensures that various biological processes occur in a temporally coordinated manner, highlighting the importance of maintaining a healthy sleep schedule in the face of potentially addictive behaviors like excessive smartphone use.
Sleep is vital for health, daily functioning, and performance, and is a critical factor in addressing the most common and significant health risks in adolescents, including those related to physical and mental health. 13 Sleep deprivation is associated with various physical and mental health issues, including impaired immune function, 14 mental illness, 15 low fertility, 16 impaired cognition, 17 hypertension, 18 and hyperglycemia. 19 Neuroimmunology research has amassed robust evidence that sleep significantly enhances immune defense, supporting the traditional belief that “sleep helps healing.” This research reveals the complex interplay between sleep, the brain, and the immune system, emphasizing the vital role of sleep in maintaining immune homeostasis and overall well-being. 20 Sleep is a basic human need, and sleep specialists recommend that healthy adults aim for 7 hours of sleep per day to ensure adequate sleep quantity and quality, crucial for physical and mental health. 21 Sleep deprivation impairs mood, judgment, and ability to learn and retain information. 22
Smartphone use is linked to deterioration of sleep, 23 including melatonin suppression from blue light exposure, 24 strong stimulation from interactive activities, 25 technology-induced sleep postponement, 26 and increased emotional arousal from pre-sleep social media use. 27 Research has investigated the effects of television, 28 video games, 29 and music 30 on sleep. Music had an equivocal or slightly positive effect on self-reported and objective measures of sleep. Music had a neutral or slightly beneficial effect on sleep. Reducing television viewing improved sleep time, while video game effects were inconsistent. Computer and smartphone use were found to disrupt sleep in self-reported studies. 31
Additionally, PSU has been found to contribute to bedtime procrastination, where individuals delay going to bed despite the negative consequences for their sleep. Bedtime procrastination acts as a mediator in the relationship between excessive smartphone use and SleepQ, illustrating how smartphone use can indirectly worsen sleep through behaviors that disrupt regular sleep routines. 32 For instance, a study by Correa-Iriarte et al. 33 demonstrated that individuals with high levels of smartphone use are more likely to experience delayed bedtimes, further impairing their overall SleepQ. This emphasizes the need to consider behavioral factors like bedtime procrastination when studying the effects of smartphone use on sleep.
Furthermore, PT significantly influence various aspects of human behavior, including technology use, internet addiction, and sleep habits. 34 Individuals high in neuroticism are more prone to smartphone addiction and excessive internet use, 35 as they often turn to digital devices to manage negative emotions, a behavior closely linked to emotional dysregulation. 36 Emotional dysregulation, characterized by difficulties in managing emotional responses, has been identified as a key psychosocial risk factor for technological addictions, where individuals may use the internet or smartphones as coping mechanisms.37,38 In contrast, those high in conscientiousness tend to use the internet less frequently, demonstrating lower addiction risk. 39 Conscientiousness, Extraversion, and Agreeableness have been negatively correlated with internet usage, suggesting that positive personality traits (PT) can mitigate the risk of overuse. 40 Additionally, the fear of missing out exacerbates compulsive checking behaviors, contributing to bedtime procrastination and disrupted sleep patterns. 41 Individuals with negative PT, such as high neuroticism, often struggle with sleep onset and report poorer SleepQ, leading to increased daytime sleepiness, whereas those with positive traits generally maintain healthier sleep habits.42,43 Negative PT refer to characteristics that are generally associated with less adaptive behavior and poorer psychological health. 44 In this context, negative traits typically include high levels of neuroticism, low levels of agreeableness, and lower levels of conscientiousness.45,46
Moreover, gender differences also emerge in these behaviors, with some studies indicating no significant differences between men and women in the patterns and duration of internet usage.47,48 However, other studies suggest that gender does play a role in problematic internet use. 49 Specifically, men have been found to exhibit higher levels of internet addiction compared to women, 50 while women are more likely to have smartphone addiction. 51 These findings, though, may vary depending on the research methodology and population studied, particularly in recent years among “digital natives” who have constant access to the internet through smartphones. 52 Additionally, researchers have highlighted distinct patterns in smartphone use between genders. For instance, Hysing et al. 53 noted that girls tend to use their phones for online chatting, listening to music, and other computer-related activities, whereas boys more frequently engage in gaming. Understanding the influence of PT, emotional regulation, and gender differences on technological addictions provides deeper insights into their impact on SleepQ.
In the literature, several researchers have addressed the influence of psychological problems on SleepQ 54 and with these psychological problems, that is depression, anxiety, and so forth there is a relationship of smartphone use with SleepQ. 55 Most of these studies have investigated the mentioned problem by using the self-reported data for internet/smartphone/screen usage as well as for sleep, such as Pittsburgh Sleep Quality Index (PSQI) 56 is widely used for sleep assessment by using Pearson's correlation, 54 and in some work if finding both monotonic and linear relationship, Spearman's correlation is used with Pearson's correlation.42,55 To analyze the quality of self-reported sleep (PSQI), regression analysis is also performed by different researchers, that is logistic regression by,51,57–60 linear regression by,21,61,62 hierarchical regression by.39,63 In some work, analysis of variance is used with other measures by60,64–66 either by using PSQI or other self-administered questionnaires.
Mediation analysis is also one of the useful analyses that is used to hypothesize the effect of one variable, for example X on Y by taking the effect of a mediator M which shows the indirect effect of X on Y through M.67,68 Considering the mediating effect,51,69–73 have analyzed the effect of psychometrics, internet/smartphone/screen use on SleepQ by taking almost subjective data for each variable. In this research work, our aim is to examine the impact of total smartphone use (TMU) on SleepQ, while taking the mediating effect of PT.
State-of-the-art literature has explored the detrimental effects of excessive smartphone use on SleepQ while considering different psychometrics. However, existing studies have predominantly used subjective data, which may not accurately capture actual behaviors. Additionally, previous studies have relied on self-reported smartphone and sleep habits, a methodological limitation since self-reported technology use often does not accurately reflect actual usage.74,75 A research study has highlighted that objective data analytics are a viable tool for healthcare applications.
76
Moreover, many of these studies have overlooked the potential mediating role of PT in the relationship between smartphone use and SleepQ. This study aims to fill these gaps by utilizing objective data on smartphone use and SleepQ to investigate the mediating effect of PT. Specifically, we address two critical research questions:
Does PT mediate the relationship between TMU and SleepQ, and if so, is this mediation partial or full? Does the relationship between TMU and SleepQ vary across different demographic groups, particularly by gender and age?
By answering these questions, this research seeks to contribute a more precise understanding of the complex dynamics between smartphone use, personality, and SleepQ, with an emphasis on the variability across different groups.
Related work
In literature, smartphone addiction is defined as excessive smartphone use that disrupts daily life priorities, including sleep. 9 Smartphone use is linked to deterioration of sleep, 23 due to the melatonin-suppressing effects of blue light emissions, 24 strong stimulation from interactive activities, 25 technology-induced sleep postponement, 26 and increased emotional arousal from pre-sleep social media use. 27 Sleep is a natural, periodic state of rest characterized by reduced consciousness, diminished sensory awareness, and decreased physical activity, essential for physical and mental rejuvenation. 77 It is characterized by altered consciousness, reduced sensory activity, and muscle inhibition, regulated by the brain's internal 24-hour biological clock, which is influenced by physical and mental health factors. 78 Establishing a consistent sleep schedule, including regular bedtimes, adequate sleep duration, distraction-free sleep environments, and consistent wake-up times, helps regulate circadian rhythms and promote healthy sleep-wake cycles.
Studies have shown that during the coronavirus disease 2019 lockdown, students exhibited increased nighttime internet use, disrupted sleep patterns, higher levels of internet addiction, and altered sleep habits, highlighting the impact of the pandemic on students’ online behavior and sleep hygiene.79,80 Sleep disruptions, such as delayed wake-up and sleep times, flexible sleep schedules, and fragmented sleep, are examples of sleep quantity and quality disturbances resulting from interruptions during sleep time.81–83 Despite personality being a known predictor of good sleep, 84 the relationship between personality and SleepQ in smartphone users remains understudied. This study investigates the impact of smartphone use, and PT on SleepQ, while utilizing a dedicated app to objectively measure daily smartphone use, in order to address the existing knowledge gap.
Personality refers to an individual's relatively enduring psychological characteristics and mechanisms that shape their interactions, adaptations, and responses to internal, physical, and social environments. 85 Personality is a relatively stable and enduring pattern of cognitive, emotional, and behavioral tendencies that consistently emerge across diverse situations and contexts. 86 Personality shapes individuals’ interactions with their environment, influencing various behaviors such as music preferences and technology use, including internet and digital device usage patterns.87,88 A study by Gunduz et al. 39 found that individuals high in neuroticism tend to engage in excessive internet use, while those high in conscientiousness exhibit reduced internet use. Furthermore, multiple sleep studies have investigated the role of PT in shaping sleep patterns, highlighting the significance of individual differences in sleep habits.89,90
Existing research has extensively explored the link between PT and sleep patterns in middle-aged and older adults, revealing that individuals low in extraversion, conscientiousness, and agreeableness tend to experience poor SleepQ. 91 Individuals with negative PT tend to be poor sleepers, while those with positive traits report good SleepQ and regular patterns. 42 Research on personality's impact on sleep has yielded conflicting results, with one study by Soehner et al. 92 finding no link between PT and sleep duration. The investigation of Gamaldo et al. 93 revealed that extroversion has been linked to better SleepQ, whereas introversion has not. In contrast, individuals with high neuroticism tend to experience poor SleepQ, excessive daytime sleepiness, and frequent sleep complaints. 43
In literature, it is revealed that lower SleepQ, delayed onset of sleep, and shorter sleep duration were resulted due to excessive smartphone use.
94
Additionally, individuals with negative PT experience difficulties initiating sleep, whereas those with positive PT tend to exhibit healthy sleep habits and improved SleepQ.
42
However, existing work has overlooked the mediating role of PT when investigating the smartphone use impact on SleepQ. Keeping in view the above literature, we build the following hypotheses presenting the mediating role of PT between TMU and SleepQ.
H1: PT mediates the negative relationship between TMU and SleepQ. H1a: TMU negatively influences PT. H1b: PT positively influences SleepQ. H1c: TMU negatively influences SleepQ. H2: The effects of the mediating mechanism of PT in the relationship between TMU and SleepQ are different between Males and Females. H2a: The strength of the relationship between TMU and PT will differ between males and females. H2b: The strength of the relationship between TMU and SleepQ will differ between males and females. H2c: The strength of the relationship between PT and SleepQ will differ between males and females. H3: The effects of the mediating mechanism of PT in the relationship between TMU and SleepQ are different between Young and Adults. H3a: The strength of the relationship between TMU and PT will differ between young and adults. H3b: The strength of the relationship between TMU and SleepQ will differ between young and adults. H3c: The strength of the relationship between PT and SleepQ will differ between young and adults.
To address gender differences in relation to PT, several research has explored gender differences in personality across various dimensions, including traits, values, interests, and preferences, revealing distinct patterns and variations between men and women.95,96 Previous studies have shown that user personality significantly influences technology acceptance, while user gender has no moderating effect on this relationship, except for altruism, which is the only personality aspect where gender plays a significant role.
97
Keeping in view the personality differences between males and females, Samar Mouakket
98
addressed that males are more satisfied than females when they use social networking sites, that is Facebook. Additionally, researchers have also investigated gender differences in smartphone use patterns. Hysing et al.
53
find that boys use cellphones more for gaming, while girls prefer music, socializing, and computer activities. Smartphone use has been linked to sleep disturbance and deterioration.
23
Researchers have found that males tend to have poorer SleepQ compared to females.
21
Whereas, Brubaker J et al.
66
have found that SleepQ is similar between males and females, with no significant gender differences. Based on the above literature, we build the following hypotheses for gender differences in the relationship between TMU and SleepQ.
Finally, in the context of age differences, the positive and negative aspects of personality are associated with age differences. Individuals become more agreeable, conscientious, and emotionally stable with increasing age.
99
Wickord et al.
100
have identified key differences between digital immigrants and digital natives in smartphone addiction, PT, and mental health, highlighting distinct characteristics between the two groups. The widespread integration of the internet into adolescent life has heightened the likelihood of young individuals developing internet addiction, as the internet has become a fundamental aspect of their daily experiences and interactions.
101
Cai et al.
102
found that adolescents use social media more frequently than children, highlighting a significant difference in social media use patterns between these two age groups. The use of smartphones in young individuals is more often than adults, with distinct forms and purposes of use.
103
Smartphone addiction is defined as excessive smartphone use that interferes with everyday life priorities, such as sleep.
9
In this context, the SleepQ of higher-age students is more affected than lower age students.
104
As young people tend to engage in more phone, internet, and social network activities,
105
Exelmans et al.
63
revealed that using smartphones prior to sleep affects young people to a greater extent than older adults, but Brubaker et al.
66
found no age differences in assessing SleepQ. Keeping in view the above literature regarding age differences, we build the following hypotheses for age differences in the relationship between TMU and SleepQ.
Figure 1 shows the conceptual model of this research work showing the impact of TMU on SleepQ with the mediating effect of PT while considering the Gender and age differences.

Conceptual model: the impact of TMU on SleepQ with the mediating effect of PT while considering the gender and age differences.
Proposed methodology
Sample and procedure
Figure 2 summarizes our research, which utilized a specialized smartphone app for digital well-being to collect data. These apps offer real-time tracking of user behavior on smartphones and apps, enabling the collection of user behavior data in real-time. 106 These apps enable researchers to design data collection, storage, and analysis protocols, allowing for the examination of individual or group usage patterns, and providing valuable insights into digital behavior. 106 Participants who completed the questionnaire were incentivized with a free upgrade to a premium Digital Wellbeing app, offering advanced features and tools to monitor and manage their digital habits and well-being. This upgraded software then tracked participants’ smartphone use, including time spent on popular apps and daily smartphone use. Along with completing the 10-item Big Five Inventory (BFI-10), 107 participants provided demographic data on their age, gender, and level of education. Participants were fully informed and provided explicit consent before proceeding, ensuring they understood and agreed to the anonymous collection of their data through the Digital Wellbeing app for research purposes. Additionally, the Institutional Review Board of Hamad Bin Khalifa University (QBRI-IRB 2021-08-102) approved this research investigation. The collected data was analyzed to calculate the BFI-10 score and e-sleep variables. In this study, we employed the term “e-sleep” to describe the sleep-related features extracted from the app usage data, which were based on the individual's sleep-wake cycle patterns (e.g., See Figure A1). Figure 4 illustrates e-sleep, which is the term for the idle time spent on smartphones when one is asleep. Although the individuals may be awake during the sleeping hours, the sleep is only approximated. Hence, this study aims to investigate the relationship between smartphone use and sleep patterns, specifically examining how much time individuals spend sleeping without using their smartphones and whether abstaining from smartphone use affects the quality of their sleep. The e-sleep dataset contained all of the extracted data.

An abstract view of the research study.
An abstract view of different apps usage by different participants.

(a) illustrates the 24-hours human sleep-wake cycle. The use of applications in relation to the sleep-wake cycle is highlighted in (b). The usage patterns and the absence of activity during the sleeping hours are shown in (b). Sleep duration refers to this idle period. “Usage of apps/hour” in (b) refers to the real smartphone use activities a user completes in a single hour. For instance, by 12:00 pm, the user had spent about 25 of the 60 minutes on his smartphone.
Measures
Data processing
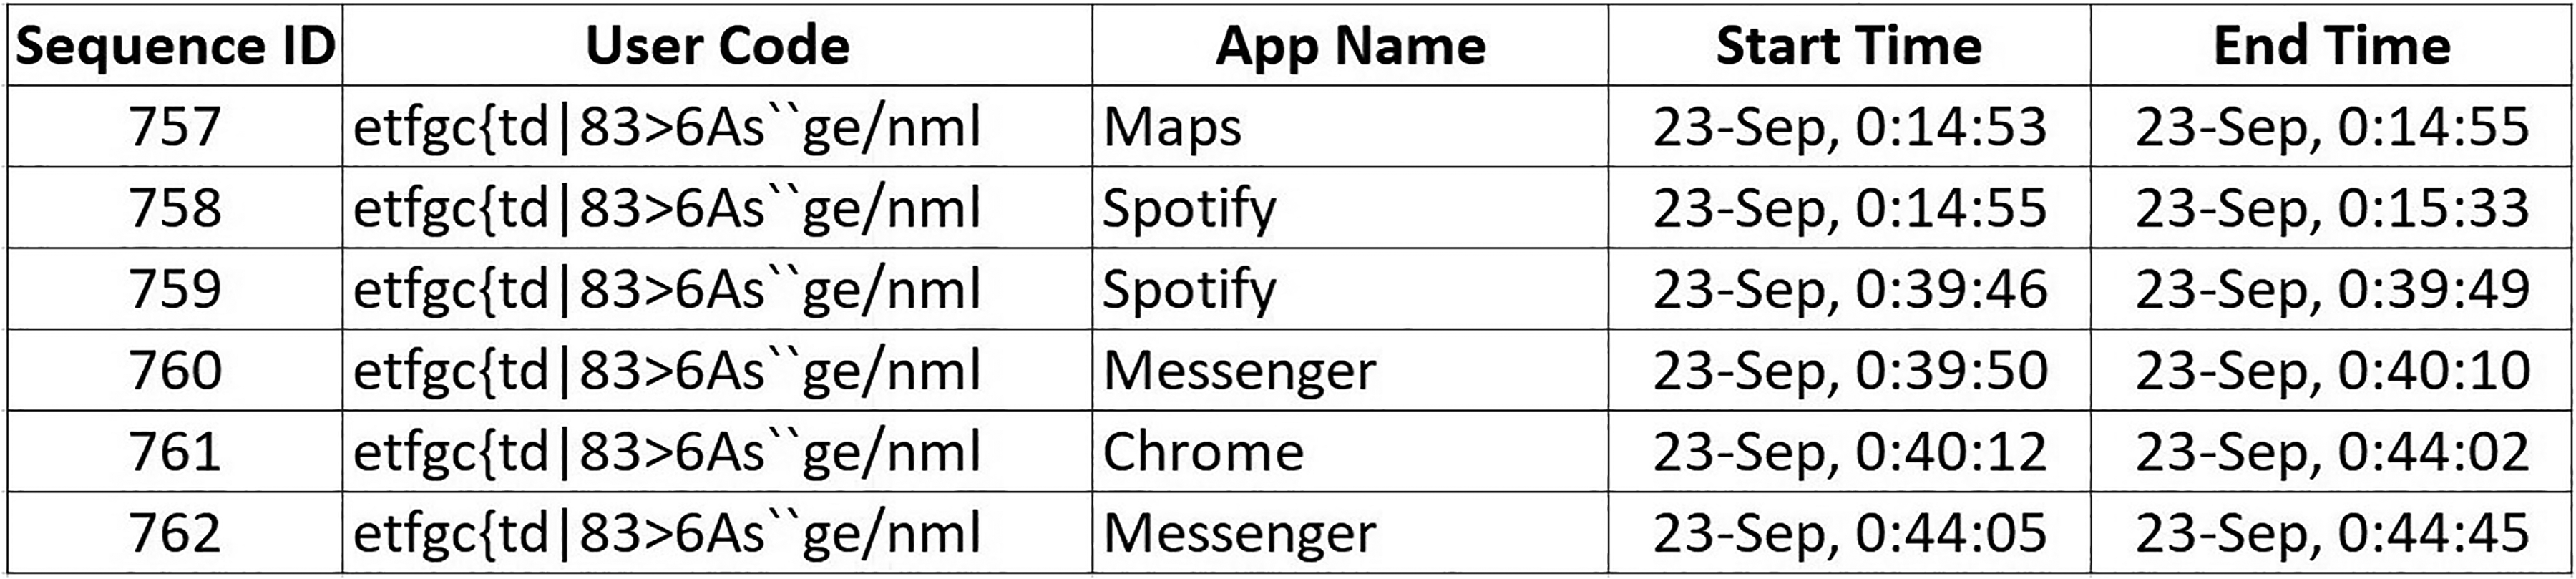
This study, conducted from October 2020 to April 2021, enlisted 602 participants who provided informed consent. The resulting dataset comprised approximately 4.4 million app usage records, providing a vast and comprehensive collection of data for analysis. Participants downloaded the app and signed up for the research at various times, with their first week of use being the focus of this study. According to previous research,108,109 a minimum of 5 days is required to accurately represent normal usage behavior, which we taken into consideration in our analysis. We considered that weekends are part of the 7 days and mitigated their impact. Participants were excluded from the analysis if they didn't meet certain criteria, that is (a) they needed to have at least seven consecutive nights with complete app usage data, (b) a minimum of 16 hours of recorded app usage within a 24-hour period, which is the maximum feasible duration for a day. This filtering process aimed to eliminate participants with irregular sleep-wake cycles, ensuring a more reliable analysis. The filtering criteria, including the 16-hour app usage threshold, helped eliminate cases where data synchronization failed due to extended internet outages. After applying these criteria, 269 participants’ data were deemed suitable for analysis. Figure 3 visualizes app usage patterns, showing each session's “Start Time” and “End Time,” the specific “App Name,” and a unique “User Code” and “Sequence ID.” This representation provides a clear overview of individual app usage sessions, offering insights into user behavior and app engagement. Figure 4 displays the extraction of human sleep-wake cycle patterns from app usage data, revealing the longest possible duration of nighttime inactivity (i.e. abstaining from smartphone use). A custom-built tool, the Sleep-Wake Cycle Annotator, was developed to manually visualize and annotate each user's app usage, identifying bedtime and wake-up times (see Appendix). This tool enabled researchers to accurately label and analyze sleep-wake cycles in the app usage data, providing valuable insights into participants’ sleep patterns. Before annotating the data, all the authors collaborated to establish clear guidelines for annotation, ensuring consistency and reliability. These guidelines were as follows: (1) a minimum of 7 days of smartphone use data was required for participant inclusion; (2) nighttime periods of inactive smartphone use were designated as “e-sleeping hours” or “sleeping hours”; (3) “Sleeping time” was recorded when a user's smartphone went inactive, indicating the start of a sleep state; (4) “Wake-up time” was marked when smartphone activity resumed after a period of inactivity, indicating the end of a sleep state; (5) the duration of “e-sleep” was defined as the time span between “sleeping time” and “wake-up time,” representing the length of the sleep period; and (6) “E-sleep distraction” referred to smartphone use occurring between “sleeping hours” and “wake-up time.” The data were annotated by one author, following these established guidelines. The other authors regularly reviewed random samples of the annotated data, ensuring consistency with the guidelines. This quality control measure allowed for the prompt clarification and resolution of any misunderstandings, refining the annotation process and minimizing discrepancies. After annotating the data, we calculated smartphone use, e-sleep duration, and distraction. We then created the comprehensive e-sleep dataset as shown in Figure 5, combining e-sleep variables, demographics, and BFI-10 scores for 269 participants. This study received ethical clearance from the institutional review board, ensuring compliance with ethical standards.

Flowchart showing the steps involved in gathering and processing the e-sleep dataset. The cylinder shape represents data storage, and the rectangular shape represents automated processing.
Constructs
We used BFI-10, 107 a 10-item self-report questionnaire, to assess PT. It evaluates five traits: extraversion, agreeableness, conscientiousness, neuroticism, and openness to experience. Participants rated statements describing their personalities on a 5-point Likert scale (1–5). Each trait has two items, scored between 2 and 10, with higher scores indicating a greater degree of the trait. The BFI-10 is a reliable and valid measure across diverse samples. 107
The TMU construct is the daily use of objectively recorded smartphone use over a 1-week period, as determined during the data processing stage. TMU has seven sub-variables, UDay1, UDay2, UDay3, UDay4, UDay5, UDay6, and UDay7. The TMU sub-variables represent the daily smartphone usage time, measured separately for each day of the week, providing a detailed understanding of the participants’ smartphone use habits across different days.
Whereas, SleepQ has four sub-variables including “eSleepingTime,” “eSleepingDuration,” “eSleepDistraction,” and “eWakeupTime.” The descriptions of these variables are shown in Table 1, and the dataset can be seen in the Supplemental Material.
Description of the research variables.

Note: TMU: total smartphone use; BFI-10: 10-item Big Five Inventory.
Descriptive statistics and correlations among study variables
Descriptive statistics, presented in Table 2, were computed using JASP. The sample consisted of 269 participants, with a gender distribution of 41.03% male and 58.97% female. In terms of age, 44.86% were emerging adults (15–24 years old), while 55.13% were adults (25–64 years old). Participants represented various professions, with students comprising 34.94% of the sample. Correlation analysis, displayed in Table 3, revealed significant relationships among the study variables. Specifically, PT were negatively correlated with TMU and positively correlated with SleepQ, while TMU and SleepQ were negatively correlated.
Descriptive statistics for demography.

Correlations among PT, TMU, and SleepQ.

Note: *p < 0.05. **p < 0.01. ***p < 0.001. Diagonal bold values represent the square root of AVE. PT: personality traits; TMU: total smartphone use; SleepQ: sleep quality; AVE: average variance extracted.
Data properties and statistical analysis
To assess the hypothesized direct and indirect effects of TMU on SleepQ, structural equation modeling (SEM) was used. All analyses were conducted using AMOS. 110 Prior to assessing the research hypotheses, confirmatory factor analysis was performed to assess the measurement model. First, the qualities of the constructs were evaluated by checking the discriminant validity using Fornell–Larcker criterion 111 and Heterotrait–Monotrait criterion, 112 which indicates the extent to which a given construct differs from other constructs. 113 According to the Fornell–Larcker criterion, the square root average variance extracted of each construct should be greater than its correlations with any other construct. For such purpose, the results showed the square root average variance extracted for PT, TMU, and SleepQ were slightly lower than the correlations as shown in Table 3. Whereas, the results of the Heterotrait–Monotrait are shown in Table 4 indicate very good discriminant validity, as the values obtained were below the predefined threshold of 0.90. 114 Additionally, the common method bias check was performed by adding latent common method factor 115 to the measurement model. The difference with the original model was 1 degree of freedom (df) and a 1.574 chi-square value, which suggested non-significance (significance of 1 df is 3.84 at the p = 0.05 level). As a result, there was no concern about potential bias in our measurement model.
Heterotrait–Monotrait ratio.

Note: PT: personality traits; TMU: total smartphone use; SleepQ: sleep quality.
Second, the model fit was examined by assessing the chi-square index, if the chi-square is not significant (p-value > 0.05), the model is acceptable, but, if the chi-square is significant, the model is regarded as not acceptable. However, if the sample size exceeds 200 as in our case, that is the sample size is 269, several researchers disregard this index. 116 The relative chi-square, also called the normed chi-square might be less sensitive to sample size. We used normed chi-square to check goodness-of-fit (GFI), which is equal to the chi-square index (χ2) divided by the df. 116 The criterion for acceptance varies across researchers, ranging from less than 2 117 to less than 5 118 less than 3 is considered more often. Other model fit indicators were also used including comparative fit Index (CFI), 119 Tucker–Lewis index (TLI), 120 GFI, 121 root mean square error of approximation (RMSEA), 122 standardized root mean square residual (SRMR), RMSEA 90% confidence interval (CI) lower bound, and RMSEA 90% CI upper bound. 123 For the chi-square test, a non-significant chi-square indicates a good model fit. Values greater than 0.9 for CFI, 124 GFI, 125 and TLI 126 indicate good model fit. For RMSEA and SRMR, values closer to zero are considered a better model fit, with values below 0.08 indicating an acceptable model fit. 124 While RMSEA 90% CI lower bound > 0.000, RMSEA 90% CI upper bound < 0.181 are accepted for good model fit. 123
To examine the direct and indirect effects, we used a bootstrapping approach. 127 To test indirect effects, the bootstrapped approach is preferred over other approaches because of its power, it does not require normality assumptions to estimate the indirect effects. 127 To examine the presence of indirect effects, we employed bias-corrected CIs using a bootstrapping approach with 5000 samples and 95% CIs. This method enabled us to estimate the indirect effects with precision. Moreover, to address missing data, we utilized a robust statistical approach called full information maximum likelihood estimation. This method provides a reliable and efficient way to handle missing values. An indirect effect was considered statistically significant if its CI did not include zero, indicating a significant effect. Furthermore, the standardized indirect effect, which represents the effect size, allowed us to assess the indirect effects in a standardized and comparable manner, facilitating the interpretation of the results. 128 The impact of TMU on SleepQ through the mediating effect of PT, including direct, indirect, and total effects was estimated.
Additionally, multiple group analyses were performed to test H2 and H3. To examine group differences, a measurement invariance model test was performed for both gender and age differences to determine if the indicators measured the same impact across groups. First, the configural invariance test was performed separately for both gender: male/female and age: young/adults to examine whether the overall factor structure of the unconstrained model was a good fit across groups. This was assessed by examining the CFI, TLI, GFI, and RMSEA for both gender and age. Second, the metric invariance, and structural invariance tests were performed for both gender and age by constraining the measurement weights (MW), that is factor loadings, and structural weights (SW), that is regression coefficients respectively. These tests were examined by looking at the chi-square values. Chi-square values significant at the p < 0.05 level indicate significant differences between groups.
Results
Model fit
The model fit was observed by examining the fit indices, that is chi-square, CFI, TLI, GFI, RMSEA, SRMR, RMSEA 90% CI lower bound, and RMSEA 90% CI upper bound. The model fit was examined for the relationship of PIU with three indicators, that is obsession, neglect, control-disorder, TMU with seven indicators, that is HDay1, HDay2, HDay3, HDay4, HDay5, HDay6, and HDay7, and SleepQ with four indicators, that is eSleepingTime, eSleepDuration, eSleepDistraction, and eWakeupTime as shown in Table 1. To examine the model fit, the chi-square index was assessed, which was significant (p = 0.006) and indicated a poor model fit while the normed chi-square, that is x2/df = 1.462 indicated a good model fit. Other fit indices, that is CFI = 0.979, TLI = 0.974, GFI = 0.997, SRMR = 0.036, RMSEA = 0.042, RMSEA 90% CI lower bound = 0.023, and RMSEA 90% CI upper bound = 0.058 indicated a good model fit. Table 5 shows our model fit indices.
Fit indices for the research model.
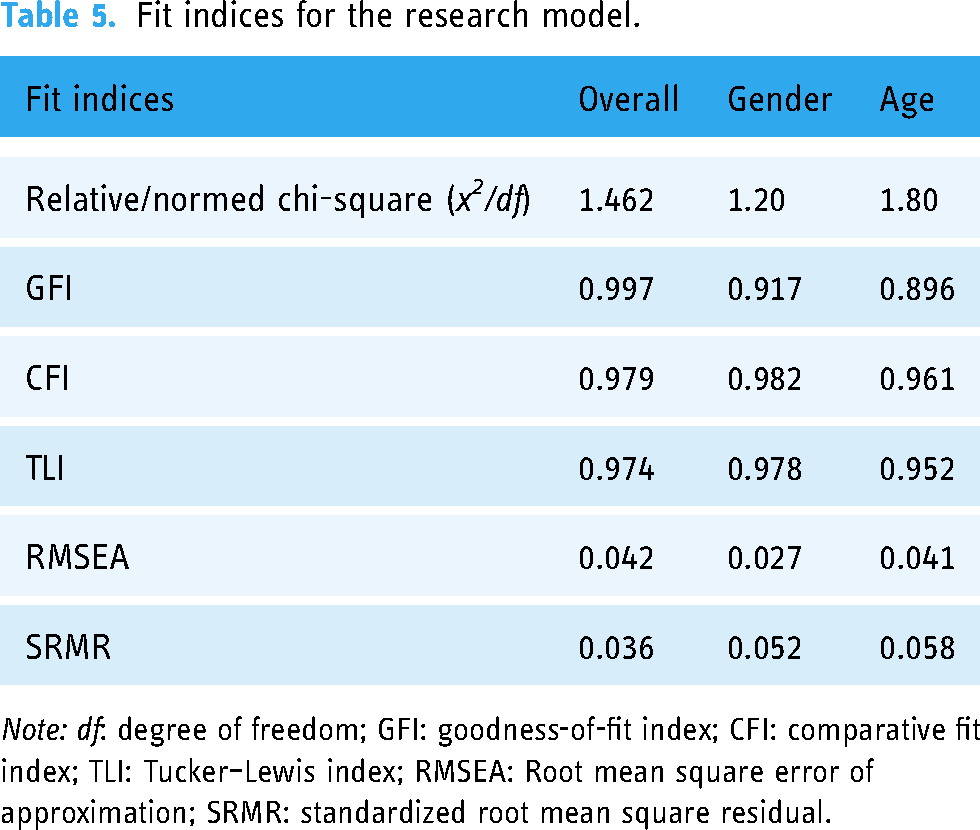
Note: df: degree of freedom; GFI: goodness-of-fit index; CFI: comparative fit index; TLI: Tucker–Lewis index; RMSEA: Root mean square error of approximation; SRMR: standardized root mean square residual.
Path model
After guaranteeing an adequate model fit, we estimated the path model to test H1, H1a, H1b, and H1c in terms of being supported or not by analyzing the p-value. In the following results, β indicates the standardized regression coefficient. TMU (H1: β = −0.186, SE = 0.027, and p = 0.021) has a significantly negative indirect impact on SleepQ through the partial mediation of PT which supported H1. Furthermore, TMU (H1a: β = −0.493, SE = 0.046, and p < 0.001) has a significantly negative impact on PT hence, H1a was supported. Whereas, PT (H1b: β = 0.378, SE = 0.155, and p = 0.033) has a significantly positive impact on SleepQ, and TMU (H1c: β = −0.676, SE = 0.038, and p < 0.001) has a significantly negative direct impact on SleepQ, hence, the result supported both H1b and H1c respectively. Additionally, TMU (β = −0.863, SE = 0.032, and p < 0.001) has a significant total impact on SleepQ. Figure 6 shows the SEM path model with β on each path and Table 6 shows the hypotheses results for H1, H1a, H1b, and H1c, while Table 7 shows the summary of hypotheses in terms of being supported or not.

Resulted model with path coefficients where “a” is the standardized-β for path: TMU to PT, “b” is β for path: PT to SleepQ, c is the β of direct, and d is the β for indirect effect.
Results for H1, H1a, H1b, and H1c.

Note: H1–H1c: hypotheses.
Hypotheses summary in terms of being supported or not.
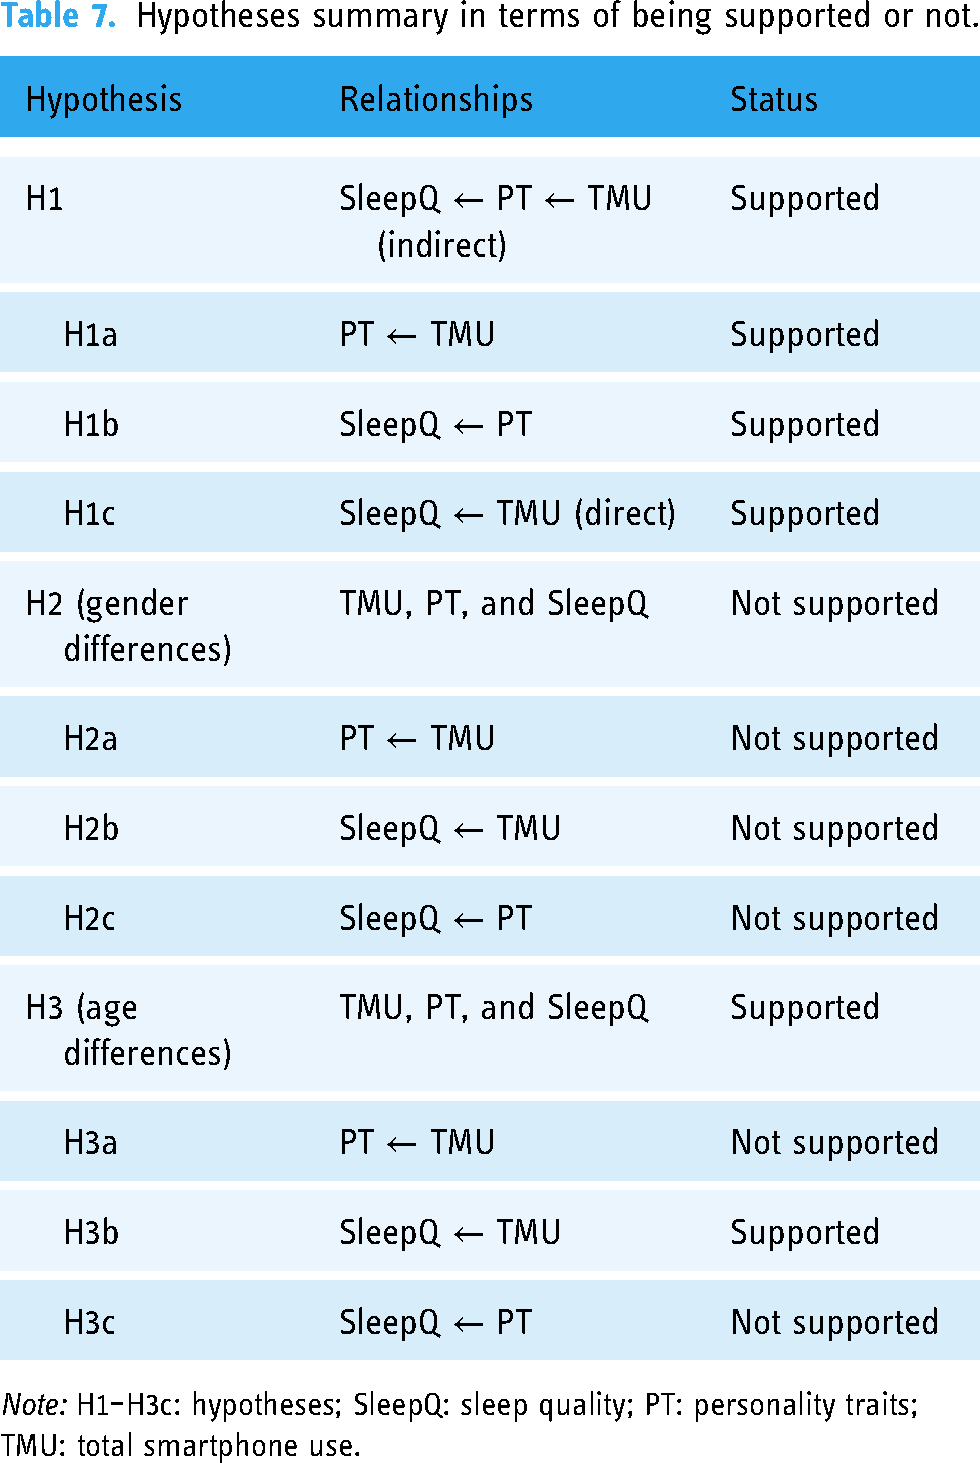
Note: H1–H3c: hypotheses; SleepQ: sleep quality; PT: personality traits; TMU: total smartphone use.
Multiple group analyses results
Multi-group analyses were performed to determine group differences based on gender, that is H2 (H2a, H2b, and H2c), and age, that is H3 (H3a, H3b, and H3c). First, the configural test was performed to examine the overall structure of the unconstrained model for a good fit for both gender, and age by assessing the fit indices, that is CFI, TLI, GFI, RMSEA, and SRMR. For gender, CFI = 0.982, TLI = 0.978, GFI = 0.917, RMSEA = 0.027, and SRMR = 0.052 indicated a very good model fit. Likewise, for age, CFI = 0.961, TLI = 0.952, GFI = 0.896, RMSEA = 0.041, and SRMR = 0.058 indicated good model fit. Second, the metric invariance, and structural invariance tests were performed for both gender and age by constraining the MW and SW, respectively, which were examined by assessing the chi-square values. To test H2, and H3, the MW model, and SW model were compared with the unconstrained model for both gender and age separately. The chi-square p-values, that is (H2: p = 0.099 for MW, and p = 0.171 for SW), and (H3: p = 0.039 for MW, and p = 0.028 for SW) indicated that the effects of the mediating mechanism of PT in the relationship between TMU and SleepQ are not different between males and females, however, it is different between young and adults. These results supported H3 but did not support H2.
Furthermore, due to the significant differences in only age groups, we further created SW constraint models for age group differences only, that is TMU–PT–A (constrained the path from TMU to PT to be equal), TMU–SleepQ–A (constrained the path from TMU to SleepQ to be equal), and PT–SleepQ–A (constrained the path from PT to SleepQ to be equal) to test H3a, H3b, and H3c. These models were compared with the unconstrained model and examined by the chi-square p-value for significance. The chi-square values were examined, that is (H3a: p = 0.311 for TMU–PT–A) indicated that the strength of the relationship between TMU and PT is not different between young and adults, (H3b: p = 0.011 for TMU–SleepQ–A) indicated that the strength of the relationship between TMU and SleepQ is different between young and adults, and (H3c: p = 0.143 for PT–SleepQ–A) indicated that the strength of the relationship between PT and SleepQ is not different between young and adults. These results supported H3b and rejected both H3a and H3c.
Additionally, the direct, and indirect effects were also evaluated both for gender, and age. According to the results, for males, TMU (β = −0.813, SE = 0.051, and p < 0.001) has a significantly negative direct impact on SleepQ, and TMU (β = −0.177, SE = 0.034, and p = 0.154) has a non-significant indirect impact on SleepQ. For females, TMU (β = −0.634, SE = 0.059, and p = 0.003) has a significantly negative direct impact on SleepQ, and TMU (β = −0.188, SE = 0.049, and p = 0.227) has a non-significant indirect impact on SleepQ. Furthermore, for young, TMU (β = 0.000, SE = 0.013, and p = 0.481) has a non-significant direct impact on SleepQ, and TMU (β = 0.000, SE = 0.002, and p = 0.361) has a non-significant indirect impact on SleepQ. Whereas, for adults, TMU (β = −0.705, SE = 0.055, and p < 0.001) has a significantly negative direct impact on SleepQ, and TMU (β = −0.183, SE = 0.066, and p = 0.271) has a non-significant indirect impact on SleepQ. Figures 7 and 8 show the resulting SEM path models for gender and age, respectively.

(a) is the resulted model for males and (b) for females with path coefficients where “a” is the standardized-β for path: TMU to PT, “b” is β for path: PT to SleepQ, “c” is the β of direct, and “d” is the β for indirect effect.

(a) is the resulted model for young and (b) for adults with path coefficients where “a” is the standardized-β for path: TMU to PT, “b” is β for path: PT to SleepQ, “c” is the β of direct, and “d” is the β for indirect effect.
Discussion
PT are widely recognized as a crucial factor influencing various aspects of human behavior.87,88 Notably, the relationship between PT and SleepQ has been a subject of interest in research for several years, with numerous studies exploring the potential links and correlations between individual personality characteristics and sleep patterns. The study 129 examined the relationship between PT, excessive internet usage, and sleep-wake patterns but did not consider other sleep variables, such as sleep duration and disturbances, leaving room for further investigation. The relationship between PT and SleepQ was investigated by Gamaldo et al., 93 Hintsanen et al., 89 Kheirandish et al., 130 Lane et al., 131 and Soehner et al. 92 The existing literature on sleep and technology usage has several limitations. Most studies employ cross-sectional or subjective methods, relying on surveys and self-report measures, such as the PSQI, which assesses SleepQ based on participants’ subjective ratings. This approach may not accurately capture objective sleep patterns and technology use, highlighting the need for more robust and objective measures in future research.42,43,84,132–134
Our study addresses some of the limitations of previous research by utilizing objective measures of smartphone use, monitored over a 1-week period. Additionally, we extracted sleep variables from the smartphone data based on the human sleep-wake cycle, providing a more objective assessment of sleep patterns compared to relying on self-reported measures. This approach enhances the accuracy and reliability of our findings. Previous studies have investigated smartphone use and SleepQ among university students in both developed57,135 and developing countries. 136 Our research expands on these findings by exploring the mediating role of PT in the relationship between TMU and SleepQ among a diverse sample of students and non-student smartphone users. By examining this mediating role, we aim to provide a more nuanced understanding of the complex relationships between TMU, PT, and SleepQ. First, we tested our hypotheses, that is H1, H1a, H1b, and H1c to investigate whether PT mediates partially or fully the relationship between TMU and SleepQ. Second, we investigated whether the relationship between TMU and SleepQ changes among different groups of people according to gender and age. The results have revealed that there is partial mediation of PT in the relationship between TMU and SleepQ. The result of H1 suggests that TMU negatively impacts SleepQ; however, with the mediating positive role of PT, SleepQ can be enhanced. This aligns with findings that individuals with positive PT tend to have more stable circadian rhythms and better SleepQ. 38 Positive PT, such as higher levels of conscientiousness and agreeableness, may foster better SleepQ by promoting healthier sleep habits and reducing sleep disturbances. Regarding people with positive PT, Kim et al. 137 stated that positive people have more stable circadian rhythms.
The results of the H1a test revealed a significant negative impact of TMU on PT, which suggests that users with excessive smartphone use addiction will have a negative impact on their personality indicators. In this study, PT are measured via the BFI-10 scale, encompassing extraversion, agreeableness, conscientiousness, neuroticism, and openness. Our findings for H1a align with existing research, particularly Liu et al.'s 138 identification of specific pathways between the Big Five PT and problematic smartphone use symptoms. Similarly, H1a results converge with Horwood et al.'s 139 findings, which showed that problematic smartphone use is positively associated with neuroticism and negatively associated with agreeableness, conscientiousness, and openness. Furthermore, the results of H1a are also consistent with the investigation performed by Berner et al., 35 which revealed that total internet usage is negatively related to agreeableness, conscientiousness, and extraversion. These findings support the view that excessive technology use can adversely affect PT, which, in turn, can influence SleepQ. 140 This cumulative evidence reinforces the validity of our results and contributes to the growing body of research on PT and technology use. Moreover, our findings for H1b reveal that PT has a significant positive impact on SleepQ, aligning with Kim et al.'s 42 research. Their study found that individuals with negative PT tend to be poor sleepers, while those with positive PT report being good sleepers with healthy sleep patterns. Positive traits such as agreeableness and conscientiousness are linked to healthier sleep patterns, potentially due to their association with better emotional regulation and stress management. 141 Our results reinforce this association, highlighting the importance of PT in shaping SleepQ.
Furthermore, our investigation of H1c revealed a highly significant negative impact of TMU on SleepQ, indicating that excessive smartphone use is likely to substantially impair SleepQ. This finding aligns with the research work of Chi et al., 94 which demonstrated that excessive smartphone use leads to poorer SleepQ, delayed sleep onset, and shorter sleep duration. 94 Our results reinforce this association, highlighting the detrimental effects of excessive smartphone use on sleep patterns.
Additionally, to assess gender and age differences in the relationship between TMU and SleepQ, the results for H2 and H3 were examined. While H3 was supported, H2 was rejected, indicating that the mediating mechanism of PT in the relationship between TMU and SleepQ does not significantly differ between males and females. This aligns with previous research showing that gender may not be a decisive factor in the relationship between personality, technology use, and SleepQ.66,97 Such findings are consistent with some studies that have reported no substantial differences between men and women in internet usage patterns or duration.47,48 However, our results stand in contrast with other research suggesting that gender does play a role in internet addiction, with men typically exhibiting higher levels of internet addiction 50 and women being more prone to smartphone addiction. 51 Furthermore, H3 results revealed that the effects of the mediating mechanism of PT in the relationship between TMU and SleepQ are different between young and adults. Our findings are in line with the previous studies that addressed age differences in terms of PT,99,100 smartphone use,102,103,105 and SleepQ. 104 Whereas, there is only age differences contradiction with the research work done by Brubaker et al. 66 in terms of SleepQ. Younger individuals, who engage more frequently with smartphones and social media, may experience worse SleepQ due to higher levels of technology use and its impact on circadian rhythms and sleep habits. 102 The constant exposure to screen light and social media engagement can disrupt sleep patterns, leading to poorer SleepQ among younger people. In contrast, older individuals may have more established and stable sleep habits, resulting in less impact from smartphone use on their SleepQ. 104
The divergence from these studies may be due to variations in the methodology or demographic characteristics, particularly among populations categorized as “digital natives,” who have constant access to the internet through smartphones. 52 Furthermore, distinct usage patterns between genders have been highlighted in prior research, with girls more frequently using their phones for social and entertainment activities, such as online chatting and music, while boys tend to engage more in gaming. 53 These behavioral differences, though evident in broader studies, may not directly influence the PT–TMU–SleepQ relationship in the same way as general smartphone usage patterns do. This suggests that while gender differences exist in overall usage habits, they may not translate into meaningful differences in the psychological and behavioral mechanisms impacting SleepQ.
Implications
This study examines the relationship between smartphone use and SleepQ, focusing on PT as a mediating factor. Previous research suggests that individual differences in personality, such as sensation seeking, can be predicted by smartphone use patterns.142,143 Research has demonstrated the potential of social media data in predicting PT, 144 Moreover, recent studies have begun exploring smartphone use data as a means to infer PT, highlighting the promise of digital behavioral data in understanding individual personality characteristics. 145 Our research aligns with the expanding body of literature investigating the correlation between smartphone use and various psychological metrics. Notably, our study innovatively extracts insights into smartphone use patterns and SleepQ aspects from everyday smartphone use, 146 thereby enriching the existing knowledge in this field. When developing interventions to promote self-regulated smartphone use and enhance SleepQ, incorporating elements that account for individual PT may be beneficial. By considering personality factors, interventions can be tailored to address specific needs and behaviors, potentially leading to more effective and sustainable changes in smartphone use and sleep habits.
Our research can be applied to developing intelligent social media and mobile applications that prioritize users’ digital well-being, with personalization as a key acceptance factor. 147 Specifically, our findings can help optimize apps to promote healthy SleepQ, a crucial criterion for overall well-being. Just as in fields like drug abuse, 148 interventions and preventative techniques can be tailored to individual personalities in the context of smartphone use. For instance, digital well-being services like Google Digital Wellbeing can offer customized recommendations to promote mindfulness and self-regulation, such as limit setting, for users with poor sleep patterns and high conscientiousness. In contrast, users with poor sleep habits and low conscientiousness may require enhanced strategies, including temporary rewards, ongoing feedback, and reminders, 149 to achieve similar outcomes. This personalized approach can effectively promote healthy smartphone use and improve SleepQ. Additionally, our research also revealed a significant increase in the risk of poor SleepQ for smartphone users with low personality indicators, which refers to lower levels of positive traits such as agreeableness, conscientiousness, or extraversion. Individuals with lower scores on these traits may experience more difficulties in self-regulation, emotional management, and interpersonal relationships, which can lead to poorer SleepQ 150 Given that smartphone use can be a means of reducing stress and is one of the signs of technology addiction, 151 the combination signals a tendency for high stress, 152 and advice and features shall promote stress coping mechanisms. 153
Smartphone users who experience insomnia may benefit from interventions that are personalized for them to increase adherence and, ultimately, SleepQ. 154 Patients who suffer from sleeplessness have a significant likelihood of using smartphones as a coping mechanism. Knowing their PT makes it easier to tailor conventional solutions for insomnia, such as cognitive behavioral therapy, perhaps by analyzing the smartphone's usage patterns.155,156
Conclusion and future directions
This study revealed a significant negative indirect impact of TMU on SleepQ by taking PT as a mediator. We tested our hypotheses, that is H1 with sub-hypotheses H1a, H1b, and H1c for the overall mediating impact of PT in the relationship of TMU and SleepQ. The results supported H1 (result: PT mediate partially in the relationship), H1a (result: there is a negative significant impact of TMU on PT), and H1b positive significant impact of PT of SleepQ, whereas H1c (result: there is a negative significant impact of TMU on SleepQ) hence, H1 with sub-hypotheses, that is H1a, H1b, and H1c were supported by the findings. Furthermore, we performed multi-group analyses to check gender and age differences in the relationship. For such purposes, H2 was tested to check for gender differences. The results did not support H2 (result: the effects of the mediating mechanism of TMU in the relationship between PIU and SleepQ are not different between males and females). Looking at the rejection of H2, the sub-hypotheses of H2, that is H2a, H2b, and H2c were not supported. Similarly, H3 with sub-hypotheses H3a, H3b, and H3c were also tested. The results supported H3 (result: the effects of the mediating mechanism of TMU in the relationship between PIU and SleepQ are different between young and adults), and H2b (result: the strength of the relationship between TMU and SleepQ is different between young and adults), while H2a (result: strength of the relationship between TMU and PT is not different between young and adults), and H2c (result: the strength of the relationship between PT and SleepQ is not different between males and females) were not supported. The current findings contribute to the literature documenting the relationship among smartphone use, PT, and SleepQ.
There are several limitations in our investigation. We only considered smartphone use, even though users may also using tablets and personal computers. As a result, it is important to interpret our findings cautiously and refrain from generalizing them to technology use. Additionally, the purpose and intent of the user in utilizing that specific application were not gathered in this experiment. This could have given our analysis additional context and made it easier to group technology use according to its intended application. For instance, watching videos with calming music and scenery on YouTube can serve as a passive sleep aid. The same software can also be used more active way to watch live streaming and take part in commenting on it. Whether participants had flexible work schedules that would have allowed them to sleep at odd hours is another drawback of our study. By including more variables pertaining to participants’ physical and mental health, the study models can be made better. For instance, research indicates that anxious individuals have more irregular circadian rhythms, which can result in delayed sleep. 157 Therefore, it is best to interpret our data cautiously and to stick to smartphone use. This research can be expanded by considering the variety of apps used on smartphones and PT to predict SleepQ. The relationship among TMU, PT, and SleepQ can be further explored by taking smartphone use before and after sleep.
Our study's model fit evaluation relies on several GFI indices, such as the chi-square index, CFI, TLI, GFI, RMSEA, and SRMR. While we used thresholds commonly accepted in the literature, such as CFI and GFI values greater than 0.9, and RMSEA and SRMR values below 0.08, it is worth noting that the fixed thresholds for these indices have been debated. The chi-square index, in particular, can be sensitive to sample size, and some researchers suggest alternatives like the normed chi-square. Given that our sample size was 269, which exceeds 200, we utilized the normed chi-square to evaluate fit. Future research should consider a broader range of fit indices and thresholds to ensure the robustness and generalizability of findings, particularly in different research contexts.
Supplemental Material
sj-csv-1-dhj-10.1177_20552076241295797 - Supplemental material for Smartphone use and personality: Their effects on sleep quality across groups using mediation analysis
Supplemental material, sj-csv-1-dhj-10.1177_20552076241295797 for Smartphone use and personality: Their effects on sleep quality across groups using mediation analysis by Tauseef Ur Rahman, Zahoor Jan, Aftab Alam and Raian Ali in DIGITAL HEALTH
Supplemental Material
sj-docx-2-dhj-10.1177_20552076241295797 - Supplemental material for Smartphone use and personality: Their effects on sleep quality across groups using mediation analysis
Supplemental material, sj-docx-2-dhj-10.1177_20552076241295797 for Smartphone use and personality: Their effects on sleep quality across groups using mediation analysis by Tauseef Ur Rahman, Zahoor Jan, Aftab Alam and Raian Ali in DIGITAL HEALTH
Footnotes
Acknowledgement
This publication was supported by NPRP 14 Cluster grant #NPRP 14C-0916-210015 from the Qatar National Research Fund (a member of Qatar Foundation). The findings herein reflect the work and are solely the responsibility of the authors.
Contributorship
TR, ZJ, AA, and RA were involved in the conceptualization of the study. TR, AA and RA curated the data. Formal analysis was conducted by TR and verified by AA. Methodology of the statistical analysis was designed by AA and applied by TR. Original draft was written by TR and reviewed and edited by ZJ, AA, and RA.
Declaration of conflicting interests
The authors declared no potential conflicts of interest with respect to the research, authorship, and/or publication of this article.
Ethical approval
The ethics committee of Hamad Bin Khalifa University approved this study (REC number: QBRI-IRB 2021-08-102)
Funding
The authors received no financial support for the research, authorship, and/or publication of this article.
Guarantor statement
We, the undersigned, affirm that we have full access to all the data in this study and take complete responsibility for its integrity and accuracy. We have reviewed and approved the final manuscript for publication.
Guarantor
Dr Raian Ali, College of Science and Engineering, Hamad Bin Khalifa University, Doha, Qatar
raali2@hbku.edu.qa
Co-Guarantors
Mr Tauseef Ur Rahman
Department of Computer Science, Islamia College Peshawar, Pakistan.
tauseef@icp.edu.pk
Dr Aftab Alam
College of Science and Engineering, Hamad Bin Khalifa University, Doha, Qatar.
aftab@qau.edu.pk
Supplemental material
Supplemental material for this article is available online.
Appendix
A special e-sleep-wakeup cycle pattern detection and annotation software was developed to visualise the data of each participant and annotate the sleeping and wakeup times (Figure A1). The annotation interface is lengthy and difficult to demonstrate in the paper. Therefore, in Figure 4, we present the 14-hour smartphone use activities of a user. From the smartphone use activities, we were able to determine the sleeping time, wakeup time, sleep duration, smartphone use before e-sleep, and e-sleep distraction.
References
Supplementary Material
Please find the following supplemental material available below.
For Open Access articles published under a Creative Commons License, all supplemental material carries the same license as the article it is associated with.
For non-Open Access articles published, all supplemental material carries a non-exclusive license, and permission requests for re-use of supplemental material or any part of supplemental material shall be sent directly to the copyright owner as specified in the copyright notice associated with the article.