
Abstract
Objective
Despite interest in optimizing the electronic health record (EHR) to facilitate chronic disease care for conditions like rheumatoid arthritis (RA), progress in this area has been slow. EHR sidecar applications offer one solution, but little guidance exists to facilitate their successful development, deployment, and maintenance in the healthcare setting. We aimed to provide a roadmap for how to develop and deploy an EHR sidecar application based on our experience building a new EHR-integrated, patient-facing visualization tool that displayed disease outcomes to RA patients during a clinical visit (the “RA PRO dashboard”) in a large academic health center.
Methods
We describe the technical design and implementation of the RA PRO dashboard; report clinic workflow adaptations to incorporate this new technology; and discuss the resources required and challenges encountered in maintaining this application.
Results
The RA PRO dashboard required extensive human-centered design work, regulatory approvals, software development, user testing, integration with Epic-based workflows, and maintenance. Key requirements were prioritized based on the anticipated effects on usefulness and ease of use. Implementation science strategies were used to improve use of the dashboard in clinic and included education for patients, staff, and clinicians; reports of actual use of the dashboard and data quality; and regular meetings between the research team and clinicians to discuss and address barriers to use.
Conclusion
Successful development and deployment of an EHR-integrated application are resource-intensive and require technical, operational, and educational innovations. The roadmap presented in this study can serve as a resource for future developers.
Introduction
With an ever-growing body of electronic health record (EHR) data, including patient-reported outcomes (PROs), one important role of health information technology (IT) tools is to help summarize this data for incorporation into real-time clinical decision-making. Graphical displays of structured data (such as blood pressure, BMI, hemoglobin A1C, and other laboratory test results) are commonly available in many EHRs or patient portals. These tools can be used by clinicians or patients to quickly and efficiently visualize important health metrics, facilitating a more informed and collaborative approach to healthcare.1,2 However, there has been less progress in developing tools to track chronic disease outcomes effectively. For example, even when documented as structured data in the EHR, PROs are not easily tracked over time for seamless interpretation by clinicians or patients during a clinical visit.3,4
This gap highlights a significant challenge in modern healthcare IT: the need for more sophisticated systems that can not only capture and store data but also present it in a way that supports long-term health management and proactive care strategies.
Optimization of the EHR to facilitate chronic disease care has been slow. Approaches such as working with large EHR vendors to customize foundation software for chronic disease care, or constructing local customizations of existing EHR software, have yielded little progress. Other approaches such as developing parallel systems entirely outside the EHR come with significant drawbacks such as requiring clinicians to work with multiple interfaces, which can be cumbersome and time-consuming. EHR sidecar applications offer a potential solution to some of these challenges because these applications offer more design flexibility and can fully integrate with the EHR, thereby avoiding the complexities and inefficiencies associated with interacting with multiple applications. By seamlessly embedding within the existing EHR infrastructure, sidecar applications can enhance the functionality of the EHR without the need for extensive overhauls or parallel systems. This integration allows for a more streamlined and cohesive user experience, enabling clinicians to focus more on patient care rather than on managing disparate technological tools.
Informed by digital innovation best practices, we present a roadmap for the successful development, integration, and maintenance of an EHR sidecar application for a common chronic condition, rheumatoid arthritis (RA). RA is a chronic inflammatory disease in which individuals develop joint pain, stiffness, and swelling. It is a pertinent case study for development of a sidecar application because the condition has several key disease outcomes, including disease activity, functional status, and pain, which are captured routinely as structured fields in the EHR. However, prior studies have shown that communication around these outcomes, even when documented in the EHR, is limited in real-world practice.5–8 In this paper, our goal was to describe the processes associated with the development, deployment, evaluation, and maintenance of the RA dashboard in a large health system. We provide a roadmap based on our experience building a new EHR-integrated, patient-facing visualization tool that displayed disease outcomes to RA patients during a clinical visit (the “RA PRO dashboard”) in a large academic health center.
Methods
We used the proposed guidelines for health research involving design to describe building and deploying the RA PRO dashboard, an EHR application to display real-time PROs data. 9
Approach
Our overall approach was based on an adaptation of a well-known digital innovation process to describe the development, integration, and maintenance of our EHR sidecar application. 10 The roadmap includes human-centered design (HCD), Agile product development, and lean/clinic deployment and was divided into a “problem-solving phase” and “execution and solution-building phase” (see Figure 1).

Roadmap for the development and deployment of an EHR sidecar application to track patient outcomes in rheumatoid arthritis.
Frameworks
We used two frameworks to inform our approach to development and deployment of the RA PRO dashboard: First, we used the technology acceptance model (TAM) as the guiding theoretical framework for feature selection. 11 The TAM is a validated model commonly used in healthcare settings to understand and explain user acceptance, adoption, and use of new technologies. 12 The model theorizes that a user's intention to use (acceptance) and usage behavior (actual use) of technology are affected by their perceptions of its usefulness (increased benefits and positive outcomes when adopted/used) and ease of use (degree to which using the technology is free of effort). 13 Within the TAM framework, we considered both patients and clinicians to be users of the RA PRO dashboard, since the dashboard was designed to support communication about RA outcomes during the clinical visit.
Second, we used the Consolidated Framework for Implementation Research (CFIR) as a guiding framework for clinic deployment of the RA PRO dashboard. CFIR is commonly used in studies of implementation of new processes or tools to highlight key domains that can facilitate or create barriers to actual use (intervention characteristics, outer setting, inner setting, characteristics of individuals, and the process of implementation). 14
Timeline
Building and deploying the RA PRO dashboard took over 3 years (May 2018 to October 2021), starting with the HCD work, through regulatory approvals, application build, user testing, and deployment (see Appendix 1). The prolonged timeline was partly attributable to the COVID-19 pandemic in 2020–2021, when development stopped, while our technology partners were occupied developing pandemic-related health IT tools for the health system.
Dashboard development team
Our research team, comprised of rheumatologists, qualitative researchers, health educators, informaticists, and research coordinators, partnered with a technology team (the University of California San Francisco (UCSF) School of Medicine technology team or SOM-Tech) that included designers, software engineers, and a project manager. SOM-Tech is a full-service team, including designers, developers, analysts, project managers, and quality assurance engineers. Because SOM-Tech is embedded within UCSF Health, the group was familiar with pros and cons of different application architectures and knowledgeable about the security and other regulatory processes required to implement the project.
Clinical setting and patients
We designed the dashboard to be deployed in the rheumatology clinic of UCSF medical center (a large academic medical center in Northern California), which uses Epic as its EHR vendor. This is a teaching clinic with approximately 12 attending physicians who see their own patient panels on 1–4 half days per week in addition to supervising trainees. Some clinicians attend in subspecialty clinics and hence see very few RA patients. Trainees (rheumatology fellows, occasionally internal medicine residents) have weekly half-day clinics and rotate through the clinic over 1–2-year periods. There is also occasionally a nurse practitioner seeing patients.
Patients come to the clinic from northern California and beyond. There are approximately 500 RA patients followed regularly at the clinic. Of note, at the start of the COVID pandemic, telehealth visits increased dramatically, from <5% of visits to >50% of visits, and this has been sustained through 2023. Although the HCD process was undertaken in both English and Spanish, most patients seen in this clinic are English speakers, so this version of the RA PRO dashboard was developed in English only.
Clinical workflows for collecting chronic disease outcomes (prior to deployment of the RA PRO dashboard)
In the UCSF Health rheumatology clinic, disease activity scores (specifically, CDAI scores 15 ) are collected during in-person visits with clinicians (Supplemental material 1). Typically, patients check in at the front desk and are provided a paper form that includes a patient global assessment, one of the components of the disease activity score. A medical assistant checks vital signs and enters the patient global assessment score into the EHR. The other components of the CDAI are entered during the clinical visit as part of the documentation of the physical exam, including tender joint count, swollen joint count, and evaluator (physician) global assessment score. The EHR automatically calculates the total CDAI score and creates a “smart data element” which can be pulled into the clinical note. In general, CDAI scores are not collected during telehealth visits.
Physical function scores, specifically Patient-Reported Outcomes Measurement Information System-physical function (PROMIS-PF10a scores), are also collected routinely at the clinic (Supplemental material 1).16,17 During the check-in process, patients are provided a paper form that includes the PROMIS-PF10a questionnaire. A medical assistant enters a raw score into the EHR. The EHR automatically calculates the PROMIS-PF10a t-score and saves it as a smart data element. For patients who have an active patient portal account, the PROMIS-PF12 can be collected online using a questionnaire module. Patients receive a message sent through the portal in advance of the visit with a link to the relevant survey. In this case, the t-score is also saved as a smart data element.
Pain scores are collected by medical assistants during the check-in process using a Likert scale (0–10) for both in-person and telehealth visits (Supplemental material 1).18,19
Process for the development and deployment of the RA PRO dashboard
We followed the roadmap laid out in Figure 1, including HCD, Agile product development, and clinic deployment/lean principles.
Design thinking
We undertook a HCD process, including focus groups and interviews with patients and clinicians to define the clinical opportunity for the RA PRO dashboard. A verbal consent was obtained from all study participants prior to participation in the focus group discussions and interviews. The informed consent script was reviewed and approved by the UCSF Institutional Review Board. Findings from this process, along with the TAM framework, guided our identification of key features for the application (a “minimal viable product”).
Agile development
Once we had defined a minimally viable product, we undertook an Agile development process, which involved the following: (a) choosing an application architecture that would allow for EHR integration, (b) obtaining risk assessment and regulatory approvals, (c) Scrum process (multiple 2-week sprints of actual development to build the application), and (d) launching the application to a test environment and user testing.
Choosing the application architecture: As described elsewhere, several options exist for how EHR integration can be achieved.
20
We worked with our technical team to understand pros and cons of several approaches, including using native Epic tools, developing an API within Epic, or using a sidecar application (Table 1). We ultimately settled on a sidecar application since this would allow maximal flexibility in designing the user interface (UI). The technical team also used the security and application architecture best practices at our institution to help evaluate various approaches.
21
Risk assessments and regulatory approvals: At our institution, the Digital Diagnostics and Therapeutics (DD&T) committee oversees and supports the extraction of real-time data from Epic hyperspace via the use of APIs.
22
The role of the DD&T includes coordinating approvals from the Privacy, Legal, Risk, Compliance, and Industry, Technology, and Alliances offices. DD&T also acts as an enterprise architectural review board to ensure proposed applications can be deployed safely. The DD&T process includes an assessment of whether the application qualifies as a medical device.
23
Agile development process to build the application: After the application architecture was planned and approvals obtained, the technical team used a Scrum approach for development.
24
Scrum focuses on the regular delivery of a working software to users and depends on user feedback throughout software development.
25
Scrum uses sprints, which are time-limited development efforts, usually lasting between 1 and 4 weeks. Sprint planning sessions were attended by members of the research and technical team. At the end of each sprint, there was an opportunity to demonstrate new features and provide feedback to designers and developers. Launching the application to a test environment, quality assurance, and user testing: The RA PRO dashboard application was first implemented in a sandbox environment that supported the development of applications that interface with the institution's EHR. The environment permits preproduction testing of the interface once the application is fully developed and facilitates production deployment with oversight from the DD&T committee to ensure the application is functioning correctly.
Pros and cons of possible EHR integration approaches.

Our development process included usability testing of the application in the development environment to help identify potential issues that needed to be addressed with further development or by training. User testing in the sandbox environment was completed by a UI designer with multiple clinicians. Clinicians were asked to comment on the auto-launch functionality of the sidecar application. They were then observed navigating the UI and performing specific tasks.
Clinic deployment/lean
We used the CFIR to guide our approach to deploying and evaluating the implementation of the RA PRO dashboard in the clinic. Steps included user orientation and continuing education and support, monitoring actual use of the dashboard, and establishing a comprehensive set of strategies to effectively manage and maintain the application over time.
Results
We followed the steps in the roadmap (Figure 1) to develop and deploy our RA PRO dashboard (detailed actions in Table 2).
Specific actions taken in the design, development, and deployment of the RA PRO dashboard.
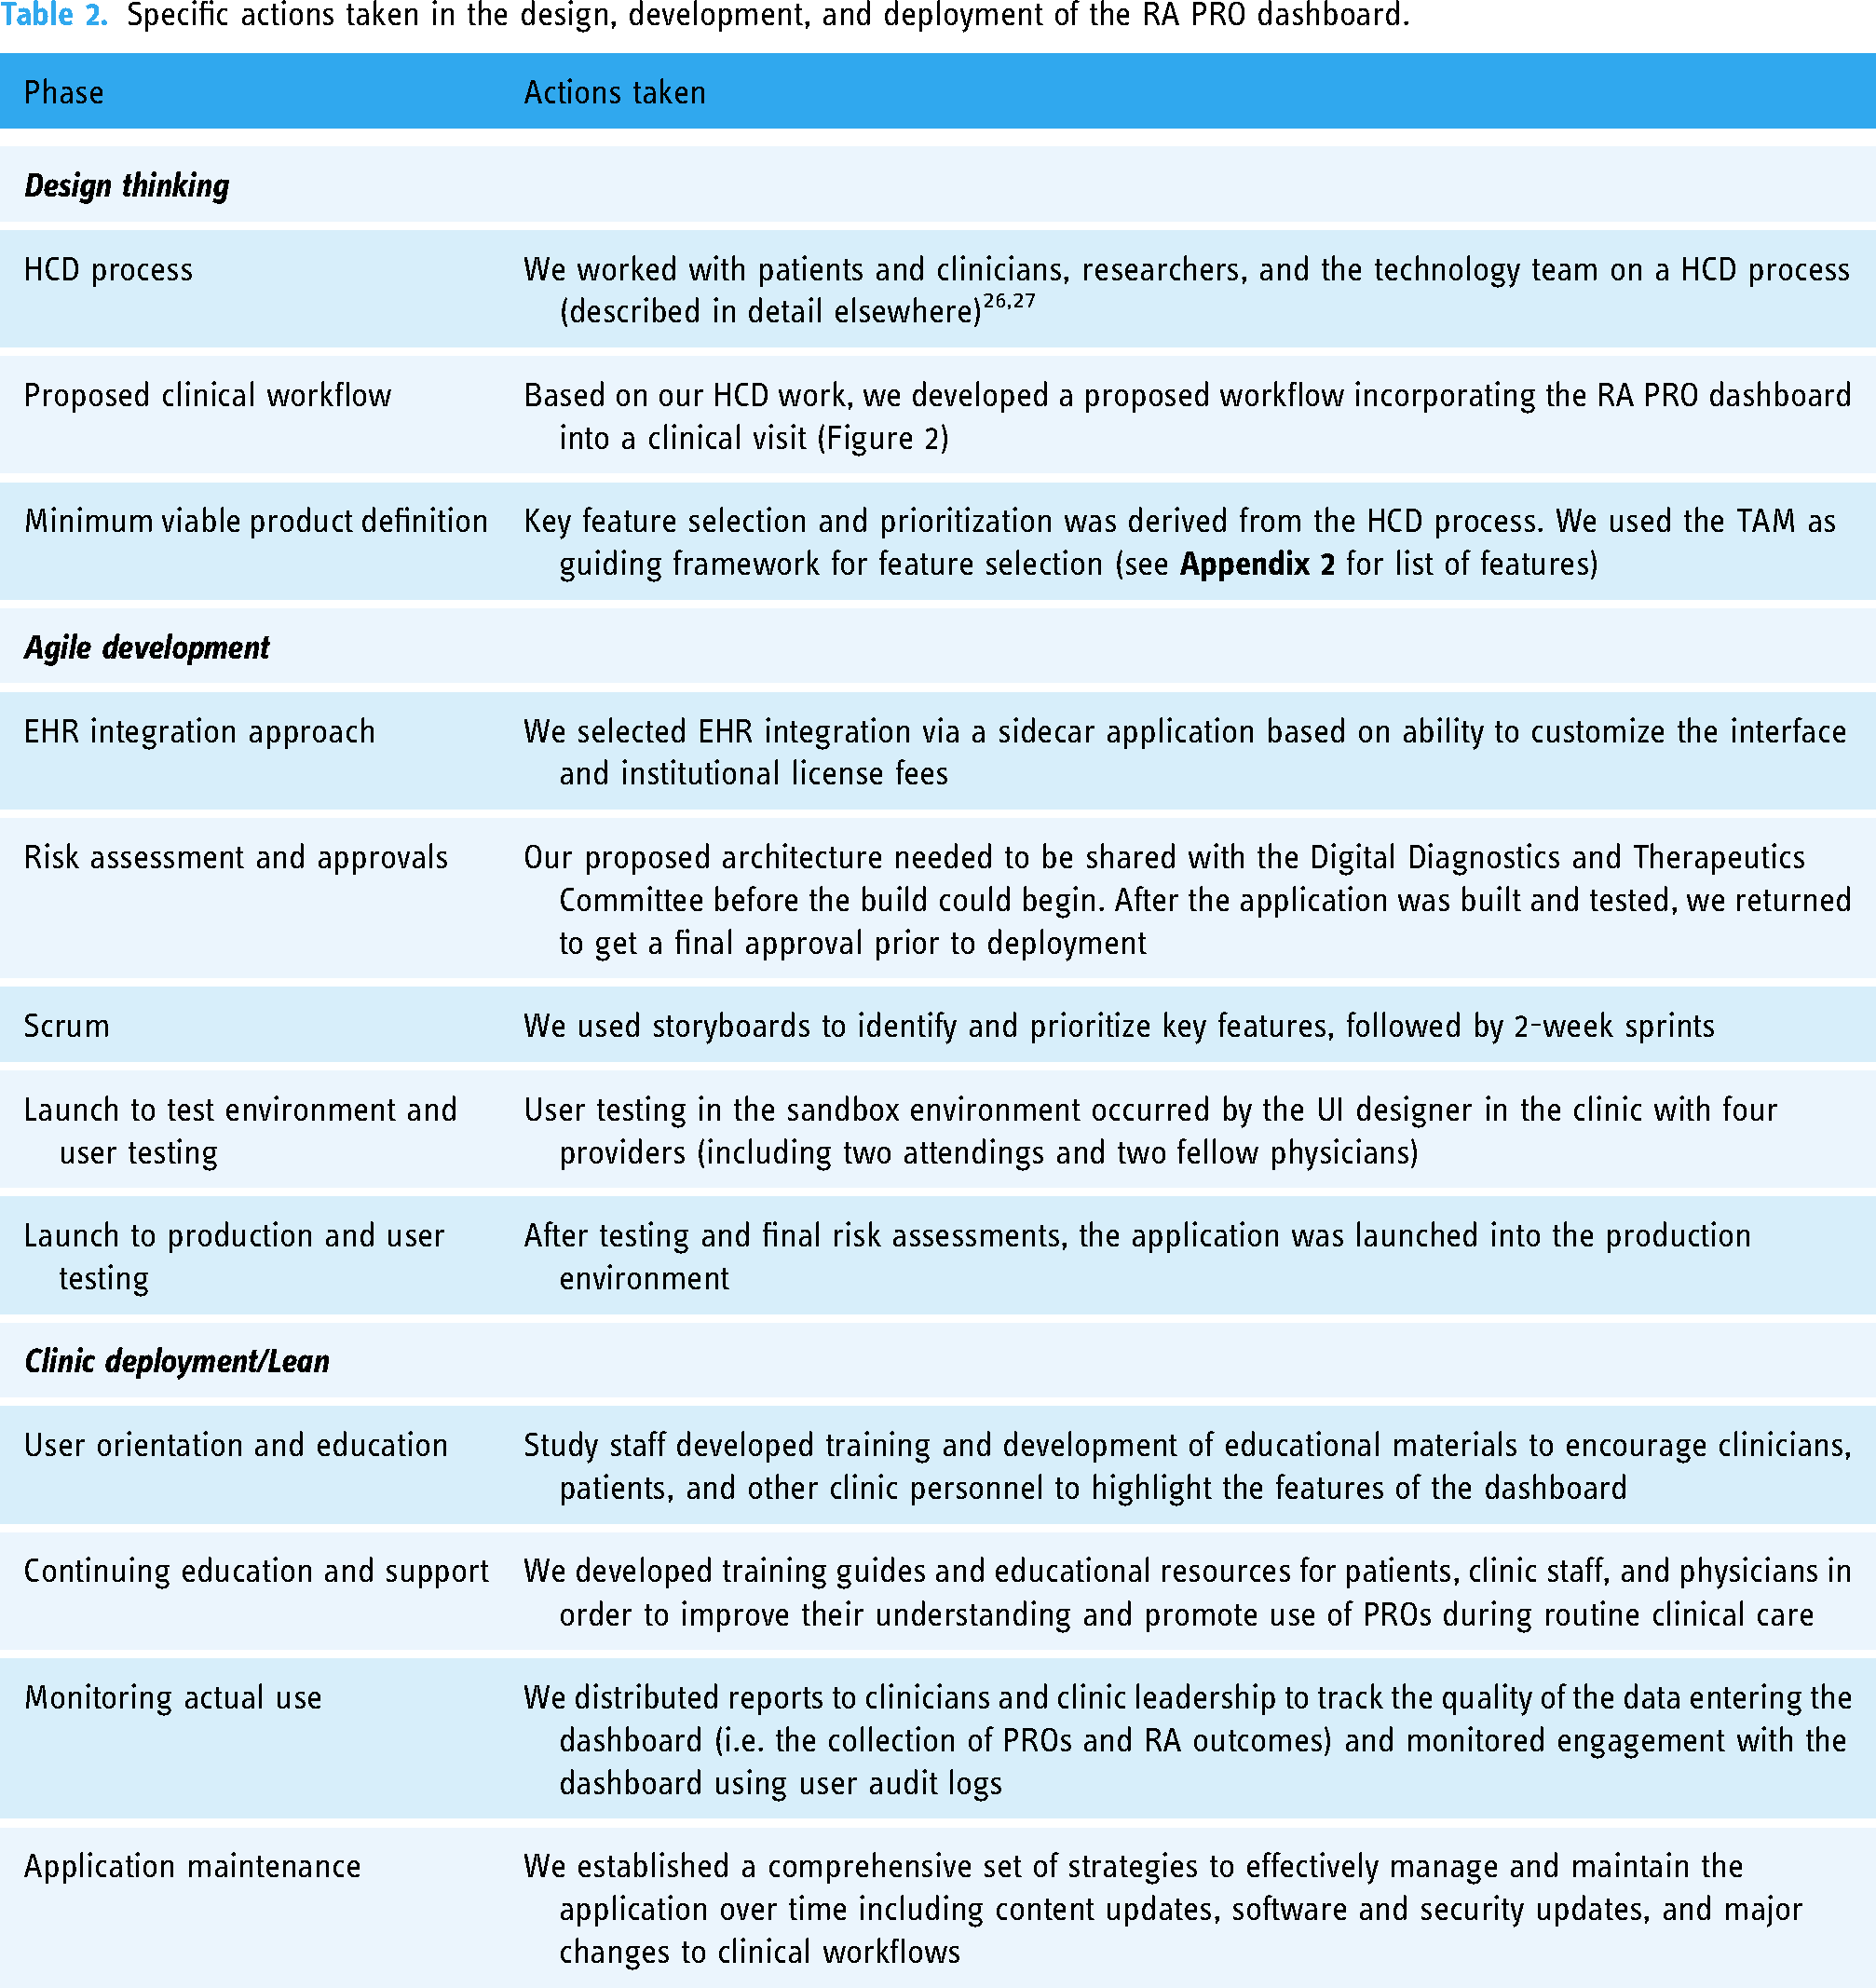
Design thinking
Following a HCD process, we developed a proposed clinical workflow and defined the minimum viable product for the dashboard (see Table 2 and Figure 2). Key features required for the RA PRO dashboard are described in Appendix 2. Based on concepts from the TAM framework, features were selected to increase the ease of use of the dashboard, including automatic launch with the EHR and various features to tailor the delivery of the information based on the preferences of the clinician and patient (e.g. toggle buttons to hide PROMIS and Pain graphs; hovering over data points to reveal score values and features designed for low-literacy patients such as smile/frown faces on axes and medication route graphics). Others were selected to maximize the usefulness of the dashboard, including the selection of specific outcomes, display of target ranges for each outcome, and the ability to scroll through historical outcomes and information about medication use over time. We also included a mechanism for assessing actual use of the dashboard through user logs.

Workflow incorporating the RA PRO dashboard into a clinical visit.
Historical RA outcome data is pulled from the EHR data warehouse and loaded into the dashboard. Outcomes collected during the check-in process (e.g. PROMIS-PF and pain scores) and disease activity scores documented by the clinician are loaded into the dashboard during the visit. The dashboard automatically launches as soon as the patient's chart is opened and can be refreshed to incorporate newly documented information at any time during the visit. Outcomes are displayed in a graphic format to show trends over time. At the end of the encounter, the clinician can print the view of the dashboard that they have discussed, complete with the patient's most recent scores. The patient can take the print-out home to communicate the results of their ongoing treatment with family, friends, or other clinicians in their care team.
Agile development
With the minimum viable product defined, we proceeded with an Agile development process to build the application.
Choosing an EHR integration approach: We elected to build the RA PRO dashboard as a sidecar application to the EHR using a Salesforce platform. This allowed the development to be focused on the UI as opposed to the application itself; some customization would still be possible. Potential barriers to using the sidecar application included licensing costs and that maintenance would require attention to both EHR and sidecar application upgrades. However, our technical team had experience with this approach and our institution had a discounted license cost, which made it more feasible. Risk assessments and regulatory approvals: We pursued our institution's established processes to gain approval to deploy the dashboard in a production environment. This included reviewing the application architecture, data flow, and proposed impacts to other systems through an established change control process.
28
The dashboard was deemed not to be a medical device, since it visualizes existing outcomes (CDAI, PROMIS-PF, and arthritis pain scores) and ranges, all of which have been previously established. Application build (Scrum): We used storyboards to identify and prioritize key features, followed by 2-week sprints. We completed the build after seven 2-week sprints, with one last sprint to complete the application after a long COVID-related delay. Technical optimizations included minimizing data load time for historical and real-time (same day) data, automatic launch once the patient's chart was opened to remove extra clicks, and weekly incremental data loads to improve application performance. The final application architecture is described in Appendix 3. Quality assurance and user testing: The RA PRO dashboard underwent a quality assurance process prior to being released into production to ensure that it accurately and reliably performed its intended functions in a real-world clinical setting. Usability testing by four clinicians (two attendings and two fellows) resulted in minor changes to the UI; for example, clinicians and patients commented that the text needed to be larger for optimal viewing and that the Y axis scales for each outcome needed to more clearly highlight target values (e.g. low disease activity or remission). This information was subsequently incorporated into our training materials. Screenshot of the final RA PRO dashboard is shown in Figure 3.
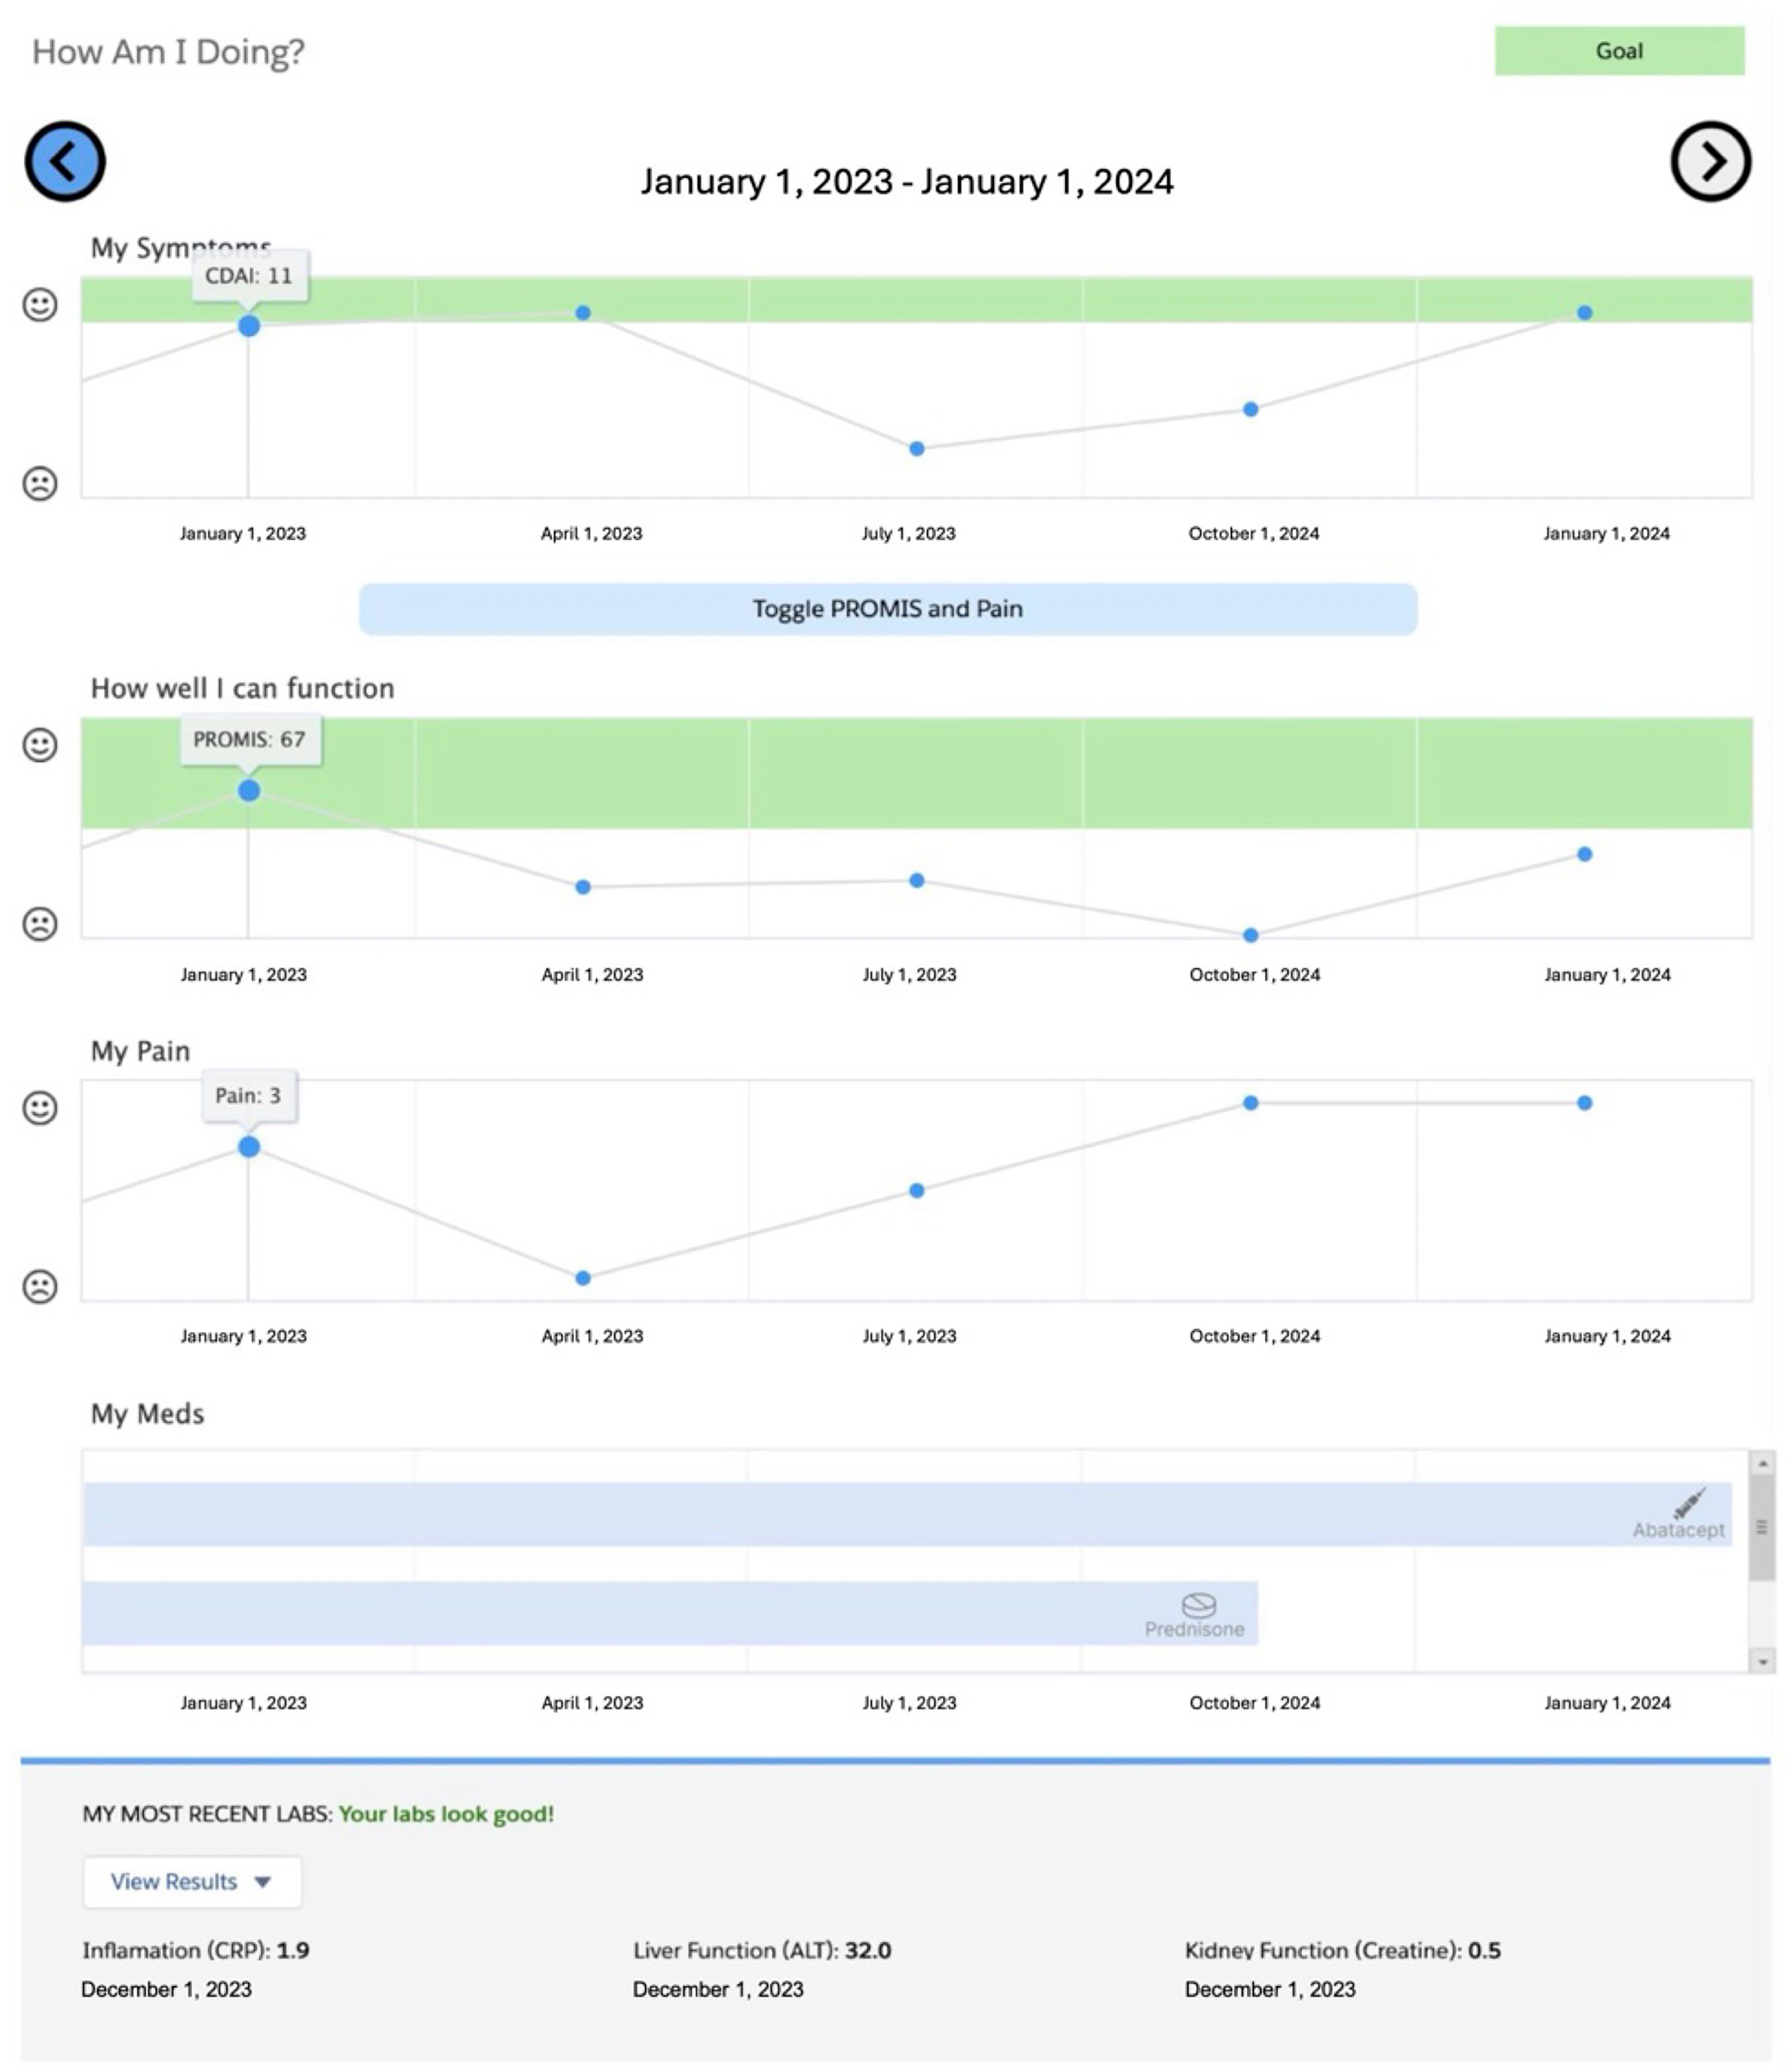
Final dashboard screenshot. 29
Clinic deployment/lean
The RA PRO dashboard was launched into the production environment in August 2021.
Supporting clinician engagement with the RA PRO dashboard: with the launch of the RA PRO dashboard, we incorporated principles of quality improvement and lean management to encourage the use of the dashboard during clinical encounters. Our approach focused on supporting positive user attitudes and behavioral intentions to use the dashboard according to the CFIR framework (see Table 3). Orientation sessions for the dashboard and clinician discussion groups in the several months after deployment were designed to increase clinicians’ awareness and understanding of the usefulness and usability dashboard and influence their intention to share it with their patients during clinical visits. Study staff also developed targeted educational materials to encourage clinicians, patients, and clinic staff to highlight the useful features of the dashboard. Data streams were already in place to monitor collection of RA outcomes including CDAI and PROMIS scores prior to launch, and these were continued after deployment: for example, we generated monthly reports showing the proportion of visits with these outcomes documented in the EHR, overall and by clinician (see Appendix 4).
Implementation science concepts as applied to the clinic deployment of the RA PRO dashboard.
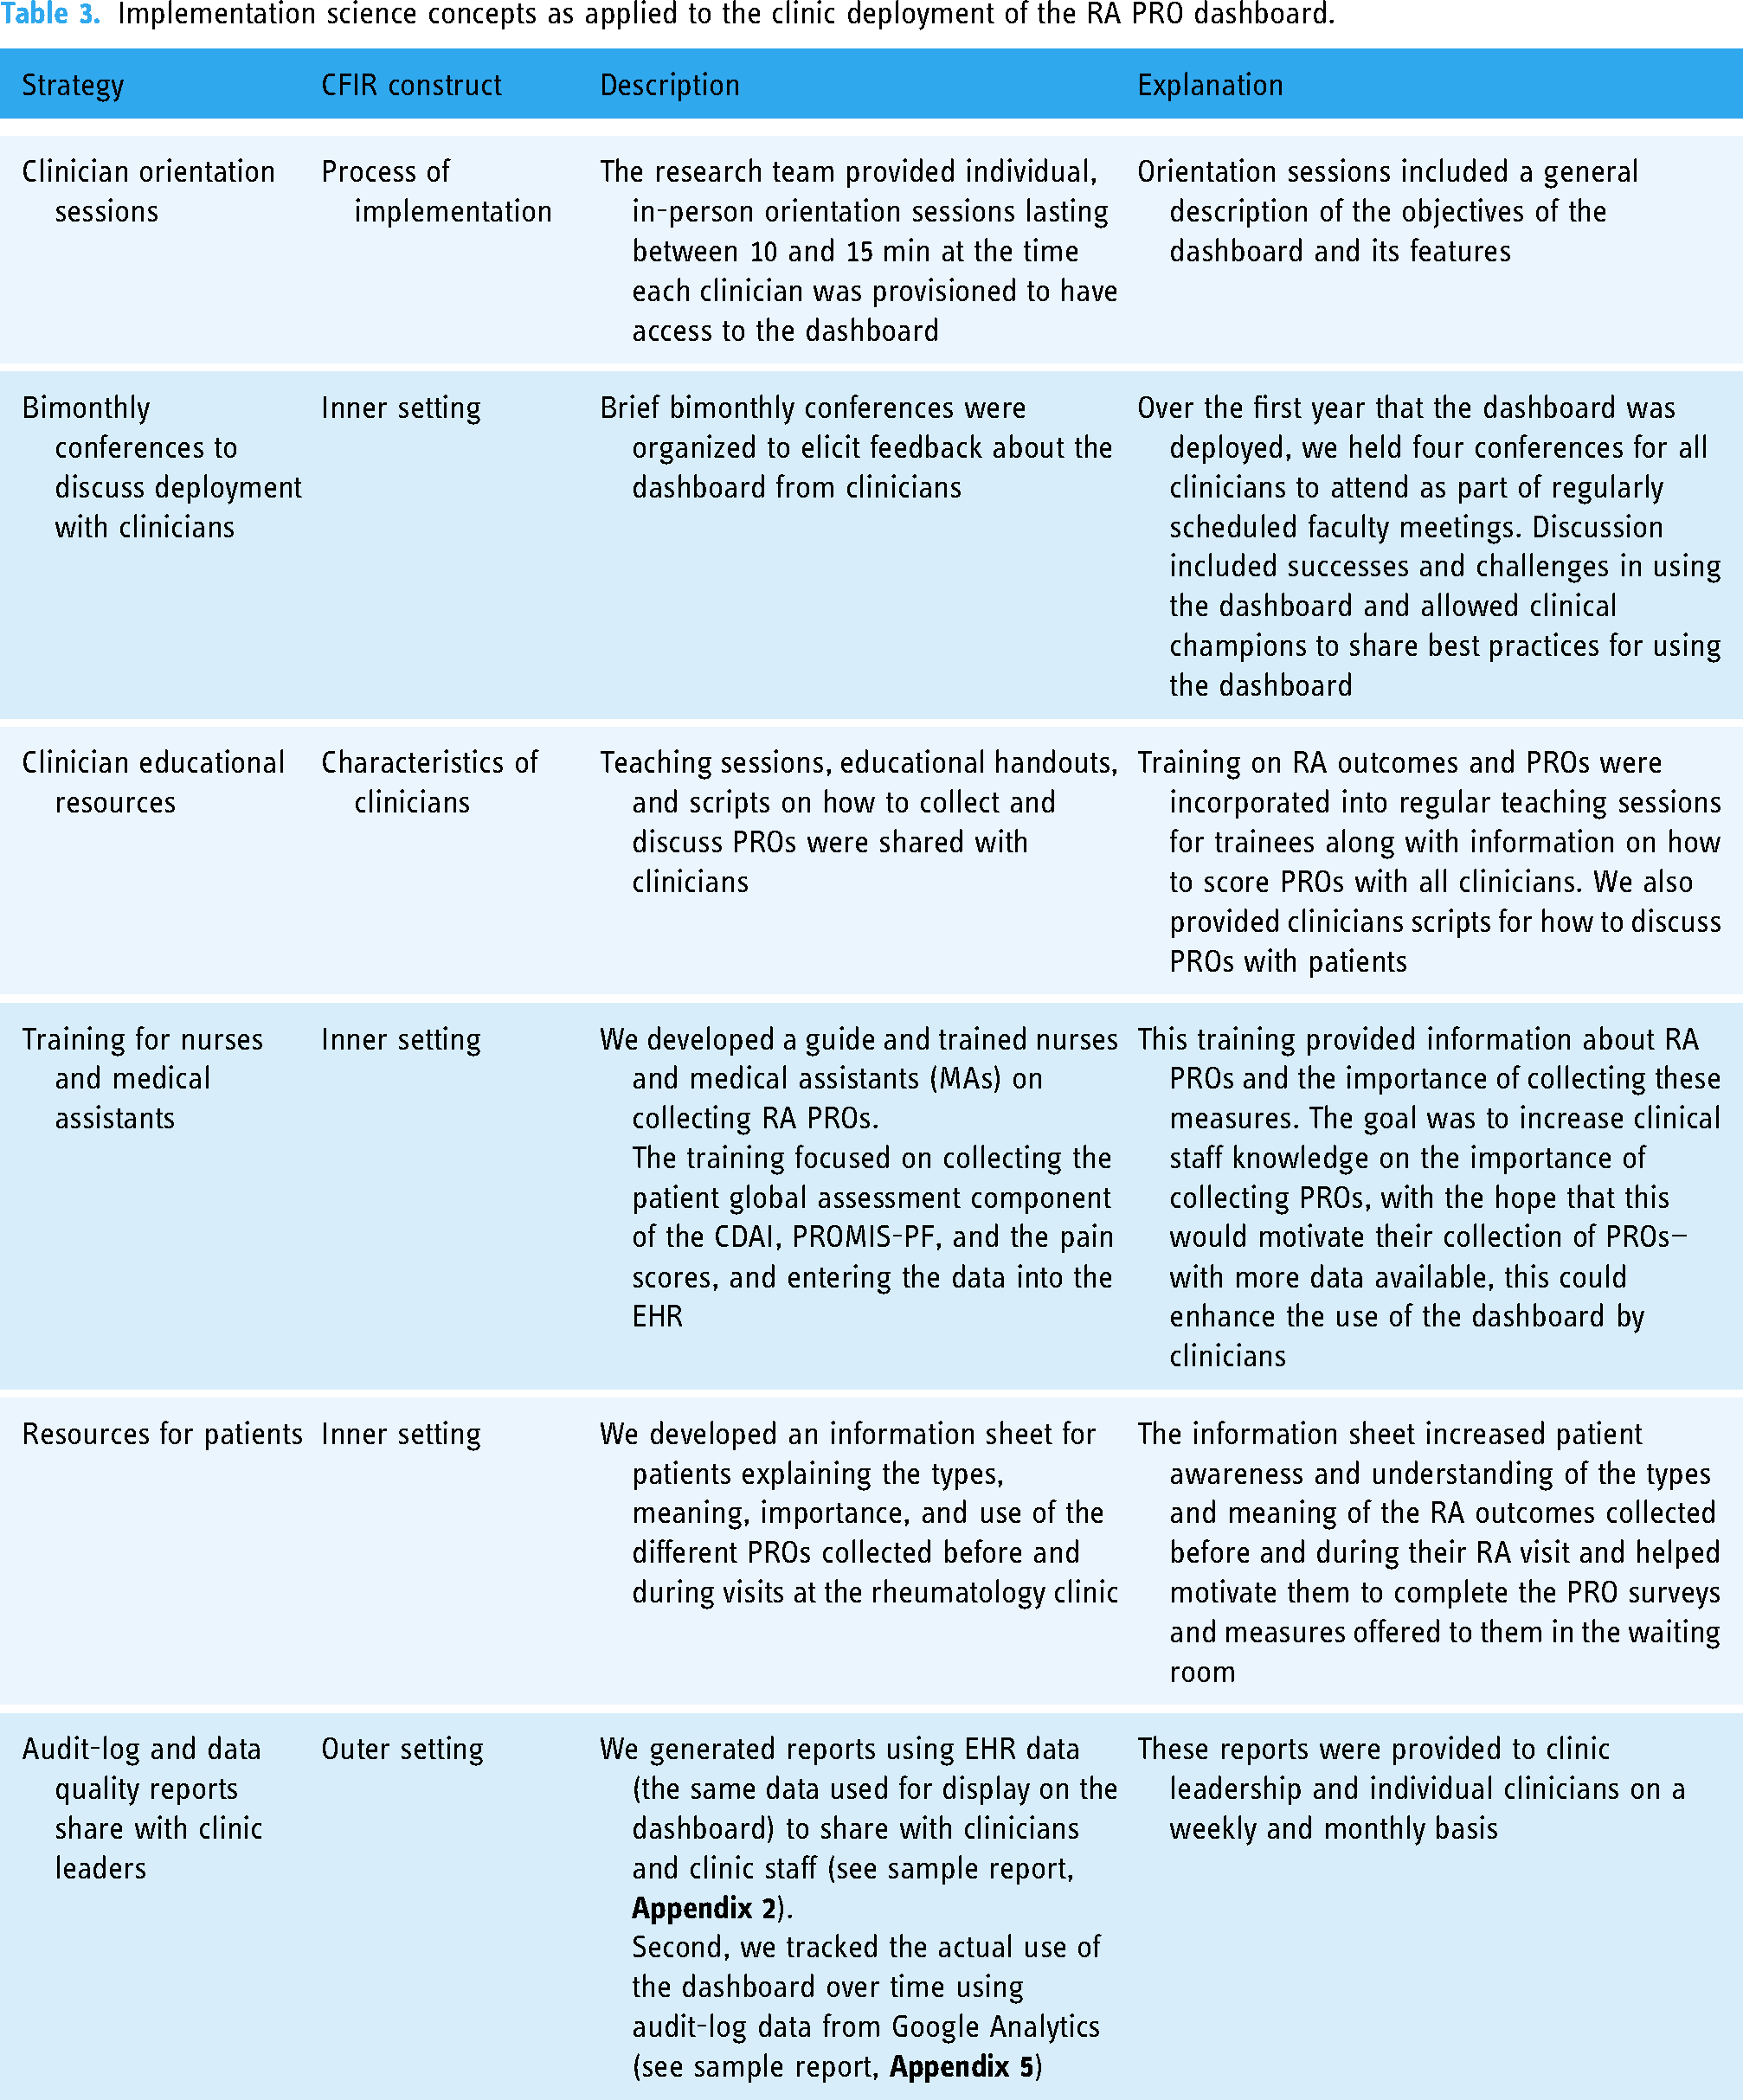
Because the RA PRO dashboard was deployed as part of a stepped-wedge pragmatic clinical trial, we were able to fund research staff to attend every clinic. Staff provided reminders to clinicians about using the dashboard and provided educational materials and print-outs of the RA PRO dashboard to patients upon arrival. Staff could also offer “at the elbow” support to clinicians who needed help accessing or interacting with the dashboard. Finally, we monitored actual engagement with the dashboard through user audit logs (Appendix 5). These data were shared with clinic leaders (medical director and staff supervisor) to review at weekly and monthly intervals and help address barriers to dashboard use for specific clinicians.
Ongoing maintenance issues
Collection of user log data was an important part of our lean process, since meaningful changes in number of sessions or specific actions on the dashboard heralded maintenance issues with the dashboard: these included content updates such as medication additions, software system updates, and major changes to clinical workflows (see Table 4).
Maintenance issues related to building an EHR-integrated sidecar application.

Discussion
In this paper, we present a roadmap for the successful development, integration, and maintenance of an EHR sidecar application for RA, a common chronic condition in ambulatory care. Grounded in HCD principles, the development process was led by an internal technology team familiar with established software development practices at our institution. To ensure effective adoption of the dashboard within our clinical setting, we invested significant efforts into clinical implementation, developing orientation and educational materials tailored for clinicians, medical staff, and patients. We also employed systems for monitoring data quality and tracking actual usage of the dashboard.
We found the TAM an especially useful framework for prioritizing tasks to maximize usability and ease of use for clinicians, clinic staff, and patients. As part of our approach, we prioritized certain features to improve the dashboard's functionality. These included personalized axes for graphical ranges, a toggle button to show or hide additional PROs and detailed lab data per physician preferences, and the inclusion of target ranges for disease activity and physical function represented by a “green zone” on each graph. However, during the development process, we had to make several challenging decisions when competing priorities arose. One example of such a trade-off was the choice to implement an auto-launch feature. This feature was designed to simplify the user experience by reducing potential friction when accessing the dashboard during clinical visits. 30 While this user-centric approach was beneficial for ease of use, it introduced challenges in tracking usage, as passive viewing could not be recorded in audit logs. Despite this limitation, we considered it a worthwhile trade-off because it prioritized removing barriers to utilization, ultimately benefiting both clinicians and patients.
Careful attention to human factors and workflows played a pivotal role in the successful deployment of the RA PRO dashboard within the clinic setting. Although our user testing suggested the use of the dashboard would be intuitive for most clinicians and staff, we discovered a few technical quirks during user testing that required repeated troubleshooting. We were also surprised that many clinicians found integrating the dashboard into their clinical routines challenging, particularly conversations with patients about the meaning and implications of functional status. Because the deployment was in the context of a pragmatic clinical trial, we had the advantage of having staff on-site to provide support to clinicians and to develop educational materials, including scripts, to assist them in effectively discussing the content of the dashboard during patient visits; such research resources to study implementation may not be available in purely operational deployments. In addition, systematic collection of survey and qualitative data through the pragmatic trial enabled us to tailor new materials and target clinicians with lower engagement with the dashboard. Finally, implementation of robust data tracking systems served multiple purposes: (1) audit use logs alerted our development team to any issues with the dashboard that required technical attention, and (2) PRO documentation-run chart reports were provided monthly to clinic leadership to inform them about the impact of the project on clinical metrics. This symbiotic relationship between the RA PRO dashboard's development and the pragmatic clinical trial emphasizes the benefits of aligning innovative healthcare solutions with research initiatives.
The development of health IT tools such as the RA PRO dashboard as a research project in an academic health setting comes with several inherent constraints, especially in terms of funding and timelines. The nature of funding for medical researchers requires careful planning and submission of grant proposals to fund the work months or years in advance. Compliance with regulatory standards and ethical review by an institutional review board adds complexity to the development process. Maintenance of such applications poses another significant challenge for physician researchers since budgets are limited once the period of grant funding has ended. In this project, we encountered issues related to numerous security updates, software upgrades, and evolving EHR structures, even over a relatively short, 2-year period. These maintenance challenges are typical for any digital health application, particularly one tightly integrated with the EHR, involving multiple software components, but for physician researchers, sustaining the effort and funding required for long-term sustainability can be problematic. 31
From the perspective of the healthcare system, the cost-effectiveness of a new sidecar application will be an additional critical component of a successful long-term deployment. Clearly, institutions must be prudent in selecting investments to avoid committing significant resources to applications or features that do not yield substantial benefits. However, assessing the effectiveness of an application may be challenging. The impact on clinical outcomes may be slow to materialize; improvements in patient satisfaction, self-efficacy, or patient-doctor communication might be more immediate but harder to quantify or may not directly translate to into measurable clinical benefits. Future studies should include a comprehensive cost–benefit analysis to determine the financial viability of maintaining the dashboard in the long-term, considering both direct costs, such as development and maintenance expenses, and indirect benefits, such as potential improvements in chronic disease management that could lower long-term healthcare costs.
In conclusion, we have outlined a roadmap for the successful development and deployment of an EHR-integrated sidecar application, drawing insights from the Gartner model to describe the constraints often encountered in large health systems and academic funding timelines. To facilitate the effective adoption of clinical dashboards like the RA PRO dashboard, we recommend the creation of comprehensive training materials tailored for clinicians, medical staff, and patients. Maintenance challenges, including software and security updates, should be anticipated and addressed proactively. The main limitation of this roadmap is that it may not be generalizable to other institutions or healthcare settings. However, we believe that many of the concepts and phases we have outlined will have broad applicability across different environments.
Future studies with the RA PRO dashboard will focus on assessing patient and clinician perceptions of the dashboard's utility and measuring its impact on patient outcomes and clinician satisfaction within the framework of a stepped-wedge pragmatic trial. Additionally, future work could incorporate results of artificial intelligence simulations into the dashboard to visualize personalized predictions about how patients will respond to different medications. Such a forward-looking approach will be essential in advancing the capabilities of EHR-integrated applications and enhancing patient care.
Supplemental Material
sj-docx-1-dhj-10.1177_20552076241288739 - Supplemental material for A step-by-step roadmap for the development and deployment of an electronic health record sidecar application that tracks patient outcomes: The RA PRO dashboard
Supplemental material, sj-docx-1-dhj-10.1177_20552076241288739 for A step-by-step roadmap for the development and deployment of an electronic health record sidecar application that tracks patient outcomes: The RA PRO dashboard by Gabriela Schmajuk, Catherine Nasrallah, Beth Berrean, Jonathan Prugh, Cherish Wilson, Alicia Hamblin, Cammie Young, Lindsay Jacobsohn, Julia Kay, Jing Li, Emma Kersey, Meera Subash, Sara Murray and Jinoos Yazdany in DIGITAL HEALTH
Footnotes
Acknowledgments
We would like to acknowledge UCSF SOM-Tech engineers and designers for support developing the RA PRO dashboard application. We used ChatGPT 4.0 for light editing of the manuscript only.
Contributorship
GS and JY conceived the study and were involved in protocol development and ethical approval. GS, BB, JP, MS, SM, and JY were involved in the development of the dashboard. GS, CN, CW, AH, CY, LJ, and JY were involved in patient recruitment and development of implementation tools. JK, JL, and EK were involved in data analysis. GS wrote the first draft of the manuscript. All authors reviewed and edited the manuscript and approved the final version of the manuscript.
Declaration of conflicting interests
Dr. Yazdany has received independent grant support from Aurinia, Gilead, and the BMS Foundation. She has consulted for Aurinia, Astra Zeneca, UCB, and Pfizer. Dr. Murray has consulted for HealthEx and received honoraria from Kaiser, Sutter Health, CME-Essentials and The Doctor’s Company. Other authors report no potential conflicts of interest.
Ethical approval
Development and testing of the RA PRO dashboard was approved by the UCSF IRB (number 15-18282).
Funding
The authors disclosed receipt of the following financial support for the research, authorship, and/or publication of this article: This work was supported by the Agency for Healthcare Research and Quality (AHRQ) (R01HS025405).
Guarantor
GS
Supplemental material
Supplemental material for this article is available online.
Appendix
References
Supplementary Material
Please find the following supplemental material available below.
For Open Access articles published under a Creative Commons License, all supplemental material carries the same license as the article it is associated with.
For non-Open Access articles published, all supplemental material carries a non-exclusive license, and permission requests for re-use of supplemental material or any part of supplemental material shall be sent directly to the copyright owner as specified in the copyright notice associated with the article.