
Abstract
Objective
Neonates’ physiological immaturity and complex dosing requirements heighten their susceptibility to medication administration errors (MAEs), with the potential for severe harm and substantial economic impact on healthcare systems. Developing an effective risk prediction model for MAEs is crucial to reduce and prevent harm.
Methods
This national-level, multicentre, prospective direct observational study was conducted in neonatal intensive care units (NICUs) of five public hospitals in Malaysia. Randomly selected nurses were directly observed during medication preparation and administration. Each observation was independently assessed for errors. Ten machine learning (ML) algorithms were applied with features derived from systematic reviews, incident reports, and expert consensus. Model performance, prioritising F1-score for MAEs, was evaluated using various measures. Feature importance was determined using the permutation-feature importance for robust comparison across ML algorithms.
Results
A total of 1093 doses were administered to 170 neonates, with mean age and birth weight of 33.43 (SD ± 5.13) weeks and 1.94 (SD ± 0.95) kg, respectively. F1-scores for the ten models ranged from 76.15% to 83.28%. Adaptive boosting (AdaBoost) emerged as the best-performing model (F1-score: 83.28%, accuracy: 77.63%, area under the receiver operating characteristic: 82.95%, precision: 84.72%, sensitivity: 81.88% and negative predictive value: 64.00%). The most influential features in AdaBoost were the intravenous route of administration, working hours, and nursing experience.
Conclusions
This study developed and validated an ML-based model to predict the presence of MAEs among neonates in NICUs. AdaBoost was identified as the best-performing algorithm. Utilising the model's predictions, healthcare providers can potentially reduce MAE occurrence through timely interventions.
Introduction
Medication administration errors (MAEs) are errors committed at the last stage of the medication use process, including prescribing, transcribing and documenting, dispensing, administering, and monitoring. 1 MAE has been defined as ‘any dose of medication administered (or omitted) that deviates from the patient's medication order’. 2 The consequences of MAEs may be debilitating, resulting in severe patient harm and a significant economic burden on healthcare services.3,4
MAEs continue to be a significant concern among neonates. The rate of MAEs among neonates (13.3%–94.9%) 5 was found to be higher in comparison to paediatric (12.8%–73%), adult (14.6%–41%), and elderly (54.2%–59%) populations. 6 The reasons behind this prevalent issue are likely related to the physiological immaturity of the neonates, the constant changes in their body size, and the numerous calculations and manipulations involved during the preparation and administration of medications.6,7
In 2017, the World Health Organization initiated the third Global Patient Safety Challenge which was aimed to reduce severe medication-related preventable harm by 50% over 5 years, globally. 8 In a systematic review conducted by Nguyen et al. which aimed to assess the effectiveness of interventions implemented in reducing all types of medication errors among neonates, 26 studies were identified to have reported the effectiveness of interventions in reducing MAEs specifically. Among these, eight studies were conducted to reduce various types of MAEs across all medications, while the remaining studies targeted specific types of MAEs such as wrong dose or wrong concentration. 9 Examples of interventions implemented in these studies were barcode medication administration safety,10,11 computerised physician order entry, 12 enhancement of medication distribution and supply, 13 education,7,14 and multifactorial interventions where different interventions were combined.15,16 Only two studies utilised error detection tools specifically developed to reduce wrong dose and frequency errors.17,18
In the past years, there has been an increase in the number of computational efforts, mainly around the adoption of artificial intelligence such as machine learning (ML) algorithms in the field of clinical pharmacy practice.19,20 Modern ML techniques have the potential to revolutionise predictive tasks in these fields.19,20 The use of artificial intelligence in pharmacy has been promoted by professional societies, in health policy reports or editorials.21–24 In systematic reviews that aimed to critically appraise the available literature on the predictive algorithms developed to detect inappropriate medication orders mainly prescription errors, artificial intelligence models have demonstrated great potential to optimise the clinical pharmacy practice services by improving patient safety and reducing medication errors.19,20 However, none of the ML algorithms reported in these systematic reviews were developed specifically to predict the presence of MAEs.
A ML-based model was recently developed by Yalcin et al. to identify the presence of medication errors such as prescription, preparation, administration, and monitoring errors among neonates in the neonatal intensive care unit (NICU). 25 The model found ten predictor variables for the identification of medication errors. However, the proposed model was developed to identify the presence of any medication errors and not specifically MAEs. This in turn makes it challenging for the users such as policymakers, stakeholders, and healthcare professionals to identify and plan where intervention should be implemented to prevent an impending error, whether during prescribing, administration, and/or monitoring. Therefore, this study aimed to develop and validate a ML-based model to predict the presence of MAEs specifically, among neonates in the NICU. Developing and validating a model that incorporates an extensive list of potential risk factors associated with MAEs would enable policymakers, stakeholders, and healthcare professionals such as nursing managers to predict the presence of MAEs among neonates in the NICU and implement a strategy to prevent the error from reaching the neonates.
Methods
Study design and setting
A prospective direct observational study was conducted between April 2022 and April 2023 in NICUs across five public hospitals under the Ministry of Health, Malaysia. 26 These hospitals, representing regions within the country, namely Northern, Central, Southern, East Coast, and East Malaysia were purposively chosen to reflect both major specialist hospitals and state hospitals. The characteristics of NICUs across five study sites varied in terms of medication distribution systems, type of prescription, availability of protocols for medication preparation and administration, personnel conducting clinical rounds, time of medication administration, personnel involved in medication preparation and administration, number of beds, and nurse-to-patient ratio. Details of these characteristics are available in Table 1.
Characteristics of study sites.

Sample
The sample size for determining factors associated with MAEs was calculated based on risk factor proportions obtained from a previous study with a similar setting. 7 The proportions of errors associated with the complexity of preparation were utilised to calculate the required sample size, resulting in a minimum of 1052 medication administrations. This sample size would provide at least 80% power assuming a two-tailed test and a type-1 error rate of 5%. Samples were allocated proportionally to the number of expected admissions in each study site.
Eligibility criteria
We only included medications prepared and administered by nurses via all routes, excluding enteral feedings, parenteral nutrition, blood-derived products, rectal administrations when neonatal-specific rectal dosage forms were unavailable, medical gases, dietary supplements and omissions of medication administration due to an absent patient or other relevant clinical reasons.
Data collection
Two experienced clinical pharmacists each with at least a decade of professional experience were tasked with carrying out the observations. Prior to beginning their observations, they received thorough training in the direct observation method based on the approach outlined by Barker and McConnell. 27 This training combined theoretical lessons with practical exercises. Additionally, they were required to pass a written examination, featuring video simulations of drug preparation and administration scenarios, with a minimum score of 80% before they could conduct observations on their own. The two observers were tasked with filling out the data collection form, based on their observations from the videos. They were evaluated based on the accuracy and completeness of their data collection forms. The videos were prepared by researchers well-versed in the direct observation method, who also evaluated the observers’ responses to determine their scores.
Pilot observations were conducted over three days to familiarise the observers with ward procedures and reduce the Hawthorne effect. All pilot observations were reviewed with the research team to confirm the observers’ understanding of the data collection procedures and ensure uniformity in the methods employed. However, data from these pilot observations were not included in the final analysis.
To further lessen the Hawthorne effect on the observed nurses, certain measures were taken during the data collection process. Nurses were informed that the study aimed to improve medication systems rather than evaluate individual practices. 28 An information sheet and an informed consent form were provided to the nurses and written consent was obtained before data collection. Before observing drug preparation and administration, patient-related information (e.g. age, gender, length of stay, current diagnosis) and medication-related details (e.g. name of medication prescribed, dosage, and frequency) were collected using a pre-designed data collection form, with written consent obtained from participating nurses.
The NICUs in the study sites were divided into different sections based on the ward layout and patient acuity levels. A section at each site was randomly selected before each round of observation using Excel’s random number generator to determine the nurse(s) who would be directly observed. Randomly selected nurses who provided written informed consent were then directly observed during the preparation and administration of the medications. Observers closely followed the consenting nurses throughout these processes. Direct observations were conducted during peak medication administration hours (07:00–22:00) on both weekdays and weekends, as identified during pilot observations. While four of the sites adhered to fixed medication administration schedules, one site followed prescription times, requiring extensive coverage across different times and days. To ensure data collection encompassed all administration times and days, observers maintained a table during data collection to track the distribution of drug observation rounds. During the observations, detailed information was recorded regarding medication preparation (e.g. reconstitution/dilution details, preparation time, expiration, solvent and diluent), administration (e.g. time, route, rate and compatibility), and ancillary procedures (e.g. labelling, double-checking, and interruptions).
For ethical reasons, observers intervened non-judgmentally when potentially harmful MAEs were detected, such as the administration of expired or deteriorated drugs or a tenfold overdose.29,30 These errors were recorded in the dataset under the assumption that they would have reached the patient if not addressed. After each observation round, demographic details of the administering nurse (e.g. years of experience, and education level) were recorded. To ensure validity, 10% of preparations and administrations were independently observed by the clinical pharmacist of the study site, separate from the research team altogether, alongside the primary observer. The findings had to be consistent between the pharmacist and observer for the data to be validated.31,32 After the entire data collection had been completed, each observation was then independently and individually assessed for errors by two clinical pharmacists who were not involved in the observations. Any disagreements were resolved through consensus with the research team. The study flowchart is available in Appendix 1 in the online supplemental materials.
Dataset description
The dataset from our direct observational study was used to develop the risk prediction model reported in this paper. The dataset had a total of 1093 observations. The target variable or outcome in this study was a binary variable which was the occurrence of MAEs in the NICU. MAE was defined as any deviation observed during the preparation or administration of medications from the medication order, the hospital policy, or the manufacturer's instructions in the product leaflet. 7
Each sample in the dataset is described by 16 features. These features were identified through a multi-faceted approach: (a) a systematic review of the underlying causes and risk factors of MAEs among neonates 5 ; (b) incident reports voluntarily reported to the Medication Error Reporting System (MERS) established by the Pharmaceutical Services Programme, Ministry of Health Malaysia; and (c) a consensus of an expert panel consisting of a paediatrician, a clinical pharmacist and a senior nurse who specialises in neonatology. These features were chosen based on their demonstrated relevance in existing literature and practical insights from healthcare professionals. The systematic review provided a comprehensive understanding of the causes of MAEs in NICUs, ensuring evidence-based features while the use of incident reports offered real-world data reflecting the specific challenges faced in Malaysian NICUs, allowing for the identification of contextually relevant predictors. The expert panel’s consensus further ensured that the selected features aligned with clinical practices and expert opinions, enhancing the model’s clinical applicability. The details of the features are provided in Table 2.
Description of dataset.
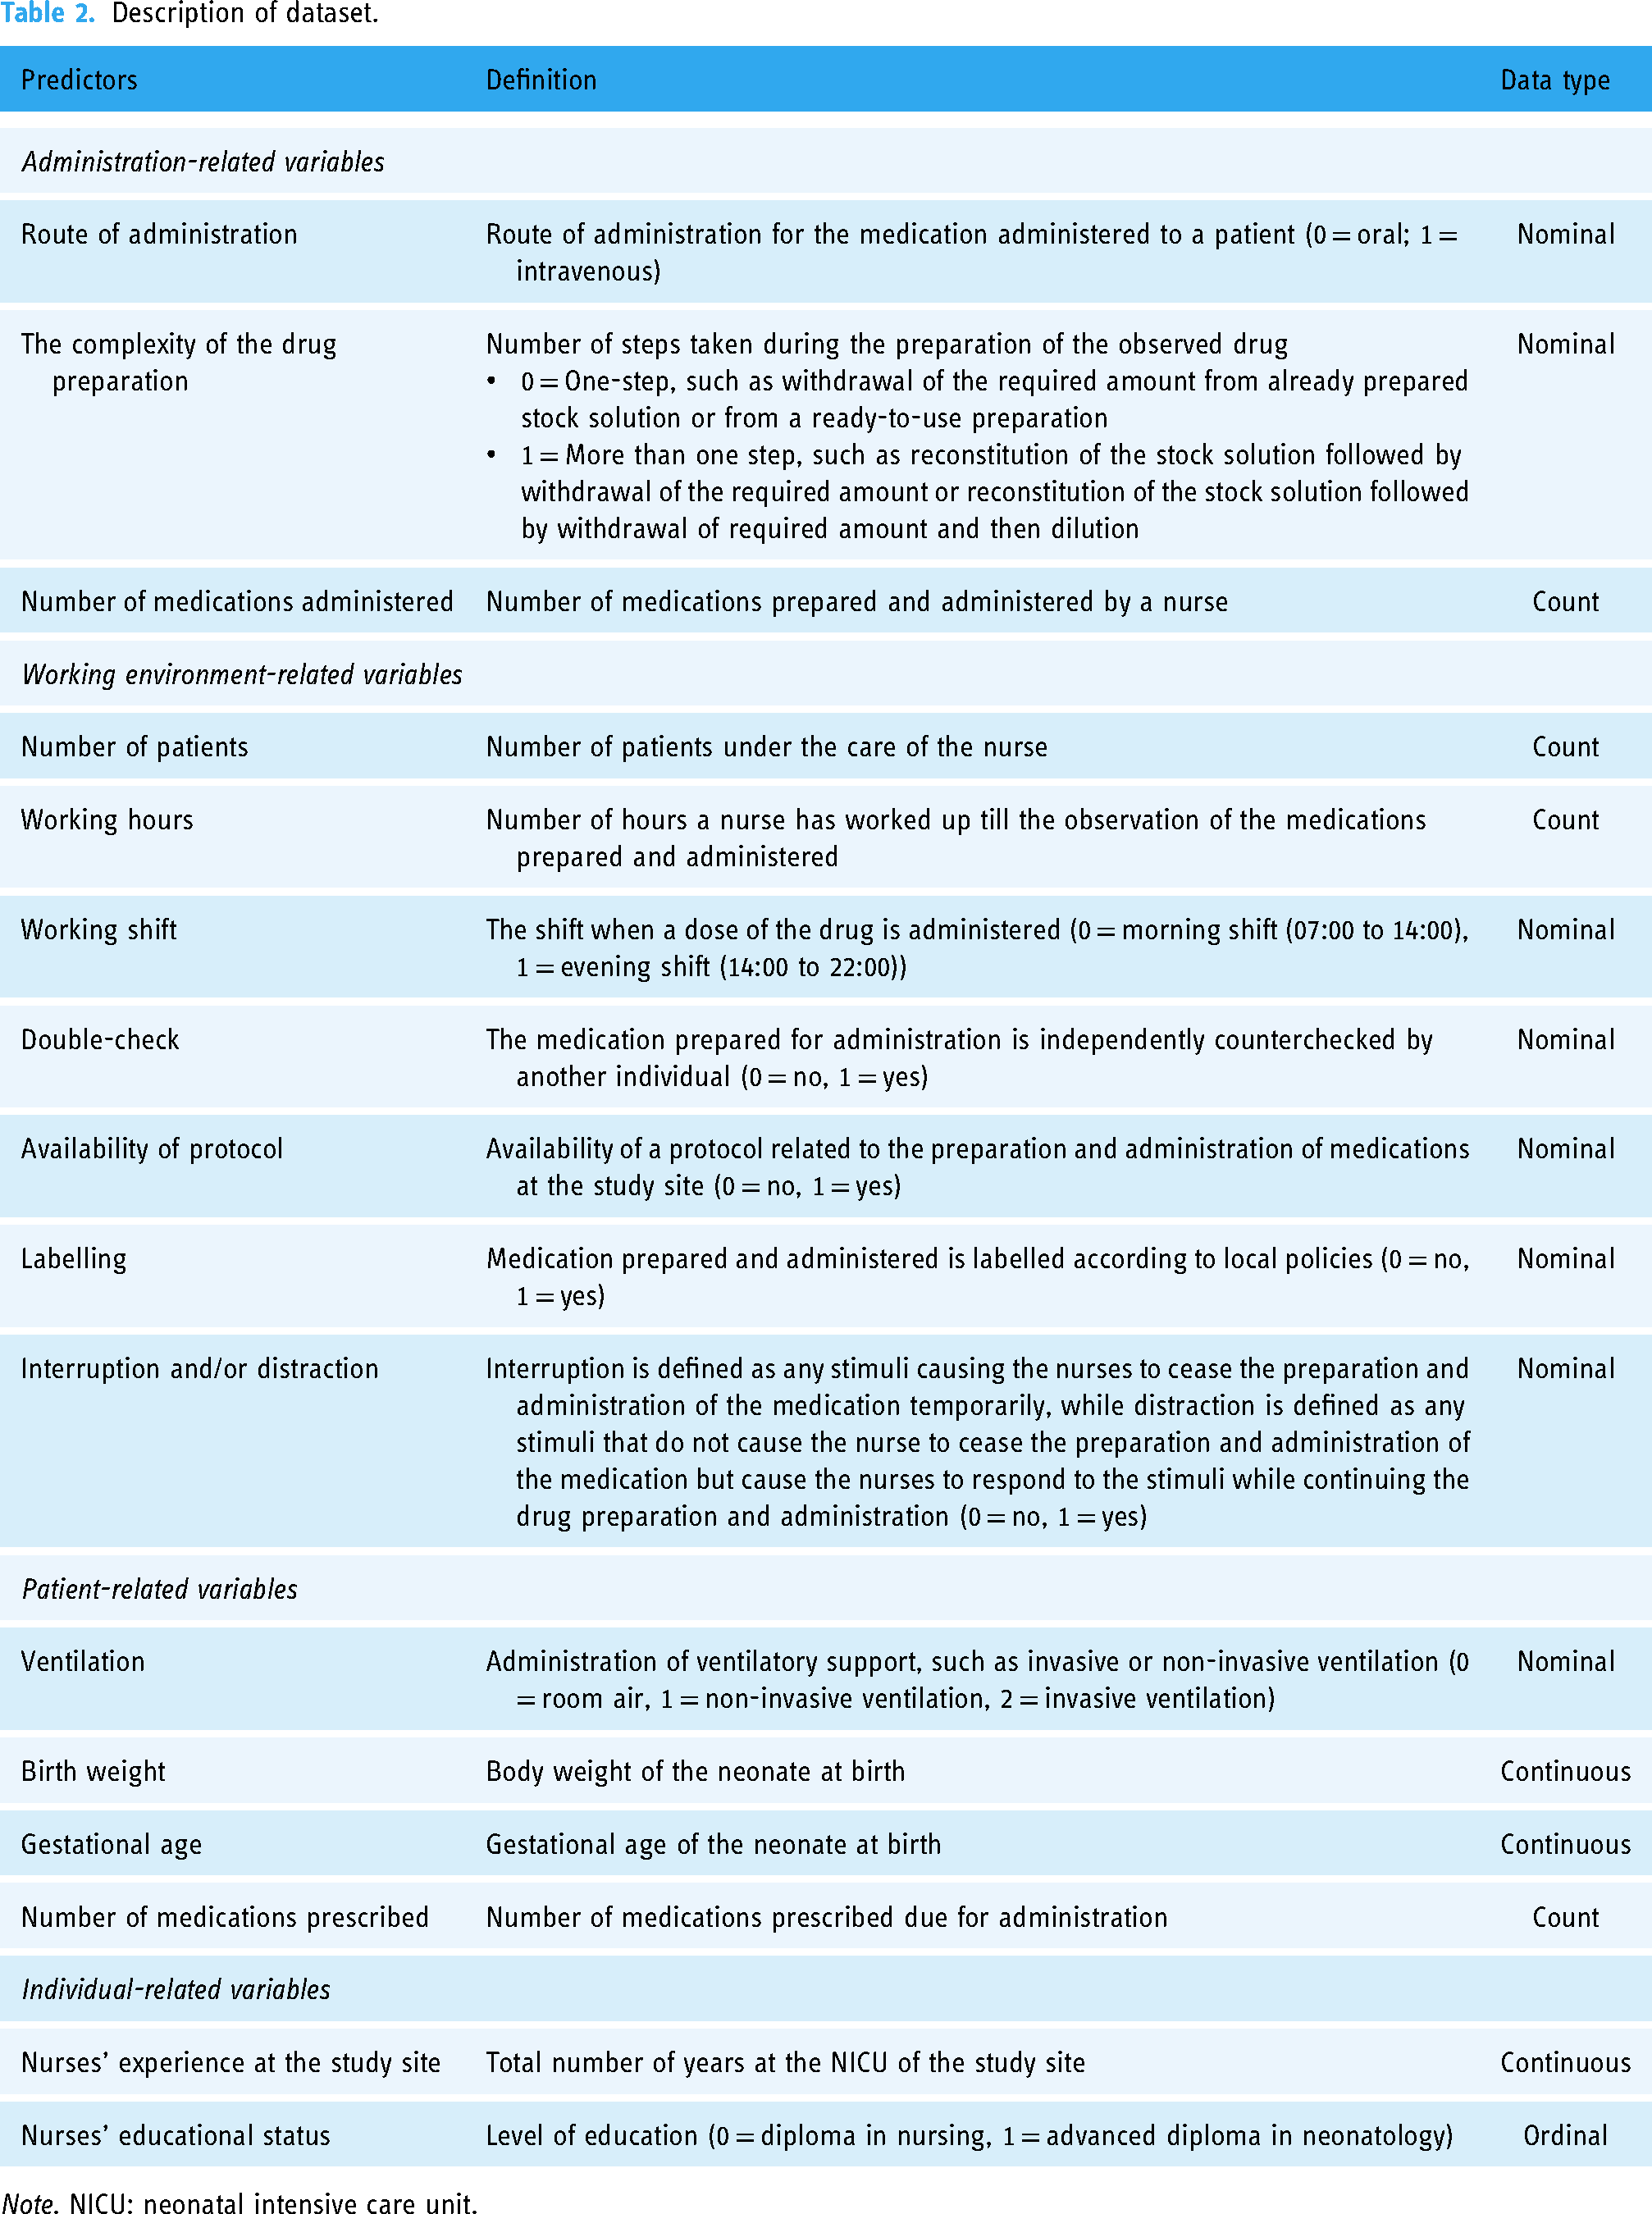
Note. NICU: neonatal intensive care unit.
Risk prediction model to predict the presence of MAEs among neonates in NICUs
The risk prediction model was designed as a binary classification task. The target label for the model corresponded to whether a MAE is present for the dose observed. The development and validation of the risk prediction model involved several steps such as data pre-processing, model development, and model evaluation as illustrated in Figure 1.

Pipeline of the proposed machine learning-based approach.
Data preprocessing
Data preprocessing is the initial step in model development. It involves preparing and cleaning the dataset to ensure the quality and efficiency of the final model. Several data preprocessing steps were applied in this study. There were no missing data in the dataset. Hence, imputation was not performed. The strength of association for each feature with the target MAE class was explored and the Spearman's correlation coefficient between gestational age and birth weight was found to be 0.82. Since both features were highly correlated, birth weight was removed to reduce redundancies.
The dataset encompasses a mix of continuous and categorical features. However, most ML algorithms are not optimised for categorical features. Hence, it is necessary to convert all categorical features into numerical values before their utilisation in ML algorithms. One effective method is One Hot Encoding, which involves the transformation of categorical variables into binary parameters. Specifically, it creates additional features – one for each category present in the original feature, assigning a binary value (0 or 1) to indicate the presence or absence of each category in a given observation. 33 This approach prevents the ML algorithms from misinterpreting the categories as having ordinal relationships.
The two-way holdout method was then employed as the validation technique where the dataset was randomly stratified into training and testing sets with a ratio of 8:2. Due to a class imbalance of MAEs and non-MAEs instances in the dataset, where there were 743 instances of MAEs and 359 instances of non-MAEs, the accurate identification of MAEs and non-MAEs instances could be compromised. To address this imbalance, the synthetic minority oversampling technique (SMOTE) was applied to the training set. The SMOTE, introduced by Chawla et al., 34 offers a novel approach to addressing imbalanced datasets. Unlike conventional oversampling methods, the SMOTE doesn’t merely duplicate existing samples in the minority class. Instead, it generates synthetic samples, effectively augmenting the minority class which is the non-MAEs instance. The instances in this class were oversampled until both classes were uniformly distributed, after which the dataset became balanced. This unique strategy helps mitigate overfitting issues and enhances the classifier’s ability to generalise well on unseen data. The training set was utilised to develop the risk prediction model while the test set was used to estimate the prediction performance of the developed model.
Model selection
Ten prediction algorithms were constructed in this study and they include both the logistic regression method and various ML classification algorithms. The selection of these algorithms was based on their widespread use in predictive modelling tasks, spanning from traditional statistical approaches like logistic regression to more advanced techniques like k-nearest neighbours, support vector machine, Gaussian Naïve Bayes, decision tree, random forest, gradient boosting, extreme gradient boosting, adaptive boosting (AdaBoost), and categorical boosting. 35 Each algorithm offers unique strengths and capabilities, allowing us to explore a diverse range of modelling techniques and assess their performance in predicting MAEs. All of the ML models were trained using the same random seed (value of 1234) to ensure reproducibility; though there could still be some slight variation in performance due to the non-deterministic nature of some ML algorithms.
Hyperparameters for each algorithm were optimised using grid search. The search range is based on the values proposed by the algorithm creators, or in accordance with standard state-of-the-art practices. Cross-validation is performed during this grid search process as the training data is used to validate the hyperparameter permutations. Hyperparameters that produced a model with the highest F1-score for each algorithm in the training set were then evaluated using the unseen (for the model) test set for comparisons between algorithms.
The ten algorithms were implemented using Python (version 3.10.12) and ran on Google Colab as the implementation platform. This cloud-based service is based on the Jupyter Notebook and provides users access to a Python environment that includes preinstalled popularly used data science libraries such as Scikit-learn. The prediction algorithms from the Scikit-learn application programming interface were used. 36 OneHotEncoder from the Scikit-learn application programming interface was used to convert nominal features to one-hot numeric arrays. The default Imbalanced-learn (imblearn) application programming interface version of the SMOTE was used to address the imbalanced dataset. 37 During the optimisation of the hyperparameters, GridSearchCV from the Scikit-learn application programming interface was used. The codes utilised in this study are available in Appendix 2 in the online supplemental materials.
Evaluation measures
After the hyperparameters were fixed and applied to the testing set, a two-by-two contingency confusion matrix table was created. This table represented both the observed (ground truth) and predicted (classified) risk classification. The performance of the models was measured by calculating sensitivity (recall), specificity, precision or positive predictive value, F1-score, accuracy, negative predictive value, and area under the receiver operating characteristic curve.
Sensitivity. This is the model's sensitivity in identifying the presence of MAEs and is computed as the ratio of true positives to the sum of true positives and false negatives. Specificity. This measures the proportion of doses without MAEs which were correctly identified as not having MAEs. It is computed as the ratio of true negatives to the sum of true negatives and false positives. Precision. Also known as positive predictive value. This is the proportion of doses with MAEs, the positive instances, which were correctly identified as having MAEs out of all the doses with MAEs. This is computed as the ratio of true positives to the sum of true positives and false positives. F1-score. This is the harmonic mean of precision and sensitivity. Accuracy. Accuracy reflects the overall ability of the model to correctly identify both the doses with MAEs (positive) and without MAEs (negative) instances. The formula for the calculation is as follows: Negative predictive value. This is a proportion of doses without MAEs (the negative instances) which were correctly identified as not having MAEs, out of all the doses without MAEs which were predicted to be negative. The formula for the calculation is as follows:
The discriminatory ability of the model was assessed using the area under the receiver operating characteristic curve. This was also used to compare the overall model performance. The area under the receiver operating characteristic curve, typically ranging between 0.5 and 1.0, reflects algorithm performance, where 0.5 signifies a performance akin to random guessing. The area under the receiver operating characteristic curve value of 1 indicates that the model can perfectly discriminate doses with MAEs and doses without while 0.5 indicates that the model is unable to discriminate these two groups of doses.


Feature importance
We employed a model-agnostic permutation feature importance measurement initially proposed by Breiman et al. 38 to evaluate the significance of features in the trained models; given the wide range of algorithms explored. Permutation importance quantifies the average decrease in accuracy of the trained model when each feature is permuted and randomly reshuffled. Permutation-based importance methods are not biased towards continuous or high-cardinality categorical variables, making them a reliable approach for assessing feature importance across different algorithms. 39
The scores for permutation feature importance were computed independently for each feature. A score of zero indicates that the feature has a negligible impact on the model's predictive ability. On the other hand, positive scores indicate that the feature positively contributes to the model's predictive ability while a negative score suggests the feature's lack of contribution to the model's predictive ability.
Statistical analysis
Categorical variables were described using frequency counts and percentages, while continuous variables were represented by means with standard deviations (SD) or medians with interquartile ranges. Group comparisons were made using the independent t-test or Mann–Whitney U-test for continuous variables and the χ2 or Fisher's exact test for categorical variables. Statistical analyses were conducted using SPSS 29.0 software, with significance set at p < .05.
An algorithm predicting the majority of instances to belong to the negative class (indicating no MAEs) in an imbalanced dataset may yield a high accuracy score but proves ineffective in predicting the desired positive class (MAEs). Conversely, a highly sensitive algorithm may predict most instances as belonging to the positive class, but it lacks the ability to distinguish between the positive and negative instances. To overcome the issue, we have chosen the F1-score as the main metric for assessing the performance of the ML algorithms instead of the area under the receiver operating characteristic curve because of its robustness to class imbalance, by assigning equal importance to both precision and sensitivity. 40
In the context of MAE prediction, the F1-score is particularly valuable because it accounts for the trade-off between precision and sensitivity. By using the F1-score as the primary metric, we ensure that the model maintains a balance between identifying true MAE cases (sensitivity) and minimising false positives (precision). This balance is critical in a healthcare setting where both missed detections and false alarms can have serious consequences. While the F1-score offers a balanced view, it is important to acknowledge the trade-offs involved in optimising for different metrics. For instance, a model with high sensitivity but lower precision might be suitable in situations where missing an MAE is unacceptable, and additional follow-up actions can be taken to confirm predictions. On the other hand, a model with high precision but lower sensitivity might be preferred in settings where false positives are costly or disruptive.
In our study, the choice of the F1-score reflects the need to maintain a balance between these competing priorities. The potential life-threatening consequences of MAEs demand a model that not only captures as many true positive cases as possible but also minimises unnecessary alarms. By focusing on the F1-score, we ensure that our model is both effective and practical for real-world application in NICUs, where both precision and sensitivity are critical for patient safety.
Ethical approval and informed consent
This study was approved by the Medical Research and Ethics Committee (MREC), Ministry of Health Malaysia (NMRR-21-1484-59494 [IIR]) and the Medical Ethics Committee, Universiti Kebangsaan Malaysia (JEP-2022-038). A written informed consent was obtained from the observed nurses prior data collection.
To ensure data privacy, all collected data were de-identified to preserve the privacy of participants. Identifiers were removed, and the data were anonymised before analysis. The de-identified data were securely stored within the institution’s cloud infrastructure. Access to this data was restricted to authorised personnel only, ensuring that the data remains confidential and secure throughout the study.
Results
Baseline characteristics
An overview of the descriptive analysis of the dataset is in Table 3 and several differences between doses with MAEs and without MAEs were found. The total observed doses administered were 1093 doses among 170 neonates, with a mean age and birth weight of 33.43 (SD ± 5.13) weeks and 1.94 (SD ± 0.95) kg, respectively. Doses with MAEs had a slightly lower mean gestational age compared to those without MAEs (33.23 vs. 33.85 weeks, p = .019). There was a statistically significant difference in the distribution of sex between the two groups (p < .001), with a predominance of male gender observed. Among these doses, 743 (68%) were associated with MAEs while 350 (32%) were administered without any errors.
Baseline characteristics of doses with and without MAEs.

Note. IQR: interquartile range; MAE: medication administration error; SD: standard deviation.
Independent t-test.
Chi-squared test.
Fisher's exact test.
Mann–Whitney U-test.
In terms of administration-related characteristics, the route of administration differed significantly between doses with and without MAEs (p < .001), with a higher proportion of intravenous administrations associated with errors (66.1%) compared to oral administrations (33.9%). Complexity of preparation (p < .001) and number of medications administered (p < .001), were also significantly different between the two groups. Additionally, nurses’ experience at the study site displayed a statistically significant difference (p < .001), with doses administered by nurses with more experience (M = 8.23 years) showing a higher likelihood of MAEs compared to those with less experience (M = 5.91 years). Educational status also revealed a statistically significant association (p < .001), with a higher proportion of MAEs observed among nurses holding a Diploma in Nursing (61.4%) compared to those with an Advanced Diploma in Neonatology (38.6%). The availability of protocols (p = .006), type of ventilation (p < .001), number of medications prescribed (p < .001), number of patients (p < .001), and working hours (p = .023) were significantly associated with error occurrence, while factors such as double-checking (p = .392), labelling (p = .682), and interruption/distraction during medication administration (p = .095) did not show statistically significant differences between the two groups.
Performance evaluation of ML algorithms
The performances of the ML algorithms are summarised in Table 4. Each algorithm's F1-score, accuracy, sensitivity, specificity, precision, negative predictive value, and the corresponding true positive, false positive, false negative, and true negative values are presented here while the receiver operating characteristic curves and its corresponding area under the receiver operating characteristic curve values are displayed in Figure 2. The hyperparameter optimisation for each of the ML algorithms can be found in Appendix 3 of the electronic Supplementary Material. The area under the receiver operating characteristic curve values for k-nearest neighbours, Gaussian Naïve Bayes, and logistic regression were the lowest with the area under the receiver operating characteristic curve values below 80%, and these models also had the lowest accuracy among the ML algorithms.

Area under the receiver operating characteristic curve for different methods.
Performance evaluation of machine learning algorithms.

Note. AdaBoost: adaptive boosting; CatBoost: categorical boosting; DT: decision tree; FN: false negative; FP: false positive; GB: gradient boosting; kNN: k-nearest neighbours; LR: logistic regression; NB: Naïve Bayes; NPV: negative predictive value; RF: random forest; SVM: support vector machine; TN: true negative; TP: true positive; XGBoost: extreme gradient boosting. The best performing measures are highlighted in bold.
Among the algorithms assessed, AdaBoost demonstrated the highest F1-score (83.28%) and accuracy (77.63%), accompanied by good area under the receiver operating characteristic curve (82.95%), precision (84.72%), sensitivity (81.88%) and negative predictive value (64.00%). Extreme gradient boosting was found to have the highest sensitivity (84.56%) with the least false negative cases. Logistic regression achieved the highest specificity (82.86%) and precision (89.19%) but the lowest sensitivity (66.44%), while k-nearest neighbours produced the lowest result for precision (80.14%). Although logistic regression displayed a precision of 89.19%, slightly higher than the boosting algorithms such as AdaBoost and extreme gradient boosting, the F1-score, reflecting both precision and recall, highlighted that logistic regression's F1-score at 76.15% was only higher than Gaussian Naïve Bayes, indicating the superiority of any other algorithm over logistic regression in predicting the presence of MAEs. Gaussian Naïve Bayes displayed the lowest F1-score (75.91%), area under the receiver operating characteristic curve (74.49%), and accuracy (69.86%), indicating its inferior performance compared to other algorithms.
Feature importance
The results of the permutation feature importance analyses are detailed in Table 5 and Appendix 4 of the electronic Supplementary Material, providing insights into the level of contribution of each feature for each algorithm. The intravenous route of administration was among the top three most important features across different algorithms except for k-nearest neighbours and Gaussian Naïve Bayes. Nurses’ working hours were also among the top three most important features across different algorithms except for logistic regression and support vector machine. As for AdaBoost, the top-performing model, nine features were above zero, indicating that these features impacted the model's predictive ability. The most influential features in AdaBoost were the intravenous route of administration, followed by working hours and experience at the study site.
Permutation feature importance of the evaluated algorithms.

Note. AdaBoost: adaptive boosting; CatBoost: categorical boosting; DT: decision tree; GB: gradient boosting; kNN: k-nearest neighbors; LR: logistic regression; NB: Naïve Bayes; RF: random forest; SVM: support vector machine; XGBoost: extreme gradient boosting. The top three most significant features for each model are in bold.
Surrogate decision tree
Understanding a black-box classification ML model such as AdaBoost may be challenging due to its complexity. Therefore, a ‘surrogate’ decision tree that simulates the behaviour of the complex model was created to provide a more interpretable representation of AdaBoost. A decision tree was chosen as the surrogate model because of its simplicity in outlining a step-by-step process of classification and its visual representation resembling a tree. 41
A simple decision tree model with a maximum depth of five for classifying doses administered into with or without MAEs is provided in Figure 3. A deeper tree could produce a more accurate proxy for the model that it is surrogating, however, it would make the tree more complex for interpretation, especially in visualising the tree. The decision tree model indicated that the route of administration is the most important feature of the dataset, consistent with that of the feature importance study. The model indicates that an intravenous route of administration is prone to MAEs when compared to the oral route of administration. Similarly, working hours, gestational age, and number of patients are all features that were associated with MAEs.
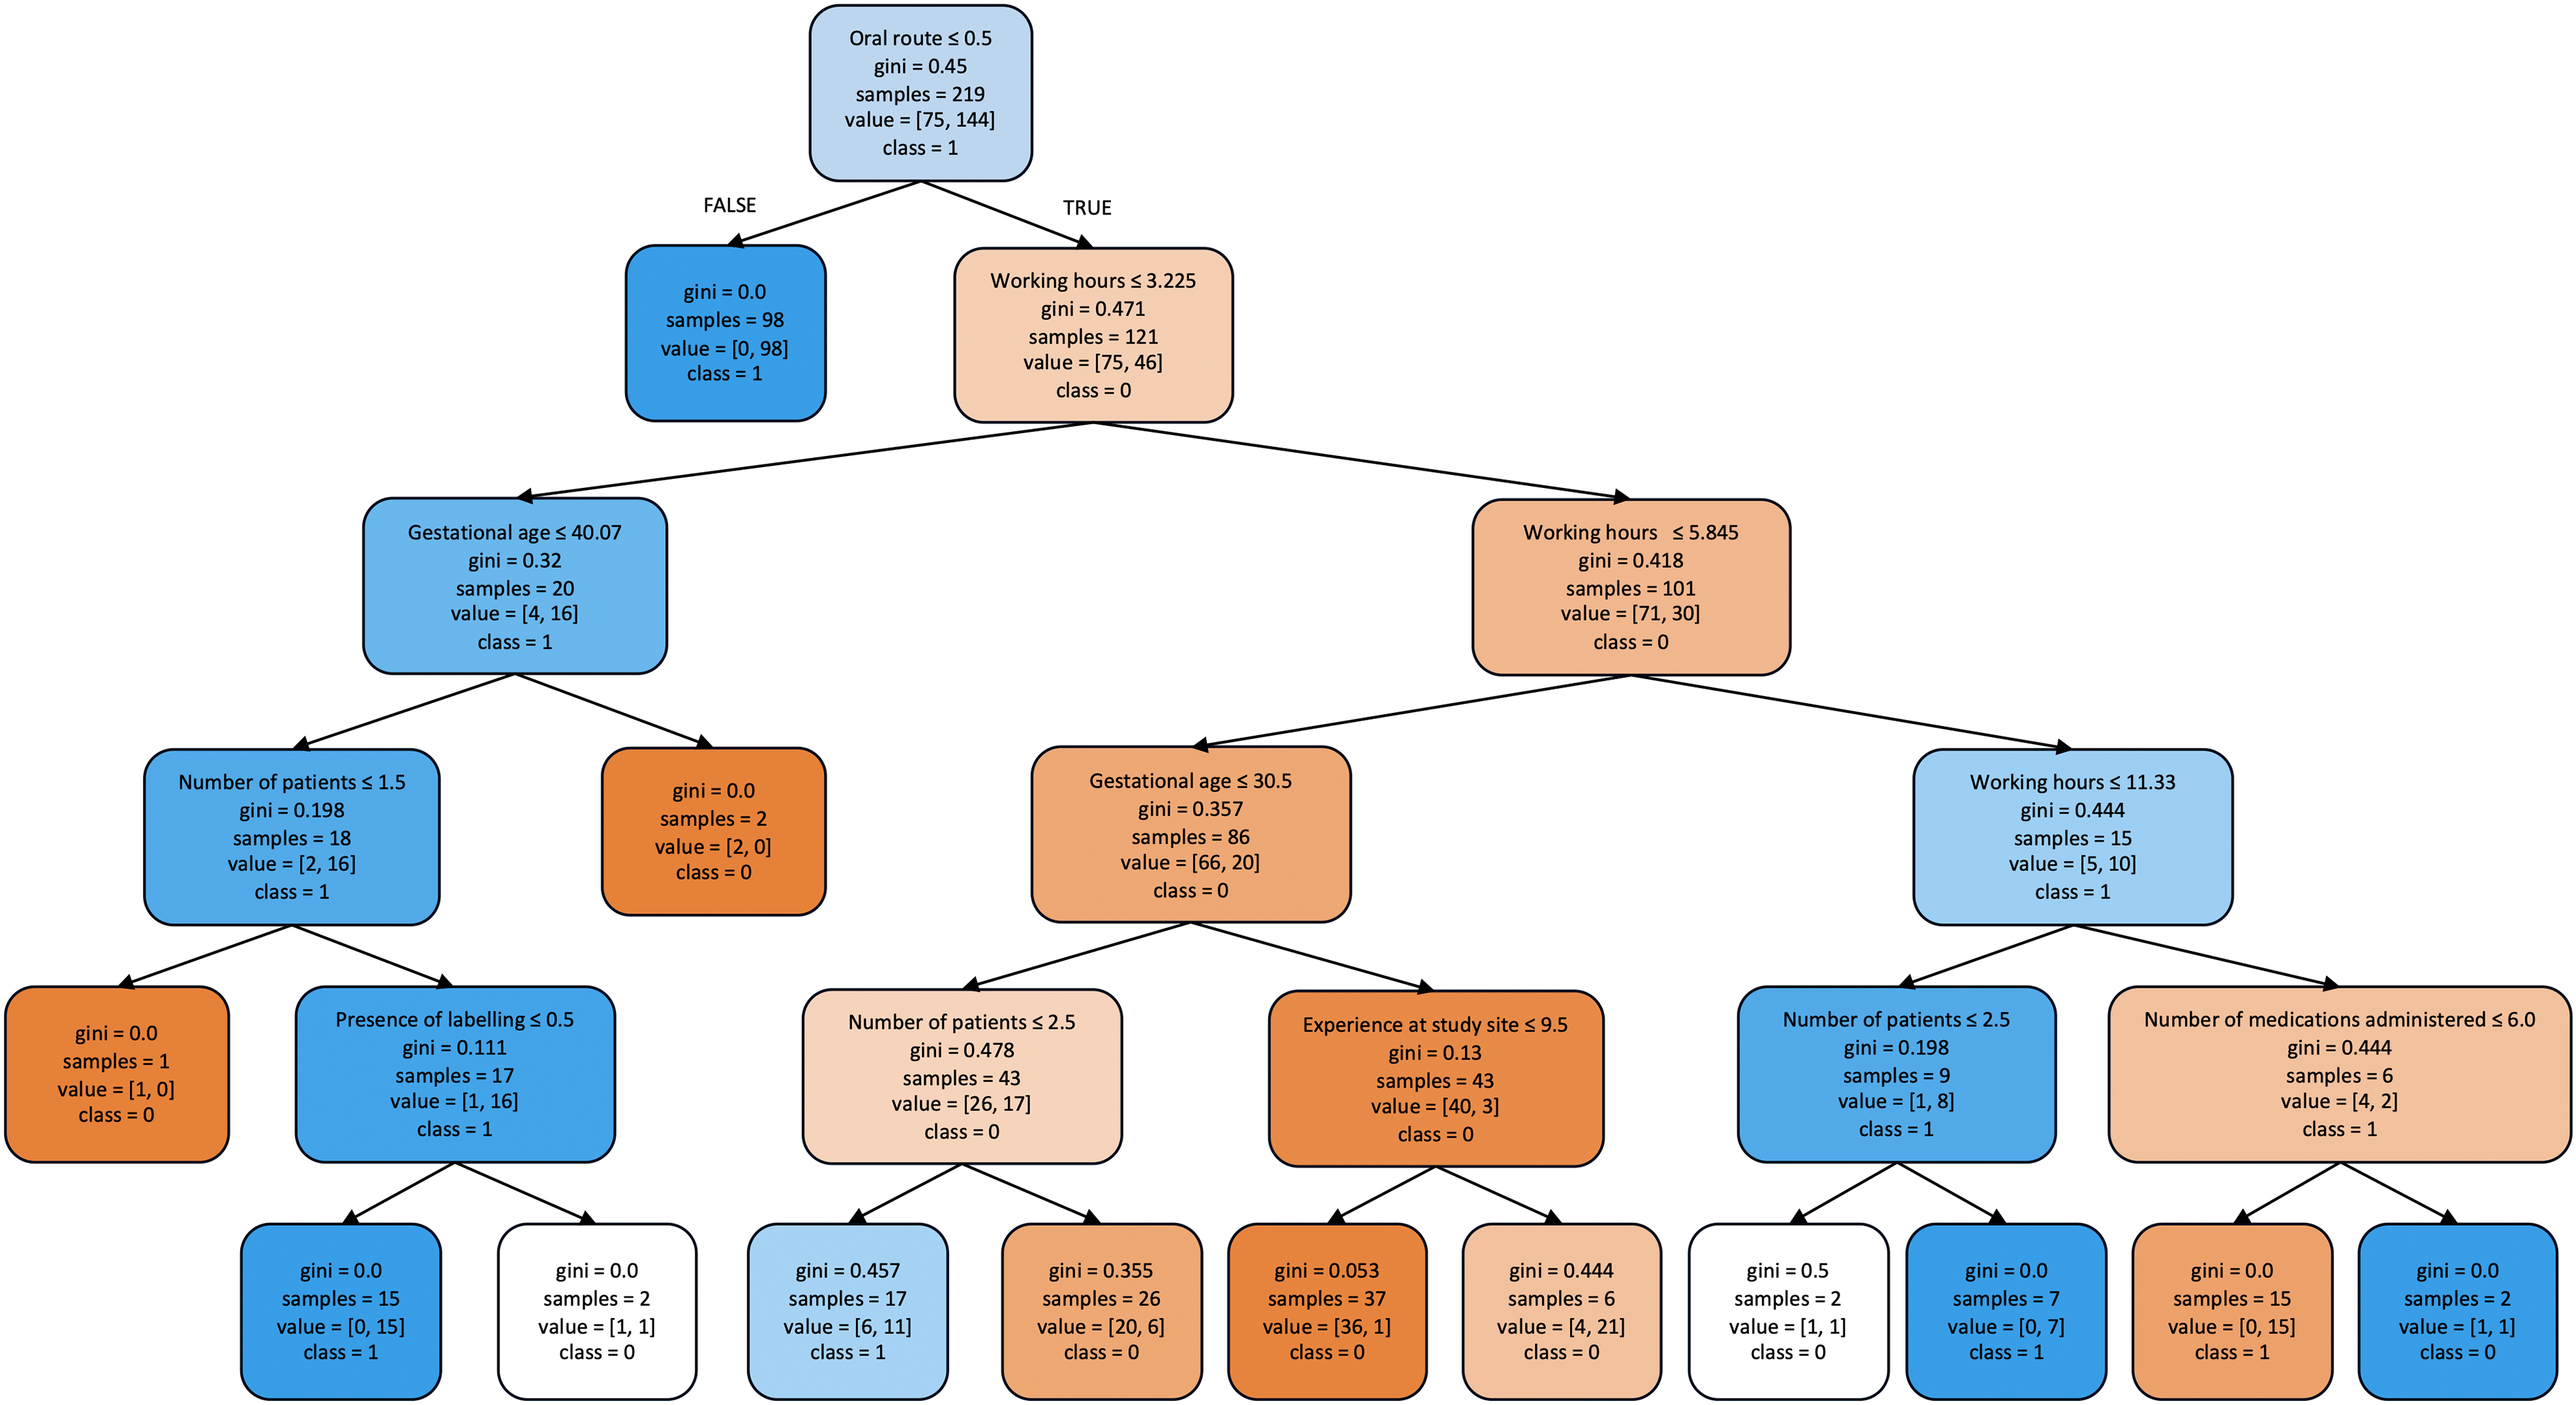
Surrogate decision tree illustrating the classification of doses with (class = 1) and without (class = 0) medication administration errors. Each box contains following components: selected feature for classification, Gini index, number of samples classified to the box according to the previous variable, the number of samples in dataset for each classification, and the majority class of samples at the split node. The colours blue and orange represent the classes with and without MAEs respectively, with the colour intensifying as the Gini indexes decreases.
Discussion
The performance of ten ML algorithms was compared and we found that the best predictive performance was achieved by AdaBoost. AdaBoost, based on 14 key parameters (route of administration, complexity of drug preparation, number of medications administered, number of patients, working hours, working shift, availability of protocol, ventilation, gestational age, number of medications prescribed, nursing experience, nurses’ educational status, labelling and interruption and/or distraction) achieved the highest F1-score of 83.28% and a discriminatory ability of 82.95%. It also had the best accuracy and good precision, sensitivity, and negative predictive value.
Comparison with existing literature
Although our study specifically focuses on predicting MAEs in NICUs, it is important to situate our findings within the broader context of existing models for predicting medication errors in NICUs. In the existing literature, two key models have been developed to predict medication errors more generally in NICUs, though not specifically on MAEs.
The first study by Yalcin et al. developed a supervised learning model to identify various types of medication errors, including prescription, preparation, administration, and monitoring errors among neonates in NICUs. 25 This model utilised supervised learning algorithms such as random forest, elastic net, artificial neural network, and support vector machine. Another study by Hogue et al. 42 applied unsupervised learning algorithms, including isolation forest models, neural network autoencoders, and GANomaly-based models, to detect atypical medication orders, which include medication errors, in NICUs. While this approach offers valuable insights into atypical patterns in medication orders, the model's performance in detecting MEs, including MAEs, was poorer compared to the supervised learning approach by Yalcin et al.’s study. However, both models were designed to identify all types of medication errors rather than focusing on MAEs alone. This can be a limitation for stakeholders who need targeted insights to implement interventions at specific stages of medication management, such as during administration.
In contrast to these studies, our study aimed to address this gap by developing and validating a model specifically for predicting MAEs among neonates. By focusing on an extensive list of potential risk factors associated with MAEs, our model provides more actionable insights for healthcare professionals. The specificity of our model allows for more precise interventions at the point of care, thus enhancing its practical utility in NICU settings.
Algorithm comparison
Although our study applied ten ML algorithms to predict the presence of MAEs, significant differences in performance were observed between AdaBoost and logistic regression method, with AdaBoost demonstrating superior performance based on the F1-score. AdaBoost performed better than logistic regression in terms of F1-score, achieving a score of 83.28% while logistic regression achieved a score of 76.15% with a difference of 7.13%. This suggests that AdaBoost achieved a better balance between precision and recall in identifying doses with MAEs and it is able to minimise both false positives and false negatives, making it a more robust model. However, it is noteworthy that logistic regression demonstrated high precision (89.19%) and specificity (82.86%), indicating its proficiency in correctly classifying non-MAE instances. This suggests that logistic regression may be more conservative in predicting MAEs, resulting in fewer false positives. Conversely, precision and sensitivity often exhibit a trade-off relationship, with high precision typically resulting in low recall. 43 This is evident as logistic regression exhibited lower sensitivity (66.44%) compared to AdaBoost, indicating a higher rate of false negatives.
The difference in performance between AdaBoost and logistic regression can be attributed to several factors. AdaBoost, as an ensemble learning technique, combines multiple weak learners to improve predictive accuracy. By iteratively focusing on instances misclassified by preceding base models, AdaBoost effectively learns from the data and enhances predictive performance. In contrast, logistic regression is a simpler model that estimates probabilities based on linear combinations of predictor variables. While logistic regression offers interpretability and ease of implementation, it may struggle to capture complex relationships and interactions among predictors, particularly in nonlinear data. 44
With AdaBoost outperforming all the other algorithms, this indicates the presence of complex and nonlinear relationships among predictors that linear classifiers or simple decision trees failed to capture. In the past, linear categorisation tasks were limited to models developed using the conventional statistical method of logistic regression. However, with the help of modern ML techniques, nonlinear relationships can now be described reliably as the computational power increases to do so. The accuracy of these techniques has been found to significantly outperform the conventional statistical approach when the underlying data exhibits nonlinear characteristics. 44
Importance of sensitivity in MAE detection
Given the potentially life-threatening consequences of MAEs among neonates in the NICU, the primary goal of predictive modelling would be to minimise false negatives, thereby ensuring that the presence of MAE goes undetected. AdaBoost’s proficiency in capturing complex patterns in the data and striking a balance between precision and recall makes it a valuable tool for enhancing patient safety in the NICU. Although, logistic regression may exhibit higher specificity and precision, resulting in fewer false positives, but this is potentially at the expense of missing true positive cases, leading to an increased likelihood of adverse events for neonates.
Therefore, in the context of predicting the presence of MAEs among neonates in the NICU, it is imperative to prioritise sensitivity over specificity. Minimising false negatives ensures that the presence of all MAEs is identified and receive timely interventions to prevent harm. While logistic regression may offer advantages in terms of interpretability, 45 AdaBoost’s superior sensitivity and ability to balance false positives and false negatives make it a more suitable choice for enhancing patient safety in the NICU.
Feature importance analysis
A major challenge in preventing MAEs among neonates in the NICU lies in determining the right parameters that forecast MAEs and help to accurately predict the presence of MAEs. This holds the potential to minimise MAEs. Through permutation feature importance analyses, we can understand the contribution of each feature to the predictive ability of the ML algorithms. Interestingly, although the parameters identified in the analyses were reduced, the overall accuracies achieved among the algorithms were not significantly different as compared to the algorithms without permutation feature importance analyses. Therefore, the identification of the presence of MAEs can be expedited. This is attributed to the identification of a set of important features through the permutation feature importance analysis while still achieving comparable prediction accuracies.
Most of the features found to be influential in the AdaBoost model were also found to be associated with MAEs among neonates in NICU in multiple logistic regression analyses of previous studies,7,46 namely the intravenous route of administration, experience at the study site, gestational age and number of medications prescribed. Although working hours, number of patients, working shift, and absence of interruption and/or distraction were not found to be significantly associated with MAEs among neonates in NICU in other studies, these features were found to be influential in AdaBoost. The use of permutation feature importance in this study prioritised features based on their predictive power rather than their significance as typically done in regression analyses. This could be attributed to the complexity and non-linearity of the features which may be uncovered in ML algorithms but not in logistic regression 44 ; especially through a multi-staged approach.
Implication to policy and practice
The implementation of the AdaBoost algorithm on MAE predictors in NICUs offers valuable insights that can directly inform hospital best practices, policies, and staff training. For example, by identifying specific variables like the intravenous route of administration as high-risk factors, hospitals can allocate resources more effectively and tailor training programs to address these risks. This targeted approach can significantly enhance medication safety.
Moreover, the AdaBoost model allows us to better profile, predict, and estimate case risks, providing healthcare professionals with a powerful tool to assist in real-time decision-making. By embedding this algorithm within electronic health records or clinical decision support systems, it can generate alerts for potential MAEs, enabling quicker responses to elevated-risk cases. This not only reduces the cognitive load on nurses by flagging high-risk situations but also facilitates timely interventions, thereby improving patient safety.
Additionally, the algorithm's capacity to analyse complex and nonlinear relationships among various factors involved in medication administration allows it to generate more detailed insights compared to traditional approaches. As the system continuously learns from new data, it can adjust to shifts in clinical practices, emerging MAE trends, and changes in patient demographics. This adaptability ensures that the predictive model remains effective over time, consistently contributing to enhanced patient safety outcomes.
Strengths and limitations
A strength of this study is that, to the best of our knowledge, this is the first study to develop a risk prediction model for the prediction of the presence of MAEs among neonates in NICUs, using ML algorithms. A key advantage of ML algorithms is that they are agnostic towards specific theories, allowing for tuning and exploration. Hence, the methods used in our study may be easily applied to similar datasets to identify factors to MAEs using the same pipeline or through transfer learning.
The present study has some limitations. Firstly, our ML model was developed and validated using the data collected from a multi-centre, single-health system in Malaysia, thus limiting generalisability. Variations in healthcare infrastructure, staffing, protocols, and cultural practices across different health systems or countries may significantly impact the model’s performance. For instance, hospitals with different resource availability or training standards for nursing staff might experience different rates and causes of MAEs. Therefore, external validation of the models in other hospitals with different environments and health systems is warranted to assess their robustness and adaptability.
Secondly, our dataset lacked information on potential variables such as personal factors (nurses’ psychological well-being, job satisfaction) and environmental factors (lighting and noisy environment), which may be risk factors for MAEs. These variables were not gathered due to the nature of the direct observational study, the gold standard in detecting MAEs. Although the direct observation study did not encompass these factors, supplementary surveys could have enriched the dataset and provided deeper insights into these aspects. The absence of these variables may have led to an incomplete understanding of the full range of factors contributing to MAEs, potentially affecting the model’s accuracy and applicability. Although the direct observation method is most efficient in detecting MAEs, it may introduce observer bias also known as the Hawthorne effect. Despite efforts taken to reduce the Hawthorne effect, we cannot eliminate it thus leading to potential underestimation of MAEs.
Recommendations for future research
Our current work has taken into account the robustness of the model by evaluating its performance across datasets obtained from three different healthcare facilities in Malaysia. This initial step demonstrates the model’s capacity to handle variations in operational contexts, staffing, and patient demographics within a specific region. However, to further ensure the model's adaptability and generalisability, future research should extend this evaluation to include datasets from different health systems. To externally validate the model effectively in other settings, a collaboration with various healthcare institutions would be beneficial to gather diverse datasets reflecting different operational contexts, staffing and patient demographics. Such collaborations would provide an opportunity to test the model's adaptability and robustness in predicting the presence of MAEs among neonates in NICUs across different environments. The ML methods we have developed is reproducible and can be adapted for use in other healthcare systems and countries.
In addition to external validation, future studies should include other potential variables such as nurses’ psychological well-being, environmental factors like lighting and noise levels, and specific workflow characteristics, to develop a more comprehensive and robust model capable of performing well globally in predicting the presence of MAEs among neonates in NICUs. Further, comparative analysis of these models across different health systems will enable researchers to better understand how different environments influence the occurrence of MAEs. Additionally, future research could include external validation of the developed model by testing the model on independent datasets from different hospitals and countries to assess its generalisability. This process should also include sensitivity analyses to determine how changes in input variables affect the model's predictions, ensuring that it remains robust across different scenarios. Furthermore, exploration with newer state-of-the-art models such as neural networks, deep learning models, or a hybrid of combining different algorithms could enhance prediction accuracy, albeit at potentially higher computational and data requirements. By expanding our ML-aided approach to other practices, we can further demonstrate the potential of these technologies in advancing healthcare outcomes.
Conclusion
In conclusion, this study developed and validated a ML-based risk prediction model to predict the presence of MAEs among neonates in NICUs. A rigorous methodology, including a direct observational study, dataset analysis, and the application of advanced ML techniques was employed to overcome the complexity of factors contributing to MAEs and the limitations of traditional statistical methods in capturing nonlinear relationships within the data. Key findings from our study include the identification of AdaBoost as the most effective ML algorithm for predicting MAEs, outperforming other algorithms. Additionally, permutation feature importance analysis revealed insights into the significant predictors of MAEs, such as the intravenous route of administration, nursing experience, gestational age, number of patients, evening shift, morning shift, and absence of interruptions and/or distraction. While the model aids in predicting the presence of MAEs among neonates in NICUs, it is important to acknowledge that its implementation alone may not directly reduce MAEs. However, through appropriate and timely interventions guided by the model's predictions, healthcare providers can potentially mitigate the occurrence of MAEs. We believe that integrating this risk prediction model into clinical practice has the potential to enhance patient safety by facilitating proactive interventions, thereby improving neonatal health outcomes in NICUs.
Supplemental Material
sj-docx-1-dhj-10.1177_20552076241286434 - Supplemental material for Machine learning-based risk prediction model for medication administration errors in neonatal intensive care units: A prospective direct observational study
Supplemental material, sj-docx-1-dhj-10.1177_20552076241286434 for Machine learning-based risk prediction model for medication administration errors in neonatal intensive care units: A prospective direct observational study by Josephine Henry Basil, Wern Han Lim, Sharifah M. Syed Ahmad, Chandini Menon Premakumar, Nurul Ain Mohd Tahir, Adliah Mhd Ali, Zamtira Seman, Shareena Ishak and Noraida Mohamed Shah in DIGITAL HEALTH
Supplemental Material
sj-docx-2-dhj-10.1177_20552076241286434 - Supplemental material for Machine learning-based risk prediction model for medication administration errors in neonatal intensive care units: A prospective direct observational study
Supplemental material, sj-docx-2-dhj-10.1177_20552076241286434 for Machine learning-based risk prediction model for medication administration errors in neonatal intensive care units: A prospective direct observational study by Josephine Henry Basil, Wern Han Lim, Sharifah M. Syed Ahmad, Chandini Menon Premakumar, Nurul Ain Mohd Tahir, Adliah Mhd Ali, Zamtira Seman, Shareena Ishak and Noraida Mohamed Shah in DIGITAL HEALTH
Footnotes
Acknowledgments
The authors would like to thank the Director-General of Health Malaysia for his permission to publish this article.
Contributorship
JHB contributed to conceptualization, methodology, software, investigation, formal analysis, data curation, writing–original draft, visualization and project administration. Wern Han Lim contributed to conceptualization, methodology, software, validation, formal analysis, data curation, writing–review and editing and visualization. Sharifah M. Syed Ahmad contributed to conceptualization, methodology, software and writing–review and editing. Chandini Menon Premakumar contributed to conceptualization, methodology and writing–review and editing. Nurul Ain Mohd Tahir contributed to conceptualization, methodology and writing–review and editing. Adliah Mhd Ali contributed to conceptualization, methodology and writing–review and editing. Zamtira Seman contributed to formal analysis, writing–review and editing and visualization. Shareena Ishak contributed to conceptualization and writing–review and editing. Noraida Mohamed Shah contributed to conceptualization, methodology, writing–review and editing and funding acquisition.
Declaration of conflicting interests
The authors declared no potential conflicts of interest with respect to the research, authorship, and/or publication of this article.
Ethical approval
This study was approved by the Medical Research and Ethics Committee (MREC), Ministry of Health Malaysia (NMRR-21-1484-59494 [IIR]) and the Medical Ethics Committee, Universiti Kebangsaan Malaysia (JEP-2022-038). A written informed consent was obtained from the observed nurses prior data collection.
Funding
This work was supported by the Fundamental Research Grants Scheme by the Ministry of Higher Education (MOHE), Malaysia [FRGS/1/2022/SKK16/UK/02/7]. Sources of funding and funders had no impact on the design, conduct, or results of the study.
Guarantor
LWH and NMS should be considered guarantor of this work.
Supplemental material
Supplemental material for this article is available online.
References
Supplementary Material
Please find the following supplemental material available below.
For Open Access articles published under a Creative Commons License, all supplemental material carries the same license as the article it is associated with.
For non-Open Access articles published, all supplemental material carries a non-exclusive license, and permission requests for re-use of supplemental material or any part of supplemental material shall be sent directly to the copyright owner as specified in the copyright notice associated with the article.