
Abstract
Objective
This study sought to determine the use and perceived value of a user-centered electronic medical record (EMR) enhancement for stroke care and understand if its value was in alignment with its intended design. The EMR enhancement was introduced into Queensland public hospitals in Australia and included a summary page for enhanced interprofessional collaboration and data collection forms for efficient data extraction.
Methods
A mixed methods design was adopted and data collected from four hospital sites. We conducted 15 semistructured interviews with multidisciplinary end-users across participating sites and analyzed this data using inductive thematic techniques. Usage log data was extracted from the EMR to determine its use.
Results
Relative use of the summary page showed moderate use, varying from 66 ± 22.5 uses for each stroke patient admission per month (Site 1) to 26.7 ± 9.1 (Site 2). Interviews identified key themes of “visibility” and providing a “quick snapshot” of patient data as the main positive attributes. Technology “functionality” was perceived negatively. Use of the data collection forms was minimal, with inconsistency across sites: (Site 3, 0% to Site 2, 47%). Negative themes of “inefficiency,” poor “functionality” and the “trust” required in data entry practices were found.
Conclusions
Despite its user-centered design, clinicians did not always use the enhancement in line with its intended design, or grasp its intended value. Our findings highlight the challenges of user-centered design to accurately reflect clinical workflows within different contexts. A greater understanding is required of how to optimize user-centered EMR design for specific hospital contexts.
Keywords
Introduction
Widespread implementation of electronic medical records (EMRs) has transformed healthcare organizations worldwide. 1 These digital systems have revolutionized the way medical data is stored, accessed, and shared among healthcare providers. 2 However, healthcare organizations striving to realize the full benefits of EMRs encounter ongoing challenges in achieving adoption and optimizing their usage.3–8 It is worth noting that healthcare is a dynamic and multifaceted environment, which contributes to the complexity of EMR use and adoption.9–11
One common issue encountered with EMRs is the design and functionality of the system itself. In many cases, the focus of these systems’ development has been primarily on technological features and administrative requirements, rather than the specific needs and workflows of clinicians.12–14 As a result, certain features or functionalities within the EMR may not align seamlessly with the complex nature of clinical workflows.15,16 This misalignment can create inefficiencies, frustrations, and serve as a barrier to optimal use.3,17
Prior research has established the pivotal role of user acceptance in driving adoption of EMRs, with system features, individual characteristics and organizational support emerging as influential determinants of EMR utilization.18–22 To achieve greater user acceptance, customizable features are being incorporated into EMRs and healthcare organizations are increasingly leveraging the insights, experiences, and expertise of clinicians to design and/or redesign EMR systems.19,23,24 By actively involving those who utilize the system on a regular basis in its development, EMRs can become more tailored to specific clinical workflows, in turn increasing user acceptance and satisfaction.20,25–27 An illustration of this approach is demonstrated by Chokshi et al. 28 where user-centered design strategies were employed with target end-users to develop a feasible and usable clinical decision support module for promoting guideline-based treatment of older adults with diabetes. The user-centered design increased ownership, awareness and support of the intervention resulting in high engagement amongst clinicians. However, there are still barriers to applying user-centered design in healthcare settings. In their overview of the challenges involved in incorporating user-centered design for improved patient safety, Carayon et al. 29 identified five key barriers including cultural differences between Information Technology (IT) and health professionals, resource and expertise limitations, organizational capacity for innovation, siloed care processes and policy issues to incentivize healthcare improvement processes. Overcoming these challenges is important for the implementation and adoption of EMR optimizations and prioritizing user-centered design remains essential to the EMR user experience. 30
Beyond EMR design and user acceptance, a key factor in user adoption is the recognition of the system's value.31,32 A recent survey of physicians across the United States showed that a physician's attitude has the strongest effect on their intention to adopt a technology innovation in healthcare. 31 In essence, users must perceive value in a system in order to embrace and incorporate it into their practice. 33 Users’ involvement in the design and governance of the system enhances the likelihood of them recognizing its value. 34 This collaborative approach holds promise for creating EMR systems that are better aligned with clinical workflows, however, it remains essential to ascertain whether user involvement alone is sufficient. 26
User-centered design approaches have been employed within healthcare settings to better understand user needs and contexts, enabling technology design that is user-friendly, safe and integrates seamlessly into clinical workflows.35–38 User-centered design can be defined as a process by which end-users are actively involved in the design and development of a solution to address user needs 39 to “influence how a design takes shape.” 40 This design approach requires the involvement of experts who engage users to develop product solutions through an iterative process. Within user-centered design, the extent to which users are involved can vary from consultative involvement, representative participation or consensus participation which involves users throughout the entire process. 41
In this study, we examined the implementation of an EMR optimization developed with a user-centered design approach, led by clinicians and engaging clinicians at every stage of the process. The EMR optimization was developed for stroke clinical care with modifications to the system specific to this context. The modifications sought to address two primary clinician concerns: reduction in clinician time burden for manual data extraction for reporting to a national clinical registry, and reported problems with inefficient documentation and information overload in the EMR. These inefficiencies within the system led to the development of an EMR optimization: the stroke EMR enhancement. This study seeks to explore the perceived benefits of a tailored enhancement to the EMR on clinical workflows, information accessibility, and data collection and extraction. The objective was to determine the use and user perceptions regarding value of the stroke EMR enhancement, investigating whether its intended value was evident to users and if they utilized it in alignment with the envisioned design—all in the context of a user-centered design approach.
Methods
Study design, participants, and setting
A mixed methods observational study was conducted including quantitative EMR enhancement usage logs and qualitative interview data to evaluate the use and perceived value of the stroke EMR enhancement. Four acute stroke wards in Queensland, Australia were invited to participate as a representative sample of 16 eligible hospitals. These wards were chosen based on their use of the single-instance Cerner EMR, ability for research engagement and geographical location, e.g., encompassing both metropolitan and regional hospital sites. The four study hospital sites treat from 161 to 705 acute stroke patients per year, 40% of the state's annual stroke admissions. All acute stroke wards involved in the study comprised of a dedicated multidisciplinary team involving an acute stroke medical team, a clinical nurse consultant (CNC), nursing staff, and allied health staff including physiotherapy, occupational therapy, speech pathology, nutrition and dietetics, and social work at varying levels of full-time equivalence. Study participants consisted of clinical staff across the medical, nursing and allied health professions involved in caring for stroke patients. Staff from digital health professions that were aware of the stroke EMR enhancement were also invited to participate. Ethical approval was obtained from the Metro South Ethics Committee (HREC/2021/QMS/71834) with a consent waiver approved for the utilization of deidentified usage log data extracted from the EMR.
Intervention
The EMR in use within the hospital sites was a Cerner integrated system; all hospitals had access to the same system with efficient data sharing capability. This integrated system meant that any changes to the system are universally applied across all hospital sites that use the EMR. The stroke EMR enhancement was first conceptualized in 2017 and extensive consultation occurred with key stakeholders including IT, clinical, and business analysts. The enhancement was clinician initiated, with significant clinician input into project planning, solution design, solution development, testing and feedback from medical, nursing and allied health stroke clinicians, within the limits of the EMR system functionality. The Queensland stroke clinical network provided governance and oversight for the project.
Although the evaluation of the design of the stroke EMR enhancement is not the main focus of this study, we offer a description of the user-centered design process for background and context. Within this study, the user-centered design approach consisted of multidisciplinary workshops including medical, nursing, allied health, IT and informatics professionals to ascertain the current problems and user needs. This involved five multidisciplinary workshops (7–12 key stakeholders in each workshop) carried out over four months. A further 24 interviews were conducted with 23 individuals; some participants were consulted on multiple occasions across the four month needs analysis period. The statewide stroke network, including key stakeholders, were involved in ongoing ad-hoc (approximately every 4–12 weeks) meetings to continue to develop the design of the stroke EMR enhancement according to the business requirement specifications. A significant amount of time was spent mapping clinical needs to data requirements in line with capability of the system. The development of the solution involved iterative redesign based on clinician feedback, where IT and informatics specialists would present “prototype” ideas within a controlled testing environment to clinicians and stakeholders via online meetings. Project stages were developed across three phases: clinical application which involved clinician engagement and translation of requirements to the design and the technical development of the front-end solution, foundations which involved the coordination of metadata documentation, data model design—including data integration, data governance and data view build which enables the presentation and use of data and translation of the solution into clinical workflows. 42
After numerous design and performance testing phases and some delays in the project due to funding restraints and prioritization of workloads following the COVID-19 pandemic, the stroke EMR enhancement was released in July 2022.
Description of the stroke EMR enhancement
The stroke EMR enhancement involved two separate features for distinct purposes (Appendix 1):
Stroke summary page: A single landing page (Cerner EMR “mPage”) offering a consolidated view of a patient's key clinical information, to enhance information visibility and interprofessional collaboration. Data collection forms: The second change to the system was the creation of four documentation template data collection forms (Cerner EMR “powerforms”). The purpose of these was to standardize data collection and enable efficient data extraction from the EMR for upload to a national stroke clinical registry. The four data collection forms ((1) Stroke Initial Assessment; (2) Stroke Diagnosis & Interventions; (3) Stroke Swallow and Mobilization Assessment; (4) Stroke Discharge Care) enabled clinician recording of data required for the national registry within the EMR environment. Data from these forms could be extracted into a comprehensive spreadsheet for more efficient data upload to the registry.
Prior to data collection on the use of the stroke EMR enhancement, participants from three hospitals (other than Study site 1, pilot hospital) underwent education and training on its features. The education and training involved one session of face-to-face group training and an online education package as part of an evidence-based education and implementation program.
43
Education and training were provided by the primary researcher (SR) with assistance from project investigators at Study sites 2, 3, and 4. Training across these study sites was completed within a one-month time period, and a two-month implementation period was provided for each hospital site to embed the changes. Qualitative data were collected following the implementation period whilst quantitative data were retrospectively collected from the time of availability of the stroke EMR enhancement.
Qualitative data collection and analysis
Convenience and purposive sampling techniques, supplemented by a snowballing technique via email, were employed to invite participants to partake in interviews to gather data on participants’ experiences and perspectives regarding the use and value of the EMR enhancement. Qualitative data collection included semistructured interviews with clinical staff (medical, nursing, allied health) working in the acute stroke ward across each participating hospital site and digital health adoption coaches. Participants from different roles and disciplines were included from each site to support credibility of the data. All individuals that were approached, either face-to-face (n = 3) or through email (n = 9), agreed to participate. Three participants were recruited through the snowballing email method. A participant information and consent form was provided to eligible participants and written informed consent was obtained from each participant (n = 15). An interview guide was used to maintain consistency and enhance dependability of the research findings (Appendix 2). 44
Interviews lasted on average 30 min (15–45 min). Data saturation was evident after 15 interviews when no new codes or topics were identified. 45 Interviews were audio recorded and transcribed verbatim using Rev Transcription. Field notes were taken by the primary researcher during the interview process. Interview transcripts were deidentified, managed, and analyzed by the primary researcher within NVivo (version 12). 46 Deidentified qualitative data was shared with two other members of the research team for coding and thematic analysis. 47 A general inductive approach 48 was used to identify themes. Each researcher constructed initial codes from the transcripts independently to ensure objectivity. 44 Two members of the research team initially met to discuss and compare codes and further refine existing codes. In the next stage, three research team members met three times to draw comparisons across codes and discuss patterns within the data to facilitate rigor. Final themes were constructed by the primary researcher and ordered according to frequency of codes. These were shared with the research team, after which further refinements were discussed.
Reflexivity
The semistructured interviews were conducted by the primary researcher (SR) who is a stroke clinician and researcher. The research team involved academic professors (SB and ABJ) and stroke researchers and clinicians (RG and IR) who supported the interview guides and qualitative methods. Within this study we recognize that prior beliefs and experiences of the researchers can shape the qualitative analysis and acknowledge that the primary researcher (SR) works clinically within the implementation context and had a partial role in leading the project for the implementation and education of the stroke EMR enhancement. Bias was minimized by involving three researchers (SR, IR, and SB) in the analysis of the qualitative data with IR and SB having prior extensive knowledge and experience in qualitative research. These three researchers were female with degrees in allied health professions. Three of the researchers (ABJ, SB, and IR) worked outside of the organization and were not involved in the design or implementation of the stroke EMR enhancement.
Quantitative data collection and analysis
The quantitative outcomes of interest were the use of the summary page and use of the data collection forms. For the summary page, we used deidentified data from the EMR via the Cerner Lights On program. We captured number of users, hospital site and profession of users. Usage by nonclinical staff such as administration was removed as this did not align with our study objectives. No patient-level data was obtained.
As the data extraction tool could not identify individual episodes of page access, and delivered multiple counts per user page access, relative rather than absolute usage was reported. We also adjusted for different patient numbers as stroke patient admissions differed substantially per site. Annual stroke admission data from each hospital site for 2022 was used for this average monthly stroke patient admission calculation. A relative usage index was calculated by dividing total reported individual user page interaction counts by average number of stroke admissions in each site across the designated study periods.
A one-way analysis of variance (ANOVA) was used to determine differences in relative use between study sites, presented as mean ± standard error. A Tukey post-hoc analysis revealed where these differences occurred in the data. Statistical analysis was performed using Stata Version 17. 49
Secondly, data collection form usage across sites was determined by extracting the number of completed forms signed off at each hospital site from September 2022 until May 2023 (Table 1). As there were four data collection forms to be completed per stroke patient admission, we multiplied the average number of stroke admissions per hospital site by the expected completion of four forms per patient to result in a relative percentage of use per site.
Education and data collection periods for study sites.

Quantitative and qualitative data were collected independently. Quantitative data were extracted after the interviews were finalized to minimize bias during the interview process. When all data were collected, the study team triangulated findings between the quantitative and qualitative data to explain the study results and enhance credibility and confirmability of results.44,50
Results
Participant characteristics
Fifteen staff members across four hospital sites participated in semistructured interviews with the primary researcher from January to March 2023 (Table 2). Interviews were conducted online via zoom (n = 8), face-to-face (n = 6) and one participant elected to provide a written response to the interview questions.
Interview participants.

Qualitative results: Use and value of the summary page
Interview data revealed mixed viewpoints of the summary page with four main themes influencing its use and value: functionality, quick snapshot, visibility, and potential (Table 3).
Themes for use of the summary page.

Participant sentiment toward theme: (+) positive, (−) negative, (±) mixed, no sentiment/neutral (∼).
Functionality
Participants described the restrictions within the EMR not aligning with their clinical practice and some expressed concern that the summary page limited data input, which could result in an inaccurate reflection of the patient. This was evident mostly from an allied health perspective, where information such as how to mobilize a patient could only be documented partially. This limited system functionality led to staff perceiving the data as unreliable, resulting in a negative perception of the summary page. Concerns were also raised about “perceived risk” to patient safety if the data is open to interpretation by other team members.
It doesn't allow us to actually expand on how much assistance the person needs (or) what equipment they need. So, you know, someone who's two-assist could be a two assist to stand up and step around. But they could also be a two-assist using a hoist. And they are very different. (P03)
The integration of the summary page into clinical workflows was perceived differently by participants at different hospital sites. The existing patient summary page in the EMR was encouraged by one hospital for clinical handover, so the transition to the summary page was a minor change. For participants at other hospital sites, the existing summary page was not part of their usual workflow therefore using the summary page required effort to change their practice. Staff preferred to use existing workflows and processes with one staff member expressing “I guess I'm satisfied with getting it (patient information) where I am getting it from” (P09).
Three staff members reported the ease of use of the summary page describing it as “simple to navigate” and a “manageable” task to complete. The summary page relied on clinical staff to enter data to populate the summary page with staff describing this process as “really easy” and “takes 10 seconds.” Despite this, some staff still felt it was challenging to change their existing workflows. When you get distracted and when you are under stress, and you need to, like, find information quickly, you will go to your old ways. Instead of just thinking, ‘Okay, hang on, there was this new way they've just shown to me.’ But if you're not very fluent with that you will just go back to your old ways. (P12)
Quick snapshot
The summary page was seen as providing a quick snapshot for staff, especially helpful to the nursing profession as a tool for handovers that were “clear and concise.” When using the summary page, nursing staff reported they found it easier to remember and communicate shift details and patient updates during handovers, ensuring no information was overlooked.
Participants appreciated the consolidation of information that was easily accessible, eliminating the need to navigate through multiple EMR tabs in search of relevant data. They found value in this feature for various reasons, including its usefulness in multidisciplinary meetings, facilitating transitions from acute wards to rehabilitation, and supporting data collection. For any clinician just to be able to have a look at that one page and kind of just see where the patient's at in terms of, you know, all domains of the stroke workup and those sort of things. (P05)
However, individual differences were seen in the type of information determined as most helpful on the summary page, with few staff reporting that the summary page did not display information that was clinically necessary. For example, some staff were happy with the trending data displayed while others felt this wasn’t sufficient. If it had more appropriate information … etiologies, risk factors … all of those sorts of things would be useful from a communication point of view from a team approach. (P02)
The summary page was recognized as improving care coordination by providing a rapid overview of essential information. Participants emphasized its usefulness for patient and staff monitoring purposes. One participant stated that upon receiving a referral, they immediately accessed the summary page to review the patient's current observations, medical stability, and functional status. This enabled the participant to make informed decisions about staffing levels and requirements. Enhanced coordination was also facilitated by improving monitoring of tasks and actions. And that (visibility) sort of helps to coordinate the patient's care to make sure that, you know, things are getting done in a timely manner. (P01)
Visibility
Overall, the visibility and transparency of information on the summary page was seen as positive and helpful, enhancing efficiency for stroke clinical care. Nursing staff found that they used the summary page in the morning to review patient clinical details saving time in reading notes for individual patients. So that page is actually very good. It actually saves me time. I don't have to go through every single documentation. If I wanted to find out about the current function of the patient, what investigations happened, what were the results, and if the patient received the My Stroke Journey booklet or any other questions, they have got everything presented all in a snapshot in one page, which is easily accessible. (P13)
The features of the summary page, particularly the stroke education band, allowed team members to easily communicate that stroke education had been provided to the patient; previously a manual process requiring extensive clicking into a patient chart. This asynchronous communication was viewed as being an “effective” communication tool, contributing to more “seamless care” for patients.
I'll just say the (summary page) is awesome. It's got huge potential. The stroke education interactive view band is great …. At least with this you can easily communicate to everybody else that it's (education) been done. (P06)
Staff reported that the summary page allowed up-to-date information to be easily visible and ensured consistency and accuracy of patient information. One participant described how often small changes, such as a patient's mobility status, are easily missed or not communicated during handovers. They emphasized the importance of the summary page data as the most current source of information, allowing team members to stay updated on changes in a patient's condition.
Just having that information right there in front of our faces as opposed to having to (sift) through (the documentation). It just kind of comes back again to knowing the most up-to-date information with the patient. Because sometimes it can change and you don't know it's changed. (P05)
Potential
Participants recognized the summary page as having the potential to be clinically useful and to improve patient care. However, they also acknowledged that its perceived inadequate functionality had an impact on its use and value. Participants expressed a desire for additional features, such as the ability to include free text or a different presentation format, to further enhance its usefulness.
I think if we can get the (summary page) used by everybody, they'll see the value … I honestly think it has so much potential. (P06)
The utilization of the summary page appeared inconsistent among participants. However, there was acknowledgment that if the summary page was consistently adopted and utilized across various professions, its full potential could be realized.
I think once we do develop consistency across all areas, it definitely will be (useful) …. I think it could be a really handy tool to have once we all start using it consistently. (P05)
Qualitative results: Use and value of data collection forms
The impetus for creation of the data collection forms was to improve data collection practices using standardized forms to extract data. However, despite careful attention and detail in the user-centered design of the forms, they were mostly viewed negatively by staff that used them. Main themes evident for use and value of the data collection forms were: inefficiency, functionality, potential, and trust (Table 4).
Themes for use of the data collection forms.

Participant sentiment toward theme: (+) positive, (−) negative, (±) mixed, no sentiment/neutral (∼).
Inefficiency
The data collection forms were described by some participants as “clunky” and “another task” to complete amongst a busy workload. Participants described barriers to use such as not being able to clearly see when forms had been commenced or completed and difficulty in combining their current processes for data collection with use of the forms. One participant described their use as “another layer of data entry.”
It felt like there was too much double up of all the information. And like, I think everyone probably needed to sit down and work out, well, how can we use the (data collection forms) in a time efficient way that's helpful for everybody? (P08)
Lack of resources and high workloads were also cited as contributing to non-use of data collection forms. Participants described the necessity for having two computer screens to enable data entry, as it was difficult to navigate in and out of forms. Workstation on wheels (WOWs) were also required if a CNC was to complete the initial assessment data collection form in the emergency department during a code stroke. The lack of availability of WOWs and the limited space in the emergency department were barriers to use and it was mentioned that using paper was quicker and easier in this case.
Obviously if I'm going to a code stroke, I take the paper form with me because I'm taking all my notes in the code stroke. While I'm waiting for something to do in the process, you know, I can be filling out the (paper) form. (P01)
The data collection forms were designed to be utilized in real-time to collect patient data, however this required a team effort by multiple professions to reduce data entry burden. This presented challenges to some hospitals in terms of training and education for staff members who frequently rotated.
If I say, ‘Can you enter some data in for me?’ It takes me a good hour or so to show them (team members) where to find all the information … and then that's not adding value to anybody's day. Like it's taking more time. (P07)
The anticipated efficiency gains from using a team for data input were not realized due to variations in the implementation process across different sites. While the data collection forms were designed as standardized forms to promote a uniform data collection procedure across the state, no comprehensive process was provided to individual sites, recognizing the need for context-specific procedures. Consequently, embedding new changes was seen to take time and significant effort.
I guess as a team, we are sort of trying to come up with how we could fill those out. So we're not currently doing them. Like, I guess we're in the process of trying to come up with how we might do it consistently and efficiently. So at the moment if they're being put in, it's the CNC who's putting them in. (P03)
Difficulties were also encountered with the data collection forms not fitting into a clinician's workflow, exacerbating inefficiencies in data collection processes.
Functionality
The functionality of the technology negatively impacted participant's use of the data collection forms. Lack of navigation in and out of the forms was seen as “annoying” and the way the forms were presented in the notes was described as “messy.” There were mixed viewpoints in how easy the data collection forms were to use with some staff highlighting their complexity whilst other staff acknowledging the ease of “just ticking a box.”
When you're trying to find that information, you can't hold your (data collection) form open and have your documentation … then you've gotta go out of your (form), go into your documentation. If not, you'll have to write it down, so then you can fill in your data collection form. Again, that's a waste of time. (P02)
The challenge of interoperability was evident when implementing the data collection forms in different contexts. Each site had different administrative systems for gathering coding and demographic data and aligning data extracts with each of these operating systems was deemed as a complex task.
It's not straightforward. Because I've got a local report and I've got the (national registry) report and trying to merge the two together is very complicated. So again, it just feels … I can do it much quicker and easier just by doing this all manually. (P06)
Potential
Although participants acknowledged their lack of usage and the obstacles associated with data collection forms, they recognized their potential value if there was consistency and commitment to use.
(Data collection forms) are harder in a way because, while it's good robust functionality, it's clinicians who are busy. It's still so much easier to use paper …. They've sort of got to commit to it … like spend time to save time in the long run, which can be a challenge. (P15)
Staff at one hospital site indicated their existing data quality was poor and felt that data collection forms could enhance data accuracy, enabling more timely utilization of data for service evaluation.
We're very keen to utilize them because I guess we've just done a gap analysis on our previous data, and there's lots and lots of data error … if we can input accurate data, it probably actually will be much more reflective of our practice. (P03)
Participants emphasized the possibility for increased productivity through reduced data burden. If multiple team members could complete the data collection forms, it would alleviate the data workload. Additionally, participants recognized the possibility of leveraging data collection forms for clinical purposes, thereby increasing their overall value.
I think knowing what the goal is … it sounds super exciting. And I think you'd be happier dealing with clunky stuff … with the ultimate goal of making it better. (P08)
Trust
Trust was highlighted as an important factor, encompassing confidence in data quality and data entry reliability. Participants from three out of the four study sites expressed hesitancy in employing multiple team members for data collection, primarily due to concerns about trust in both the accuracy of the entered data and in each other's ability to input reliable information.
And then we talked about rolling out to other people, because it's a big job to do on your own. (She) said that she wouldn't trust the data if it was put out to other people who don't know how to collect data. (P08)
This lack of confidence in data quality impacted the overall implementation and use of data collection forms across one study site.
I didn't see the point in a way to push and promote the use of (data collection forms) when I'd find that the data would not be crisp and I'd probably have to go back and do it again … so I didn't push for it to be done. (P07)
Quantitative results: Use of summary page
All hospital sites demonstrated evidence of immediate use of the summary page from its availability in the system (June 2022) until the end of the study period (May 2023). As the four hospital sites were not comparable in size, i.e., number of stroke patient admissions differed between sites, usage scores were presented relative to the average number of stroke patients admitted per month per site (Site 1 n = 49, Site 2 n = 54, Site 3 n = 59, Site 4 n = 13). Study site 1 had the highest average relative use of the summary page with 66 ± 22.5 uses for each stroke patient admission per month. Study site 4 demonstrated the next highest use (M = 47.0 ± 16.6), followed by Study site 3 (M = 34.3 ± 12.3) and Study site 2 (M = 26.7 ± 9.1) (Figure 1). One-way ANOVA results showed statistically significant differences between study sites, F(3,44) = 14.03, p < .001.

Relative use of summary page based on average stroke patient admissions per study site over the data collection period.
A Tukey post-hoc analysis revealed that relative use was significantly higher in Study site 1 compared to Study sites 2, 3 and 4 respectively (39.3 ± 6.5, p < .001; 31.8 ± 6.5, p < .001; 19.1 ± 6.5, p = .026). Study site 4 also showed significantly higher relative use compared to Study site 2 (20.2 ± 6.5, p = .016).
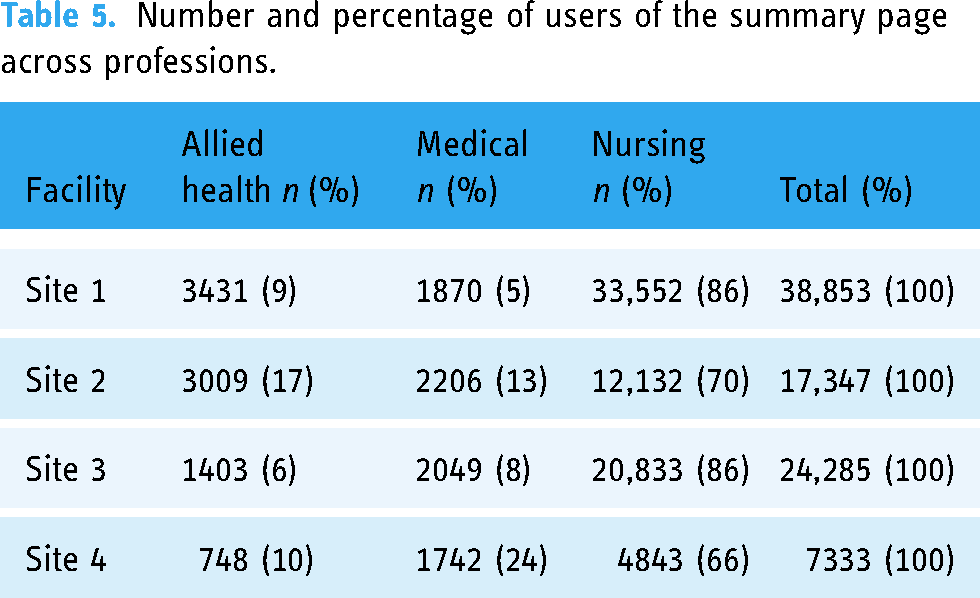
The nursing profession had higher use of the summary page across study sites with distributions similar for Study sites 1 and 3 (Table 5). Study site 2 demonstrated higher use in the allied health professions (17%) while Study site 4 showed a higher use among the medical profession (24%).
Number and percentage of users of the summary page across professions.
Site differences in summary page usage
There were differences in relative use of the summary page across study sites. These differences in usage across sites was unlikely to be explained by education and training, as Study site 1 demonstrated the highest average relative use of the summary page yet was the only study site not to receive the education and training program. Additionally, Study site 4 displayed the next highest use and was the team that showed high engagement in the education and training. These results could indicate either intuitive use of the page by users (Table 3—perceived as easy to use), or that the page was a default view for users. Contextual differences between study sites have been described prior. 43
Quantitative results: Use of data collection forms
Data collection form usage patterns varied markedly across sites (Figure 2) with study site context influencing the implementation and adoption of data collection forms. Data collection forms were more consistently utilized by two out of the four hospital sites. Across the study period the average number of data collection forms completed per month showed that Site 1 displayed moderate and steady use (M = 76 ± 38), Site 2 showed increasing use over time (M = 101 ± 113) while Site 3 (M = 0) and Site 4 (M = 8 ± 17) showed little to no use of the data collection forms.
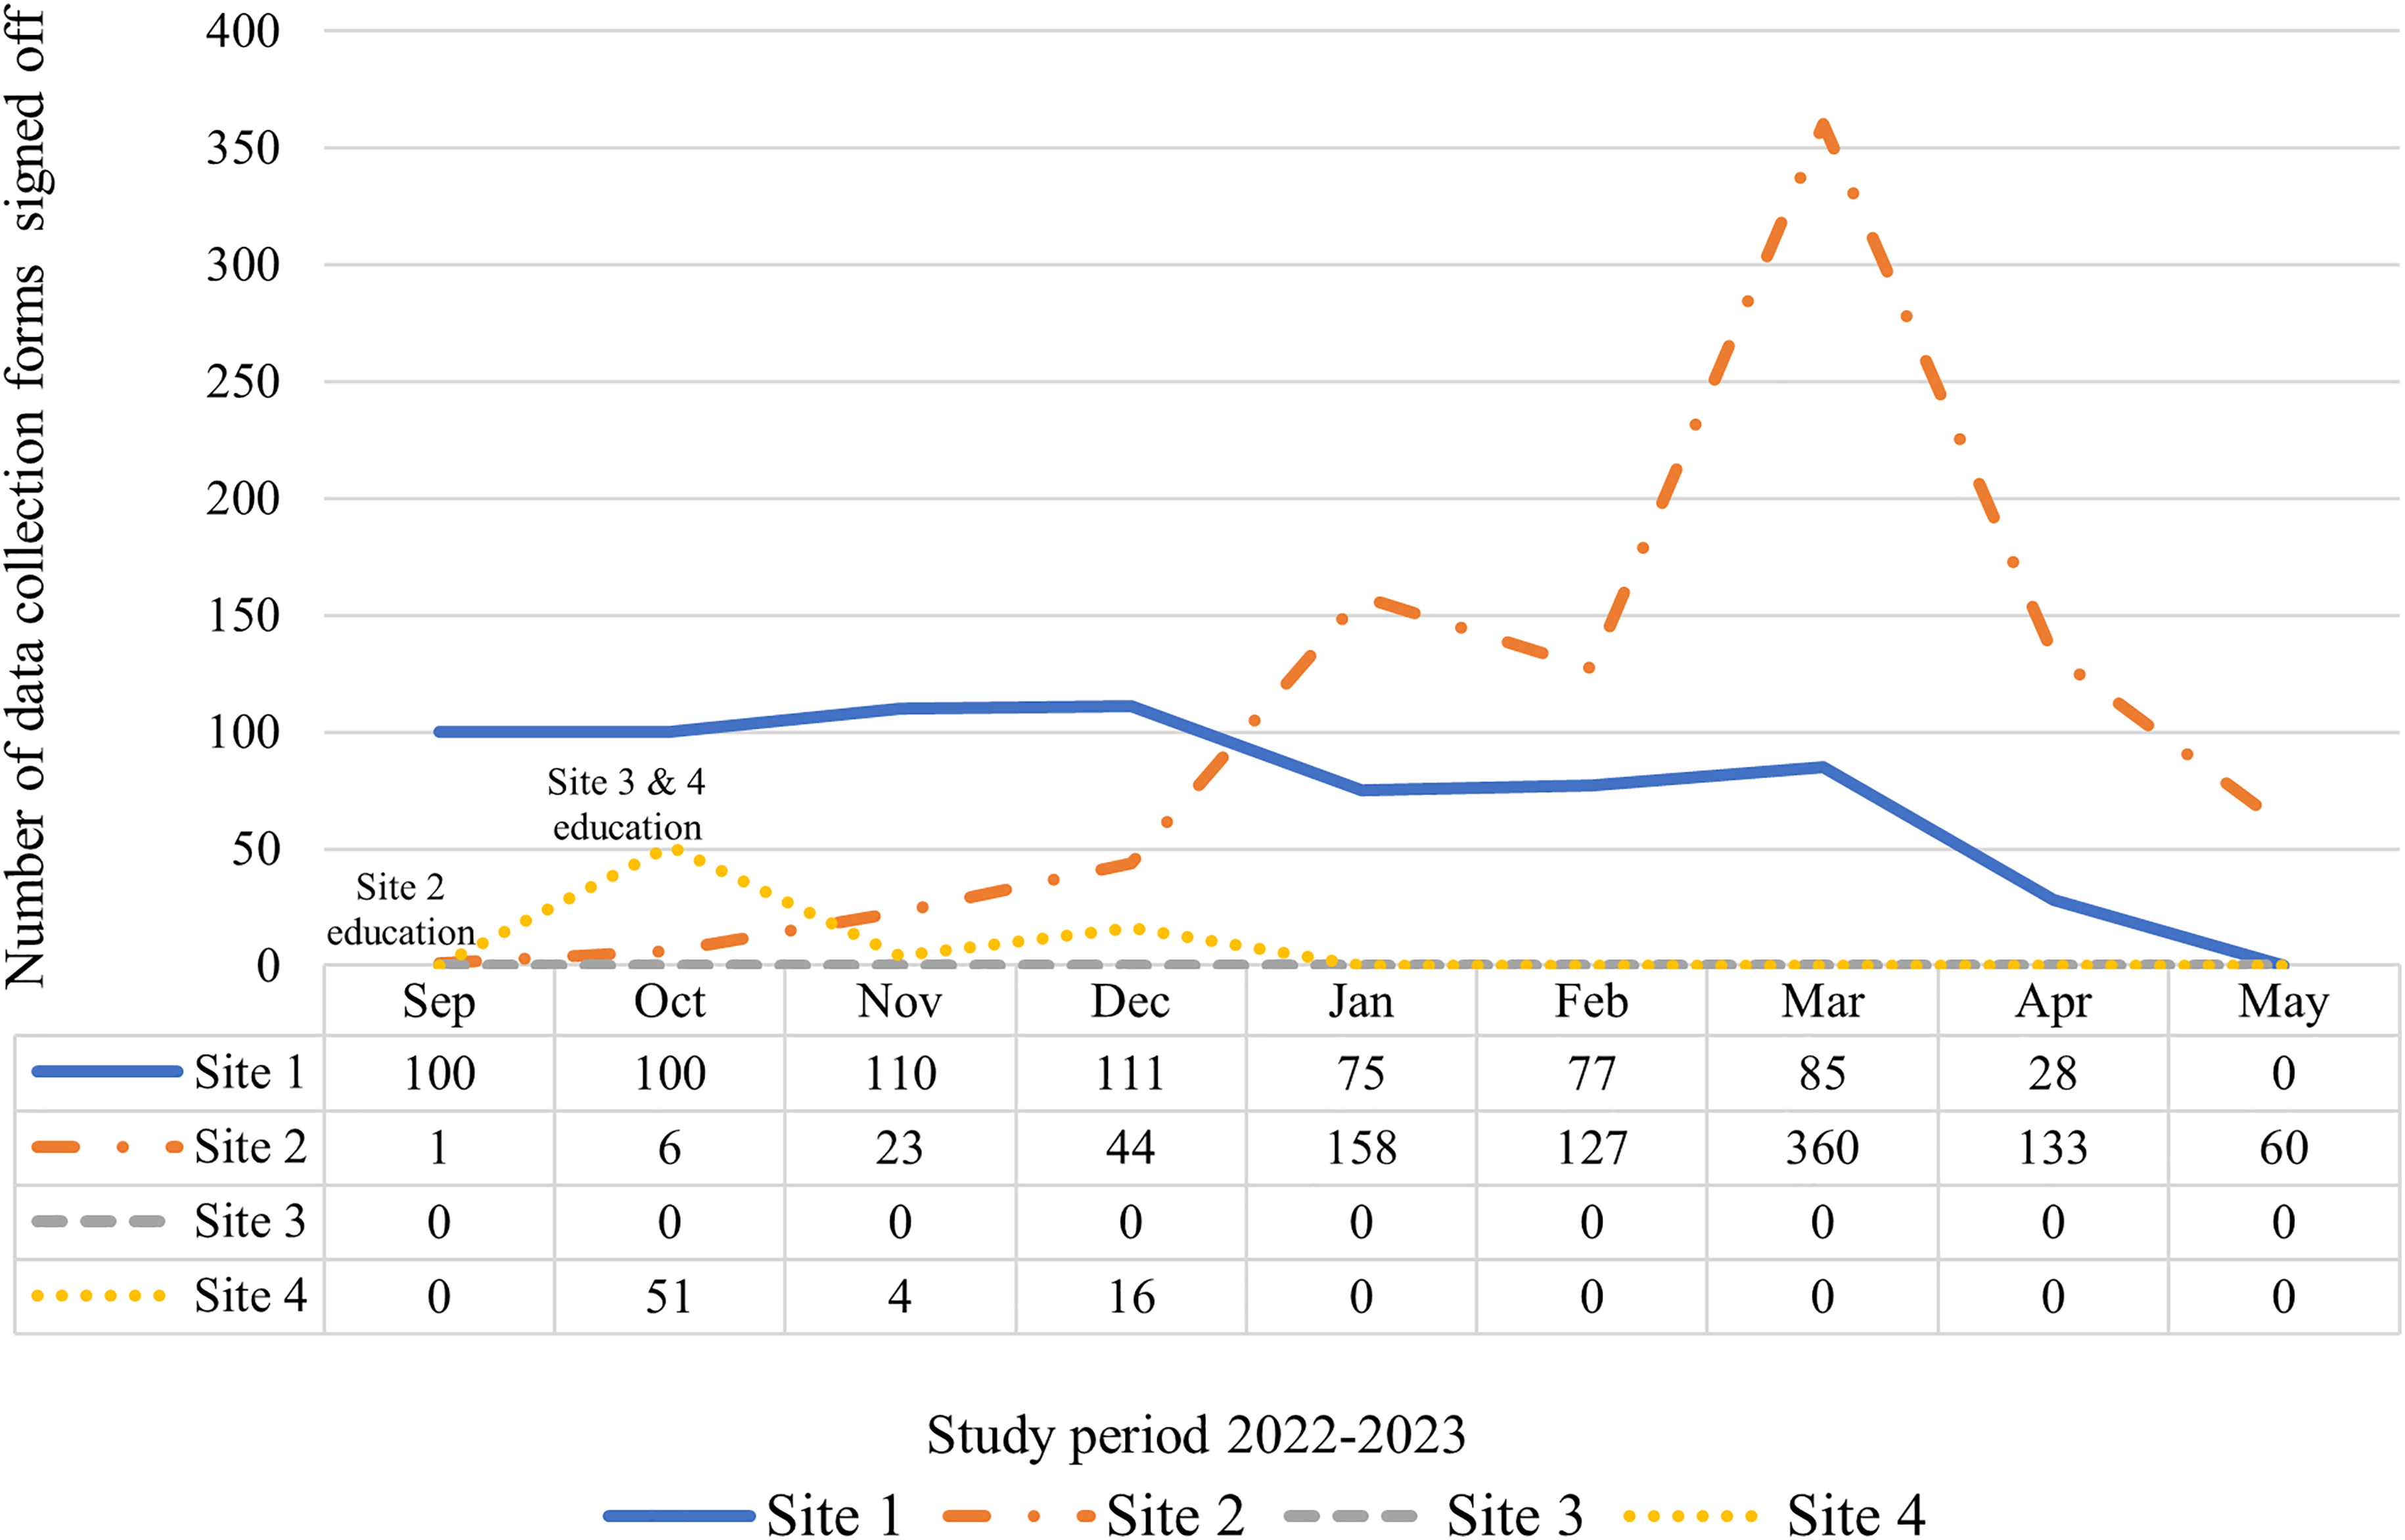
Total number of data collection forms completed per study site for the study period.
Thereafter, relative use of the data collection forms was calculated as a percentage based on average monthly stroke admissions per site. That is, Study site 1 completed 39% of the expected data collection forms in comparison to Site 2 (47%), Site 3 (0%), and Site 4 (15%).
Site differences in data collection form usage
Given the differences across sites in qualitative and quantitative patterns of use, site characteristics were considered further. Notably, Study site 1 acted as the pilot site for the project and there was a clear directive from service leaders that data collection forms were required to be completed for all admitted stroke patients to aid in data collection and extraction. As such, there was a consistent and moderate uptake of use, however, toward the end of the study period, compliance dropped. This coincided with two main champions of the project leaving their positions. Although handover was provided, the purpose and motivation for data collection forms was lost. Study site 2 was slow to adopt the data collection forms citing workforce shortages and high staff turnover. However, as processes for completing and using the forms were established over time, usage increased. Although education and training was provided at Study site 3, the data collection forms were neither tested nor utilized. This study site had established data collection processes and was reticent to make changes, fearing that the quality of data would be compromised if they switched to using the enhancement. Conversely, during the education and training of Study site 4, the hospital expressed eagerness to adopt data collection forms for more efficient extraction of clinical indicator data. However, due to interoperability issues with local data processes and the perceived complexity required, this site faced difficulties in maintaining the use of data collection forms during and after the implementation period.
Discussion
Despite a user-centered design and implementation process, led by clinicians from a statewide multidisciplinary clinical network, there were mixed and varied results across study sites on the use and perceived value of the EMR enhancement. A summary page was perceived as useful with substantial value and potential reflected by rapid uptake and consistent use; however, its use was not always in alignment with its intended design. Data collection forms were inconsistently used, with inefficiency and functionality as main barriers to use. Functionality constraints of the EMR system itself limited the design, use and perceived value of the enhancement highlighting the need for extensive work at the foundational level of EMR system design.
There were differences in use of the summary page and data collection forms between sites; some sites used both elements of the enhancement (Site 1) while others recognized value of only one element of the enhancement which impacted use (Sites 2, 3, and 4). Overall, the mixed and varied results are interesting because our expectation was that a user-centered design should have enabled relatively positive outcomes and a single-instance EMR (i.e., the same EMR system in every location) should have enabled more commonality to the user experience. One explanation could be that although it was a user-centered design, the user group may not have been sufficiently representative of the end-user cohort, or see themselves as responsible for representing the collective viewpoint rather than individual wishes. 41 This has been previously described as a limitation of user-centered design, where a sampling bias can occur due to the impracticality of incorporating all users. 51 This is particularly relevant in hospital settings where it is challenging to “mobilize” end-users, namely clinical staff, from their clinical duties.
Consistent with the literature, our results indicate an interrelationship between use and value with clinicians using the enhancement when it offered value, and the value they derived from it being shaped by their use. 33 For example, nursing staff valued the enhanced visibility of information on the summary page and in turn, used this for tasks such as clinical handover or patient care monitoring. This was reflected by higher page use by nurses. However, our results demonstrate the value of the enhancement was not always evident to clinicians. Although the system was user-centered in its design, it was not consistently utilized according to its intended design. For example, the data collection forms were designed to be used in real-time to capture data during the patient admission. Barriers such as inadequate integration into the clinical workflow, data collection requiring a team effort, trust in data entry by others and limited resources hindered this design intention which was not anticipated in the design phase. One way to explain this mismatch of actual versus intended use, and to help conceptualize the use and nonuse of the stroke EMR enhancement across study sites is to turn to affordance theory. 52
The affordance theory lens to interpret use of the enhancement
Affordance theory is commonly used in information systems (IS) literature to conceptualize the interrelatedness between the technology under investigation and the social context.53,54 In the context of IT, an affordance can be defined as “the possibility for goal-oriented action afforded to specified user groups by technical objects.” 52 An affordance is not a feature of the technology, but rather the relation between the technology and the end-user. In this study, the stroke EMR enhancement (summary page and data collection forms) is the technology and the end-users are the clinicians engaging with the enhancement.
The complexity of EMR systems, compounded by diverse user backgrounds, organizational objectives and strategies, presents challenges in predicting user behavior. In our case, the summary page was designed to facilitate interprofessional practice, enabling multiple healthcare professions to update and access clinical information to enhance communication and collaboration within the team. However, our study findings revealed that nursing staff primarily used the summary page for handover purposes, valuing its “quick snapshot” for convenience and efficiency in this specific task. Consequently, despite relatively high use of the summary page, it was evident that the system was used for different purposes, that is, users did not perceive the affordance in the same way. This aligns with Strong, Volkoff 55 and Leonardi 56 suggesting that a technology can often provide multiple affordances, resulting in the potential for multiple outcomes and variations in individual perceptions of these affordances. That is, we should expect variations in use across users, contexts, and sites. 57
Functionality impacts use despite perception of potential
Two common themes evident for both the summary page and data collection forms were functionality and potential. These main themes had conflicting sentiments, where users perceived its potential value, however uptake was inhibited by the negative impact of lack of functionality. This lack of functionality proved a detrimental aspect of the summary page, as its structure did not align with all disciplines’ clinical needs. Staff members particularly highlighted discrepancies between the limited data input and clinical terminology, perceiving this as a heightened risk to patient care. This was not previously identified in the design phase by end-user representatives. In the case of data collection forms, poor functionality was evident in the challenges related to navigating in and out of the forms. To address this limitation, workarounds were devised, such as using two computer screens, with one for the open form and the other to display EMR data. However, this workaround introduced issues of resource access, as it required the availability of two computer screens, not routinely available within the work environment particularly with bedside mobile workstations. Furthermore, it created a misalignment between intent and clinical workflow, as real-time data entry during patient encounters by medical staff was not feasible. Although this technological limitation was identified in the user testing phase, EMR design constraints limited solutions to such workarounds.
Technological features play a key role in user adoption. 14 Factors such as user interface and compatibility with existing workflows 15 have been identified as areas of concern often leading to workarounds, 58 described as strategies that “bypass or avoid an undesirable feature in a system.” 59 Despite input from clinicians to design features of the stroke EMR enhancement to suit clinical workflows, the product did not meet expectations of the user-design. The functionality of the technology had a detrimental effect on usage, however participants described significant potential to improve the use and value of the stroke EMR enhancement if such technological barriers could be addressed. While constrained by their EMR systems, involving users in optimizations and enhancements is necessary but beneficial outcomes may be limited until the system functionality is improved. Hence, addressing technical barriers of the EMR system is crucial to maximize the potential benefits of EMR enhancements. The challenge lies in redesigning EMR system features that operate within the limitations of the available technology and organizational resources and contexts. Underlying EMR design and flexibility, together with local technical capacity for optimization remain key factors in any successful EMR implementation.60,61
Technical constraints of the EMR including interface design, insufficient customizability, and inefficiency highlight the need for greater system flexibility and adaptability to support individual and team clinical workflows.62,63 Our findings revealed that user perceptions and experiences of the enhancement varied across professional groups and sites, reinforcing the need to identify the most suitable features and affordances for EMR enhancements in various situations and contexts. Widespread stakeholder engagement in the design process can help balance standardization with customization of site-specific workflows, promoting better adoption and alignment with clinical workflows across contexts. An iterative approach to evaluation and system redesign is also required. 64 Furthermore, education programs and ongoing training support can enhance proficiency and user satisfaction, aiding in the adoption and consistent use of enhancements.65,66 Adequate implementation capacity and resources are required to achieve these strategies and maximize the potential benefits of EMR interventions. 67
While the stroke EMR enhancement faced technological constraints, significant global progress is being made in EMR technology, such as integration of natural language processing (NLP) to support clinical practice and research.68,69 Future technical infrastructure, including predictive analytics, NLP, and artificial intelligence (AI), will be essential for supporting clinical workflows, enhancing task management, and improving clinical decision-making. 70 As technological advances are taking place, it is crucial to consider the integration of the clinical workforce not only in the re-design of EMR systems but also in their implementation, usage, and the value derived from these systems, so that technology does not outpace workforce capability.
EMRs have become an integral part of clinicians’ work, and the optimal utilization of the EMR requires a workforce that is adaptable to changing technology. 71 Cultivating a workforce that is digitally literate and adaptable to change becomes essential in enabling clinicians to continuously explore new ways of leveraging digital health technologies. It is through the convergence of technological progress and the end-user's adoption and adaptation of the EMR that their true value can be recognized.
Limitations
The study included four hospital sites representing a mix of hospital location and size typical in Queensland, Australia. Generalizability of the findings to other hospital settings may be limited if their characteristics differ from that studied here. Future research could include a greater number and more diverse range of hospital sites to address this limitation. Although an evidenced-based education and training package was provided, sites were required to implement their own strategies for adoption of the enhancement based on their local context. Adoption was therefore influenced by key stakeholders and champions at each hospital site and their motivation and encouragement of use. The role of clinical champions has been highlighted in prior research as a key significant factor in implementation and adoption of interventions. 72
When analyzing the summary page usage data, we were only able to access number of uses of the summary page, not clicks on the summary page itself, thus we cannot determine the interaction between the user and the page. This was due the available data extraction program being designed primarily for performance metrics. Despite this, our results showed relatively high use of the summary page among participating hospital sites via individual uses of the page. Future analysis of more detailed usage data, such as interaction with or time on the summary page would add more details as to actual use.
The mixed methods design helped alleviate the limitation of a single method, providing greater understanding of the utilization of the tool and providing some explanations for inconsistency of findings. For example, summary page usage rates were high across study sites, despite some participants lamenting the functionality of the tool. However, this may have reflected tool use primarily for handover or as a “default” view after log-in rather than its intended purpose of interprofessional communication and collaboration.
Conclusions
To address challenges in adoption and user acceptance, an EMR enhancement was developed with extensive user involvement. Despite efforts to employ user-centered design principles to optimize the EMR, our results revealed variations in use and perceived value across contexts. Mismatch between actual versus intended use indicated that system usage did not always reflect the intended purpose of its design, where individual and contextual differences can influence how a user perceives a technology affordance. This study emphasizes the importance of moving beyond examining use and non-use of EMR optimizations—and beyond emphasizing the importance of user-centered design—toward comprehending context, i.e., how and why beliefs are formed and how usage practices are operationalized in specific clinical practice. By understanding diversity in use across users and contexts, we can formulate more effective strategies to accommodate and anticipate these differences to optimize future EMR design and use. Further studies are required to investigate use and user perceptions of the EMR, where ongoing adaptation and recognition of affordances can guide iterative improvements to redesign and optimization.
Footnotes
Acknowledgments
We gratefully acknowledge the research participants for their time in conducting this research. The authors would also like to acknowledge the data analysts involved in the extraction of usage logs and hospital site principal investigators for their contribution and coordination of this research.
Availability of data
The datasets used and/or analyzed during the current study are available from the corresponding author on reasonable request.
Conflicting interests
The author(s) declared the following potential conflicts of interest with respect to the research, authorship, and/or publication of this article: RG was involved in the design of the stroke EMR enhancement through the statewide stroke network. No remuneration has or will be provided for this work. SR and RG are employees of one hospital and health service site involved in the study. The remaining authors declare no competing interests.
Contributorship
SR, ABJ, RG, SB, and IR all contributed to the design of the study. SR collected data and SR, SB, IR, and RG assisted in data analysis. SR (corresponding author) drafted the article and all authors revised and approved the final version.
Ethical approval
Ethical approval was obtained from the Metro South Ethics Committee (HREC/2021/QMS/71834).
Funding
The author(s) disclosed receipt of the following financial support for the research, authorship, and/or publication of this article: The primary researcher (SR) is supported by the Digital Health CRC Limited (DHCRC) (project ID DHCRC-0083). DHCRC is funded under the Australian Commonwealth's Cooperative Research Centres (CRC) Program. The funding source provided salary support and was not involved in the study design, data collection, analysis or writing of this article.
Guarantor
SB.
Appendix 1: Components of the stroke EMR enhancement
The stroke summary page includes new clinical features (highlighted) added to the usual summary page view including links to radiology results, pathology results, stroke related data collection forms, current functional status, stroke education and National Institutes of Health Stroke Scale (NIHSS) score.
2. Data collection forms: Example of two of the four data collection form templates demonstrating clinical indicator data requirements and simple tick boxes for documentation. Data from these forms is exported into a comprehensive template for ease of data upload to a national clinical registry.
The four data collection form templates are: (1) Stroke Initial Assessment; (2) Stroke Diagnosis and Interventions; (3) Stroke Swallow and Mobilization Assessment; and (4) Stroke Discharge Care.