
Abstract
Background
Bluetooth low energy (BLE)-based contact-tracing applications were widely used during the COVID-19 pandemic. However, the use of only the received signal strength feature for proximity calculations may not be adaptable to different virus variants or scalable for other potential epidemic diseases.
Objective
This study presents a novel framework in regard to evaluating and classifying personal exposure risk that considers both contact features, which include distance and length of contact, and environment features, which include crowd size and the number of recently infected cases in the environment. The framework utilizes a fuzzy expert system that is adaptable to different virus variants.
Methods
The proposed method was tested on two viruses with different close contact features, which used four membership functions and 256 fuzzy rule sets.
Results
The proposed framework classified personal exposure risks into four classes, which include low, medium, high, and too high risk. The empirical results showed that the fuzzy logic-based approach reduced the number of false positive cases and demonstrated better accuracy and precision than the current BLE-only approaches.
Conclusions
The proposed framework provides a more practical and adaptable method in regard to assessing exposure risks in real-world scenarios. It has the potential to be scalable and adaptable to different virus variants and other potential epidemic diseases by considering both contact and environment features. These findings may be useful in order to develop more effective digital contact-tracing applications and policies.
Introduction
COVID-19 was declared a pandemic by the World Health Organization (WHO) several months after its outbreak. 1 Governments and foreign health organizations came up with strategies in order to stop the pandemic from spreading, such as social isolation, area lock downs, sanitation, and tracking down people who might have been exposed. Tracing contacts entails identifying, alerting, and monitoring individuals who have had close contact with a patient or an asymptomatic case with an infectious disease. Contact tracing is vital to public health in the early phases of an infectious disease outbreak. 2
A greater proportion of monitored and isolated infected individuals will always reduce new cases, which is regardless of the disease's infectiousness level. Factors such as utilization by both secondary cases and infected index subjects, immediate case diagnosis, and prevention of tertiary transmission contribute to the poor performance of contact-tracing apps. 3 All efforts should consequently be made in order to identify and isolate as many infected individuals as possible. 2 Both digital and manual methods exist in regard to tracking down contacts. A qualified public health professional interviews affected individuals in order to identify their contacts via manual contact tracing. The health authority will then monitor contacts in order to see whether they exhibit any symptoms and will give them advice accordingly, such as getting tested or placing themselves in quarantine. This strategy takes time and energy, and people may not recall all of their contacts or know how to contact them.4,5 Digital contact tracing (DCT) is a solution that has been developed in order to overcome these issues. 5 The participants in DCT often have devices, such as smart phones, smartwatches, tablets, or wearable gadgets with them, which are capable of recording their proximity to other individuals via special apps. 6 However, the need for proximity sensing has raised growing concerns in centralized designs regards to its legal and ethical permissibility.4,7 The PEPP-PT framework was considered the preferred framework until massive criticism prompted a move towards a decentralized app. Countries are divided on whether to rely on centralized or decentralized data management. 8 Satellite positioning, wireless local area networks, Bluetooth low energy (BLE), and other localization technologies can be used in order to estimate the proximity to other people. Due to its availability in smartphones, BLE is recommended for proximity sensing. 9 However, BLE combined with ultrasound technology is likely to enhance the accuracy of the app if used together.
There are already several smartphone-based contact tracking protocols, which include PEPP-PT and PACT, but they need to be more practical in a complicated situation. The primary purpose of contact tracing using a smartphone or any wearable device is to assess and categorize a user's risk based on the estimated closeness data from proximity-sensing methods, which are mainly BLE signals and GPS.5,6,10,11 Most contact-tracing solutions just use raw received signal strength index (RSSI) values in order to estimate the users’ risk. Bluetooth's expected range is a lot greater than the safe distance that is suggested for social distancing, so this may collect a lot more contacts than is necessary, which increases the number of false positives (FPs). 10 In addition, there are subtly different definitions and protocols for the term close contact in both range and time duration aspects, which is due to different variants of diseases and standards. Distances of 1.5–2 meters are considered critical, and intervals of between 10 and 15 minutes are regarded critical for the duration. 12 This demonstrates the multi-variable nature of the DCT exposure risk assessment analysis problem.
The previous studies primarily used lab-based methods that use existing datasets from tomography scans, text, sound, and embedded sensor data.13,14 However, most of these studies still need to consider contact and environmental factors. Our proposed method implements a fuzzy expert in order to evaluate and classify the exposure risk by considering the role of both contact features, which include the range, duration of contact, and environment features as well as the sum of the infected individuals in connection and the total number of infected cases in the surroundings.
The following are the main contributions of our proposed method.
Assess and classify the exposure risk assessment based on contact and environment features, such as contact range, contact duration, and the total number of infected individuals in the environment. Exposure risk evaluation alerts can be sent instantly and automatically using the low-cost and energy-saving received signal strength (RSS) observation of BLE on smartphones. Adaptability to different variants of the virus and different protocols, which makes it scalable for various potential epidemic diseases. Health-related standards and experiences, which are usually defined as linguistic variables, are logically utilized.
Prior work
Interviewing the patient and generating a list of recent contacts is laborious in traditional contact tracing. This method needs to be more accurate and faster when dealing with a high virus transmission rate, which is due to recall errors, time delays, and being labor-intensive. 15 A DCT system addresses these deficiencies by gathering and analyzing data in regard to people's proximity, location, and mobility. 16 This section investigates innovative digital techniques and the current state of DCT.
Digital contact tracing
Marvin Du 2 argued that contact tracing in small-world networks instead of deterministic mathematical models could be an effective tool in regard to fighting COVID-19 and other viral infections especially with decreasing and postponing the peak of each day's new cases if it is widely accepted and supports the self-quarantine needs. Ferretti et al. 17 examined the viability of protecting the populace by combining isolation with conventional contact tracing via questionnaires, compared to algorithmic contact tracing assisted by a mobile phone application. A mathematical model was created to estimate the basic reproductive number (R0) and quantify the impact of various transmission routes on infectiousness. The authors suggest that relying only on manual contact tracing is insufficient for controlling the epidemic. Implementing social distancing measures in conjunction with a contact-tracing application that generates proximity contacts and immediately notifies confirmed cases could be effective.
Guillon et al. 18 studied factors that are related to willingness to adopt a contact-tracing app among 1849 French users. Personal privacy is the main issue for the users and a key success factor in this study 18 and the related references. According to a study conducted about the effectiveness of the NHS COVID-19 app in England and Wales during its launch period, a higher app uptake could lead to a further decrease in cases. This study also estimates a potential reduction of 0.8% to 2.3% per percentage point increase in app usage. 19 Lucivero et al. examined the main parameters that affect the acceptance of DCT apps in some European countries. They argued that any digital responses to epidemics, such as COVID-19 should take into account people's values, concerns, and expectations. Orallo et al. 20 reported that the effectiveness of DCT apps needs more than 50% acceptance rates among citizens in centralized architectures and 80% acceptance rates among citizens in decentralized architectures, which is in addition to social isolation and mask-wearing.
A dynamic graph model was used in 21 in order to model the COVID-19 propagation over time using manual and digitally traced individual interactions. The results obtained by Madoery et al. in 11 suggest that using machine learning models in combination with auxiliary data gathered by smartphones, which included light and temperature, in order to detect the environment type, such as indoor or outdoor improves the performance in both proximity accuracy and environmental risk in DCT applications. Six smartphone sensors are used in the contact tracking method in this study. 22 Keeling et al. 12 investigated the efficiency of the contact-tracing strategy in order to control coronavirus in the UK among 5800 responders, and they concluded that the close contact definition is an essential parameter in the evaluation of contact-tracing performance. Also, rapid detection of infected cases is the key to success in contact tracing. Also, knowing the distribution of close contacts enables the prediction of detecting secondary cases. Reference 23 analyses and compares the various aspects of DCT and describes the data protection aspects.
The previous studies primarily used lab-based methods that use existing datasets from tomography scans, text, sound, and embedded sensor data.13,14 Blockchain and adaptive neuro-fuzzy inference system (ANFIS) techniques are used in 24 in order to develop a contact-tracing app. The application also provides a self-assessment tool for tracking symptoms. A fuzzy logic-based support system with three distinct subsystems is used in order to evaluate a personal risk index in. 25 The ANFIS system is suggested by the researchers in 26 for the classification and examination of coronavirus disease symptoms-based predictions. However, most of these studies did not take contact and the environmental factors into account, and risk assessments are only based on raw RSS BLE measurements.
Methods
Proposed proximity-based contact tracing
The suggested system architecture demonstrates how the various system components are connected to one another and list the purposes of each component. Figure 1 shows that a decentralized architecture is used for the proposed system, which includes seven major functions in order to evaluate the exposure risks, which include advertising packets, estimating contact durations, estimating crowd index, estimating recent infection rates, getting the list of infected user-ids from the server, assessing exposure risks based on fuzzy logic, and notifying the user about their risk status. The following are the steps in detail.
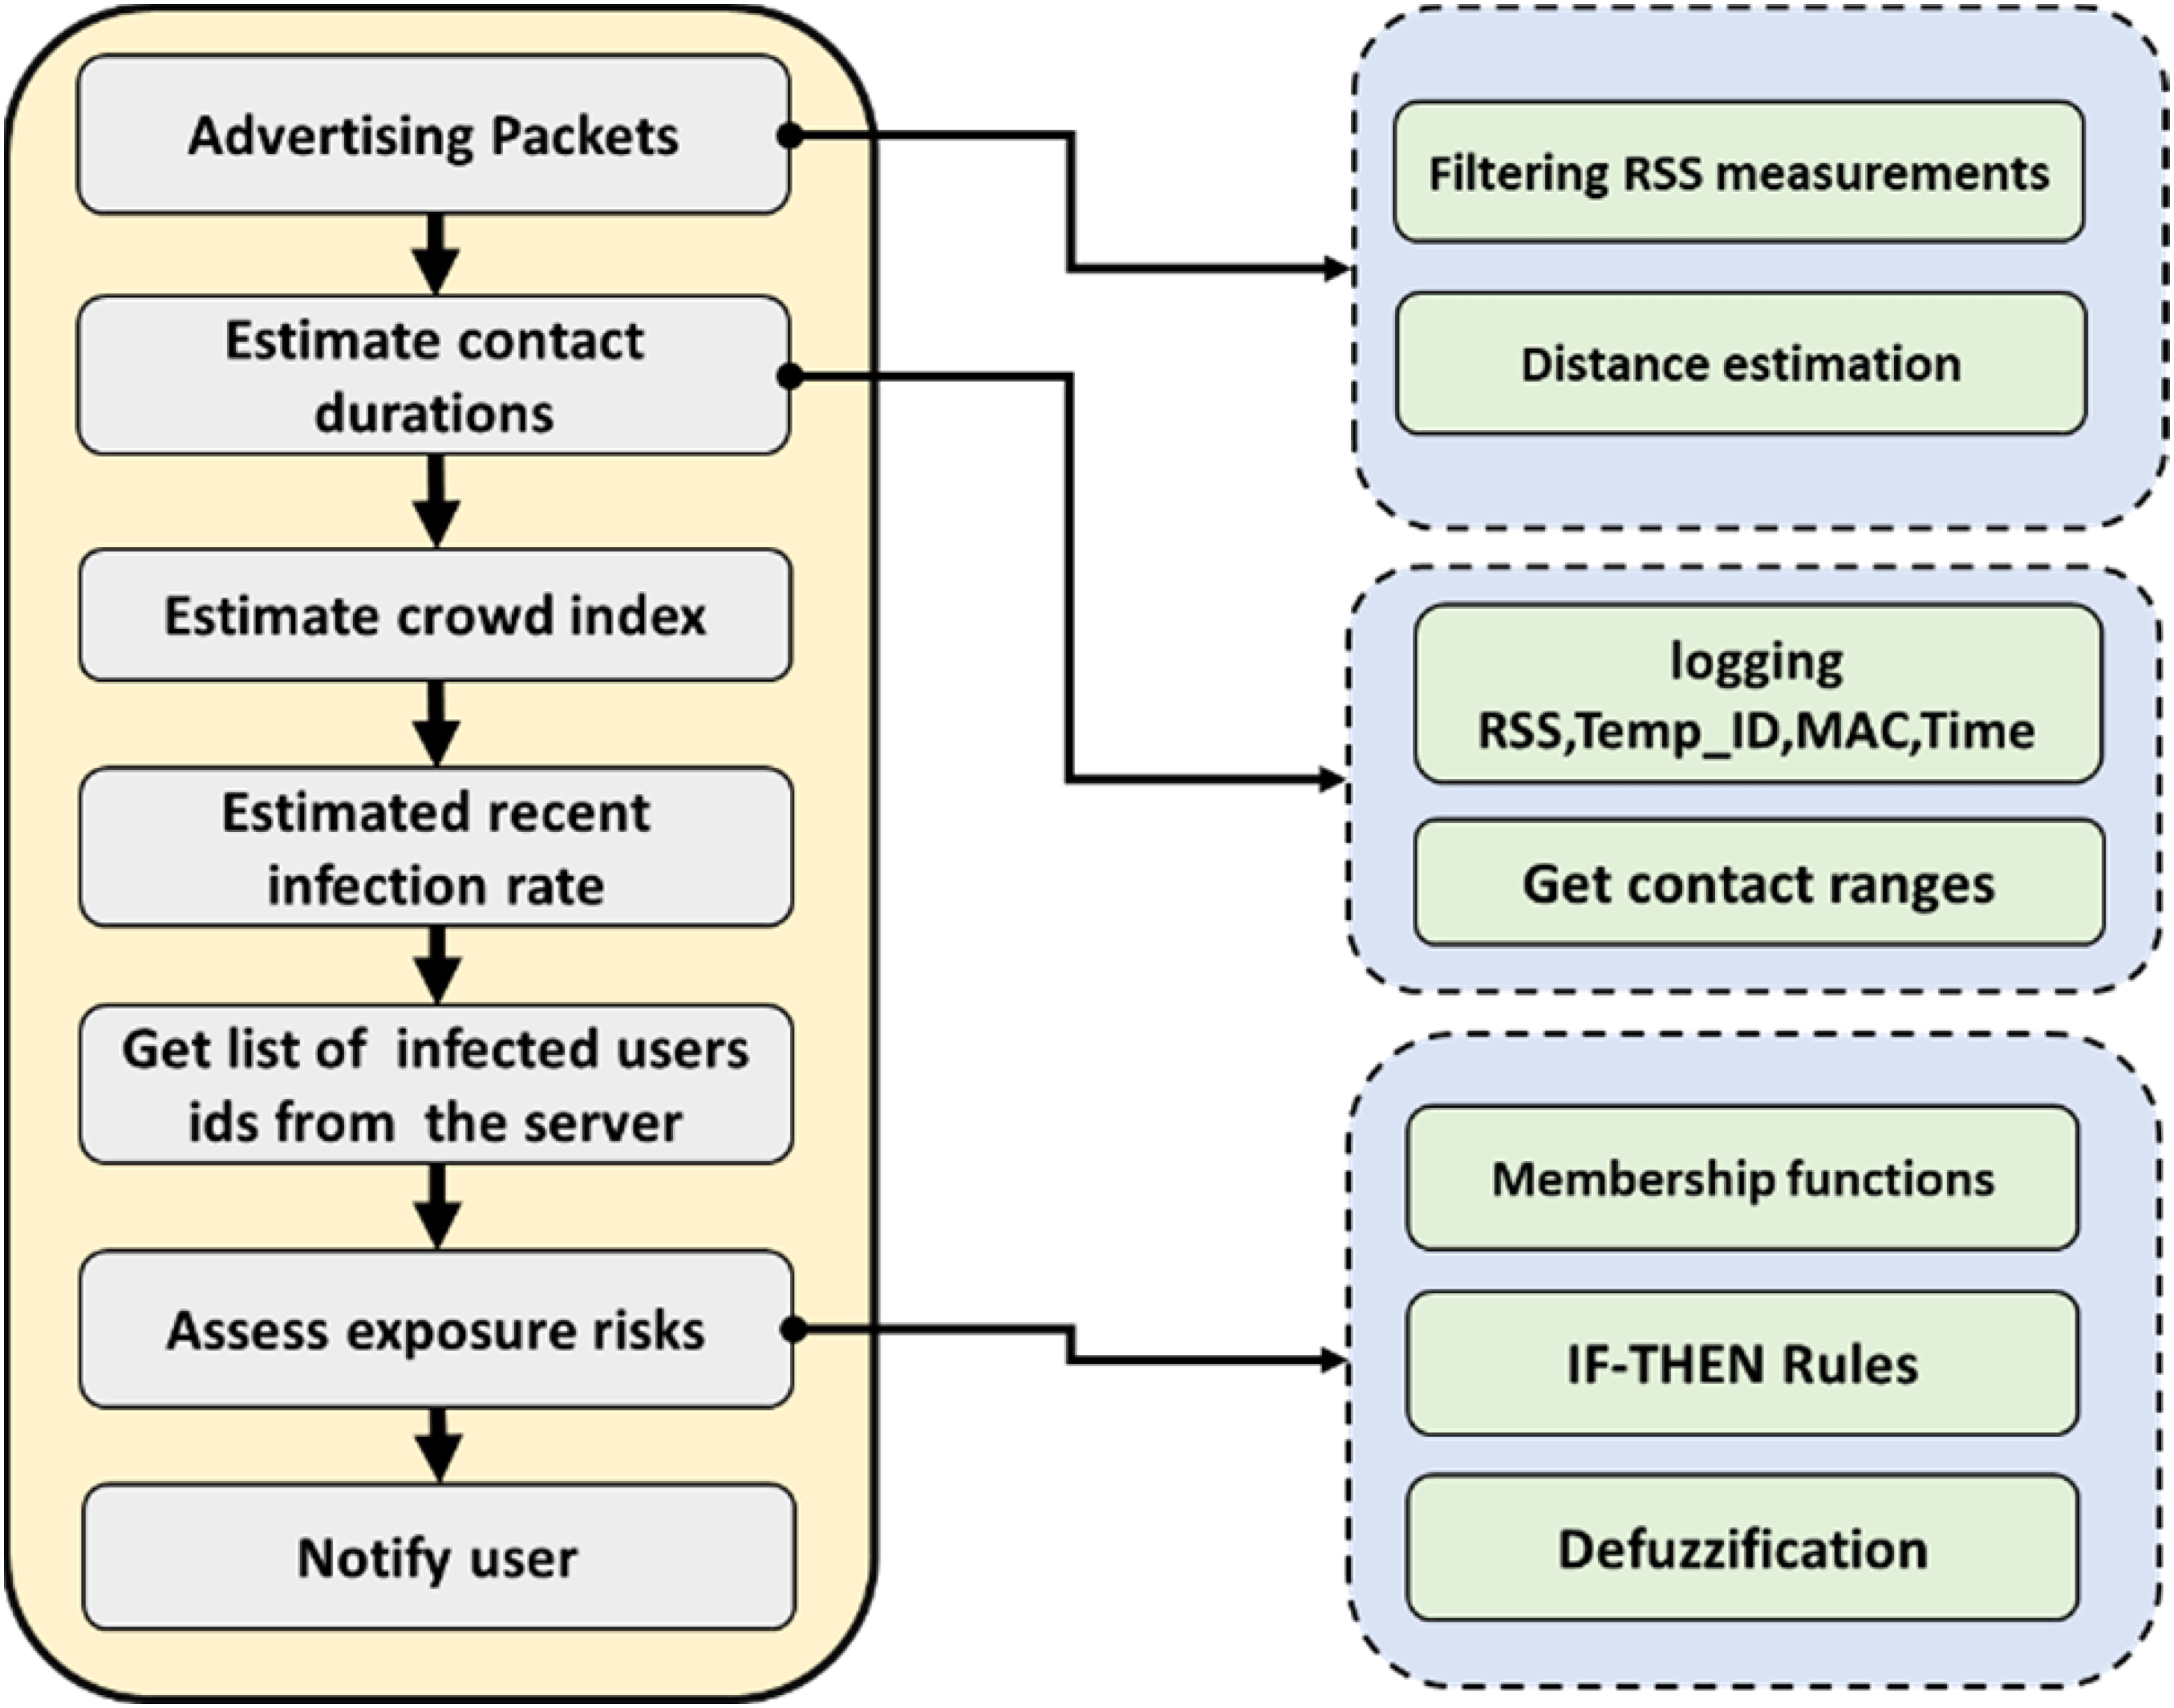
Proposed architecture for exposure risk assessment.
Range detection With BLE
BLE beacons are often referred to as small, inexpensive, and battery-powered wireless transmitters. Beacons transmit their distinctive identity to neighboring BLE-capable electrical appliances, such as smartphones. 27 One-way BLE discovery is only used in the advertising mode. Data packages are periodically sent out to other devices that can receive them, such as cell phones or smartwatches.
RSSI is one of the most utilized features, which is due to its ease of use and relative simplicity.
11
RSSI is straightforward, but it is usually imprecise, which is due to no line of sight and multipath effects.5,28 As a result, RSSI measurements might considerably fluctuate over time. Specialists have investigated various approaches to improve the precision of RSSI-based proximity estimation methods. Some of the schemes used include integrating other smartphone sensors and applying various filtering methods.
29
One primary filter that is applied using RSSI observations is the moving average. The moving-average method obtains a new value by absorbing n samples, averaging the results, and then calculating a mean value. This value is typically more accurate than the observations that were initially recorded. The following formula was applied: the formula, which is provided below, was applied in a manner that was analogous to the description in.
30

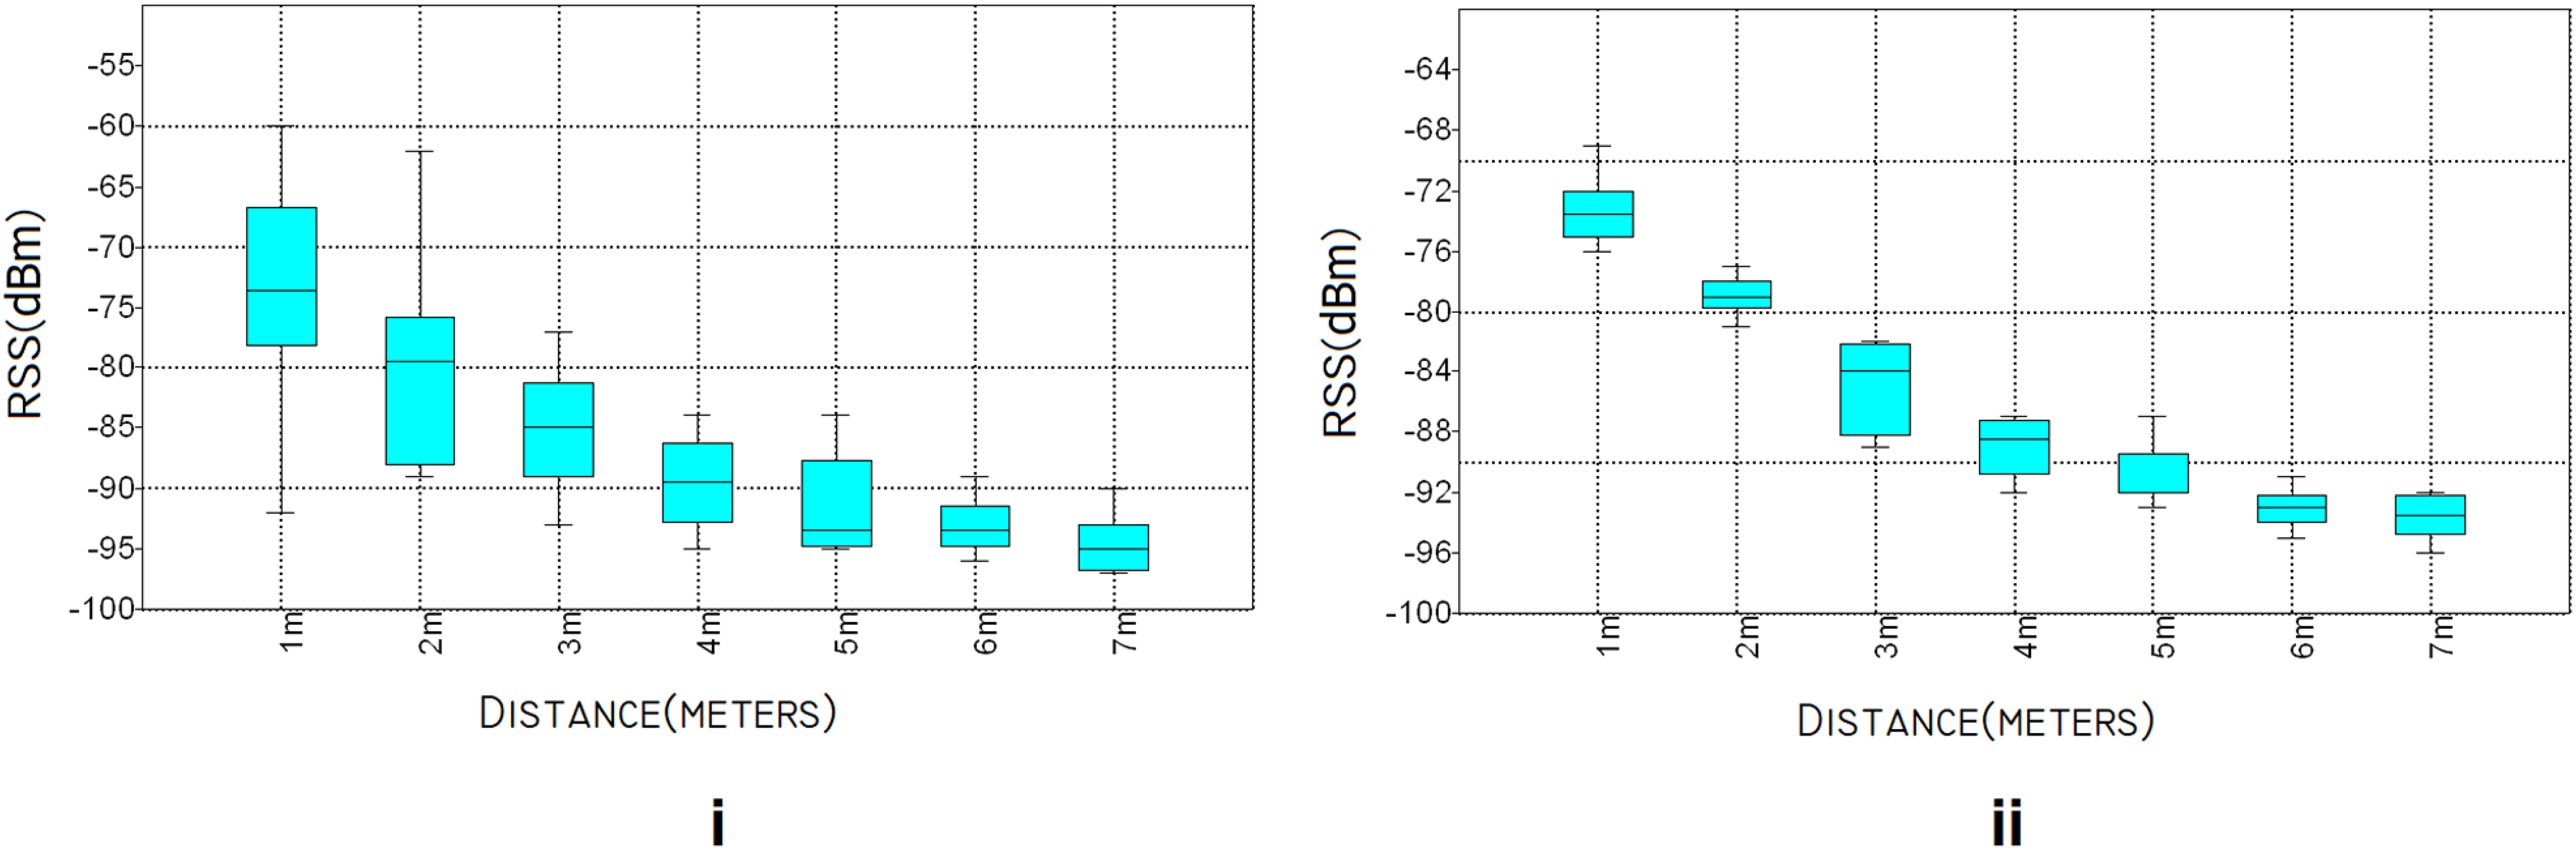
RSS distribution (i) the boxplot of the raw RSS values and (ii) the boxplot of the moving average filtered RSS values. RSS: received signal strength.
The transmitter's RSSI can be used in order to calculate the receiver's distance. Equation 2
30
can be used in order to estimate the path loss in its most basic form.


Risk assessment using fuzzy logic
Fuzzy expert system
Fuzzy logic offers techniques that emulate human reasoning in regard to dealing with uncertainty. A fuzzy set gives objects in the universe a degree of membership, which is a real value between zero and one. Fuzzy inference systems (FISs) provide output by analyzing partial, vague, and fuzzy inputs to a problem whose linguistic parameters can be described. A FIS implements a fuzzification interface in order to convert a value from input to output space using fuzzy logic. The operational knowledge and expertise of human operators are recorded in the fuzzy rule-based system, which is a group of IF-THEN statements. A decision-making component that uses the IF-THEN statements in order to make inferences, which is followed by a defuzzification component that turns fuzzy results into crisp values. The literature 31 contains more details on this subject.
Proposed risk assessment method
COVID-19 first appeared in late 2019 and rapidly spread throughout the world. DCT refers to a form of contact tracing that utilizes proximity-sensing techniques, which are mostly BLE, in order to detect the interaction between an infected individual and a user particularly during the early stages of an outbreak. Most digital contact tracking technologies and applications employ only raw RSSI values for proximity sensing and risk evaluation. Bluetooth's estimated range is significantly greater than the recommended distancing, so this may gather many more contacts than real cases, which increases the probability of inaccurate results, such as more FPs and false negatives (FNs). The most important aspect of the proposed method is its accordance with the guidelines and the factors that are provided by health organizations, such as the Centers for Disease Control and Prevention (CDC) and WHO for contact tracing. The primary influencing parameters associated with contact tracing are contact duration, contact range, and contact environment. 32 The proposed method uses fuzzy logic in order to evaluate and classify exposure risk by taking into account both contact features, which include distance and length of contact, and environment features, which include crowd and the number of recently infected cases in the environment.
Membership functions and degrees of each parameter are defined in the relevant standards. For example, the 1.5-meter distance is considered as a high-risk contact range, and 15 min is considered as a high-risk contact duration, which are in accordance with the guidelines and factors provided by health organizations for COVID-19.
The centroid calculation is utilized for defuzzification, which returns a grade based on the areas under the aggregated output functions. Exposure risks are categorized into four classes based on their level of risk, which include low, medium, high, and very high risk.
Implementation and evaluations
This section begins with a discussion of the architecture and technical aspects that are implemented. The following section explains fuzzy membership functions, the risk assessment matrix, fuzzy rules, and defuzzification. Our primary innovation is in the classification of exposure risk by taking into account both contact and environmental characteristics.
System overview
The system's design is based on a decentralized contact-tracing model with four steps that include user registration, proximity detection, infection report, and status update, which are shown in Figure 3. It should be mentioned that the study assumes users will be reachable throughout the study. All the users download the app to their cellphones, sign up with the central server, and then receive a temporary identification code in the user registration stage. A phone may detect and record contacts from other adjacent phones via proximity sensing. Both phones will communicate with one another by exchanging their respective IDs. Power consumption can be reduced by setting the scanning period to run occasionally, such as every 60 s or every 2 min, which depends on the situation. The purpose of storing locally on a smart phone instead of centrally on a database or a server is to protect against any security breaches and ensure the anonymity of non-infectious individuals.

The implemented decentralized digital contact-tracing strategy. (i) An ID is exchanged between two mobile devices, and RSS and time are recorded when two people come into contact. (ii) They only submit their ID to the server when A gets infected. (iii) All the other phones regularly get lists of positive case IDs from the server. (iv) Phones then check the downloaded IDs with their contact lists, and the user receives a notification if there is a match. RSS: received signal strength.
A person reports their positive status to the server when they become infected. The identification must still be revealed at this time. The server subsequently updates the list of individuals who have been infected. Every other user simultaneously downloads the server's list of infected people. The downloaded IDs are then compared with each phone's contact history, and the phone informs the user of relevant contacts if a match is found.
A Samsung A51 with an Octa-core processor and up to 6GB of RAM was chosen as the experiment hardware, Android 11 selected as the operating system, and Android Studio was chosen as the development platform. We developed an experimental application in order to advertise packets and record the device's name, MAC address, identification code, RSS measurements, scanning intervals, and time stamps. The contacts distances were estimated after applying a moving-average method to the RSS measurements. The contact duration is easily obtained by multiplying the total number of recorded contacts by the scanning time interval for the given time. For instance, the total contact time would be 10 min if there were 10 encounters in total for two users in the last 24 h and the scanning interval was set to 1 min.
Fuzzy membership functions
A person is regarded as a contact if they were exposed to a COVID-19 patient between 2 and 10 days prior to or following the patient's onset of symptoms. Close contact has been defined by the CDC as “being within 6 feet of an infected person for 15 min or more over a 24-h period.” The risk of transmission increases with closer and prolonged contact with an infected person. 33 Close contact should also include repeated short interactions over a 24 h period. Table 1 shows the classification of the contact into high risk and low risk based on the protocols that were published by the European Centre for Disease Prevention and Control (ECDC). Our proposed exposure risk assessment, which is based on fuzzy logic, takes into account four main factors that include contact range, contact duration, population, and the rate of people who have recently been infected. The fuzzy membership functions and technical considerations for each factor are illustrated below.
Classification of high and low exposure risk. 34

Contact range
Infected people's activities like breathing, talking, and singing are the major sources of SARS-CoV-2 aerosols. 35 The distance from the infection source is essential in regard to assessing the exposure risk. Figure 4 illustrates how the probability of infection decreases with distance. The high-risk contacts are those that are closer than 1.5 meters, and the lower risk contacts are those that are farther apart. 36

Mechanisms for short-range exposure from. 36
The contact range membership function has four classes that include extremely high risk, which is less than 1.5 meters, high risk, which is 1.5–4.5 meters, risky, which is 3.0–6.0 meters, and low risk, which is longer than 6.0 meters. These are all shown in Figure 5. The membership values of the contact range factor are calculated by using the following linear and triangular functions.
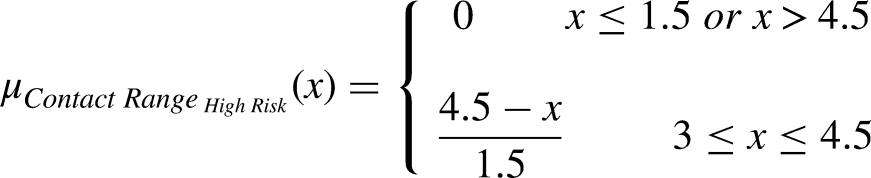
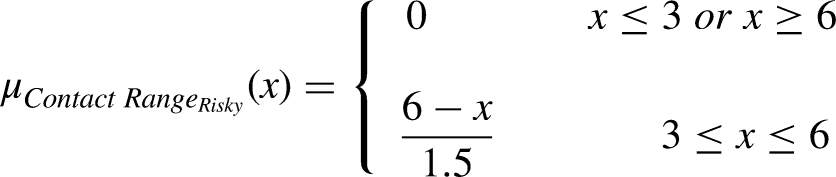


Membership function for the contact range.
Where x and μ are contact range and membership grade, respectively.
Contact duration
Another important factor in regard to evaluating the exposure risk is contact the duration, which are based on the fact that the risk of exposure to short-distance transmission via aerosols and droplets rises over time. According to the CDC, high-risk contacts last 15 min or longer.
32
However, this isn't necessarily a magic number, and transmission can occur in a shorter time, which is based on the contact range. For instance, a 6-s exposure at 1 meter is equivalent to a 1-min exposure at 2 meters. As a result, the contact duration membership function has four classes that include short duration, which is 0–10 min, medium duration, which is 5–15 min, long duration, which is 10–20 min, and too long duration, which is more than 15 min. These ranges are all illustrated in Figure 6. These ranges are not fixed values and change depending on the virus variants, because new variants are a common feature of virus evolution. The following fuzzy linear and triangular membership functions represent the membership value of the contact duration factor.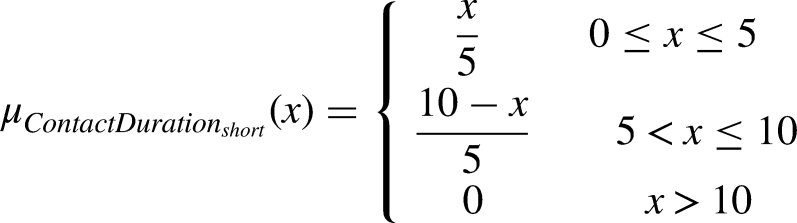


Membership function for the contact duration.
Where x is the contact duration in minutes, and μ is the membership grades.
Recently infected cases
An infected person's particles easily spread across an entire room or enclosed space. The particles may continue to flow in the air for hours after an individual has left the area.37,38 As the percentage of individuals with infections within a given environment rises, so does the probability of exposure. According to preliminary findings from two studies, people are more likely to spread a virus during the initial stages of the infection. The peak infectiousness happens about 2 days before the first signs of illness. They also demonstrated that their highly contagious loads persisted for up to 7 days after the onset of an illness.
34
The number of infected cases membership function has four classes that include low (0–5%), moderate (2.5–7.5%), high (5–7.5%), and too high (more than 7.5%), which are shown in Figure 7. The percentage of recently infected cases is calculated simply by dividing the number of infected people in the last 9 days by the total number of registered users multiplied by 100. The following fuzzy linear and triangular membership functions, which are provided below, represent the membership value of the recently infected cases factor.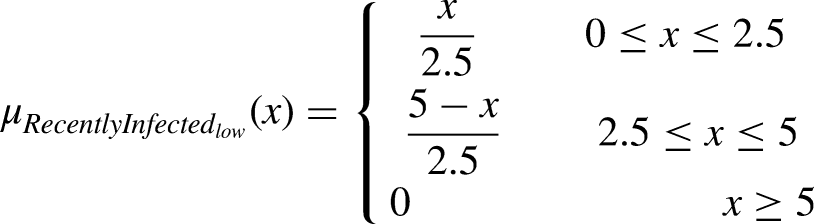


Membership function for recently infected cases in the past 9 days.
Where x is the recently infected individuals as a percentage, and μ is the membership grade.
Environment population
People spend almost of their time in indoor spaces,
39
so the probability of becoming infected in those settings is relatively high. Various studies show that SARS-CoV-2 is more easily spread and transmissible indoors particularly in populated places, such as universities, schools, prisons, and healthcare facilities, which are a result of the presence or the close proximity of highly contagious sources in addition to the increased probability of being in direct contact with contaminated objects or individuals.
40
The number of people per room or in the occupied space serves as a measure of overpopulation, which excludes balconies, porches, foyers, and hallways. Each person needs a minimum of 16 square meters of space when the safe distance is assumed to be 2 meters. We proposed a crowd index in the fuzzy membership function of the environment crowd that uses this criterion in order to determine the crowding status of the environment, which is provided below.


Membership function for environment crowd.
Fuzzy rules and defuzzification
Creating fuzzy rules is the next stage that is essential to the FIS. The fuzzy rules are a set of IF-THEN statements that are used in order to convert an input into an output space. Four input variables are defined, and each has four linguistic levels. This means that there could be 256 fuzzy rules. Table 2 illustrates some of these fuzzy rules in a matrix form. The FIS must output a crisp value in order to indicate the classification result, which is the exposure risk value, for the inputs once all fuzzy rule assessments have been completed. This procedure is known as defuzzification. Defuzzification involves taking a single number from the output of the combined fuzzy set. In other words, the results of the fuzzy inference are converted into a crisp output during defuzzification. The centroid computation, which yields a grade weighted by the areas below the aggregated output functions, is the most widely employed defuzzification technique. Equation 5 provides the centroid of the aggregated area.
Fuzzy rule sets.

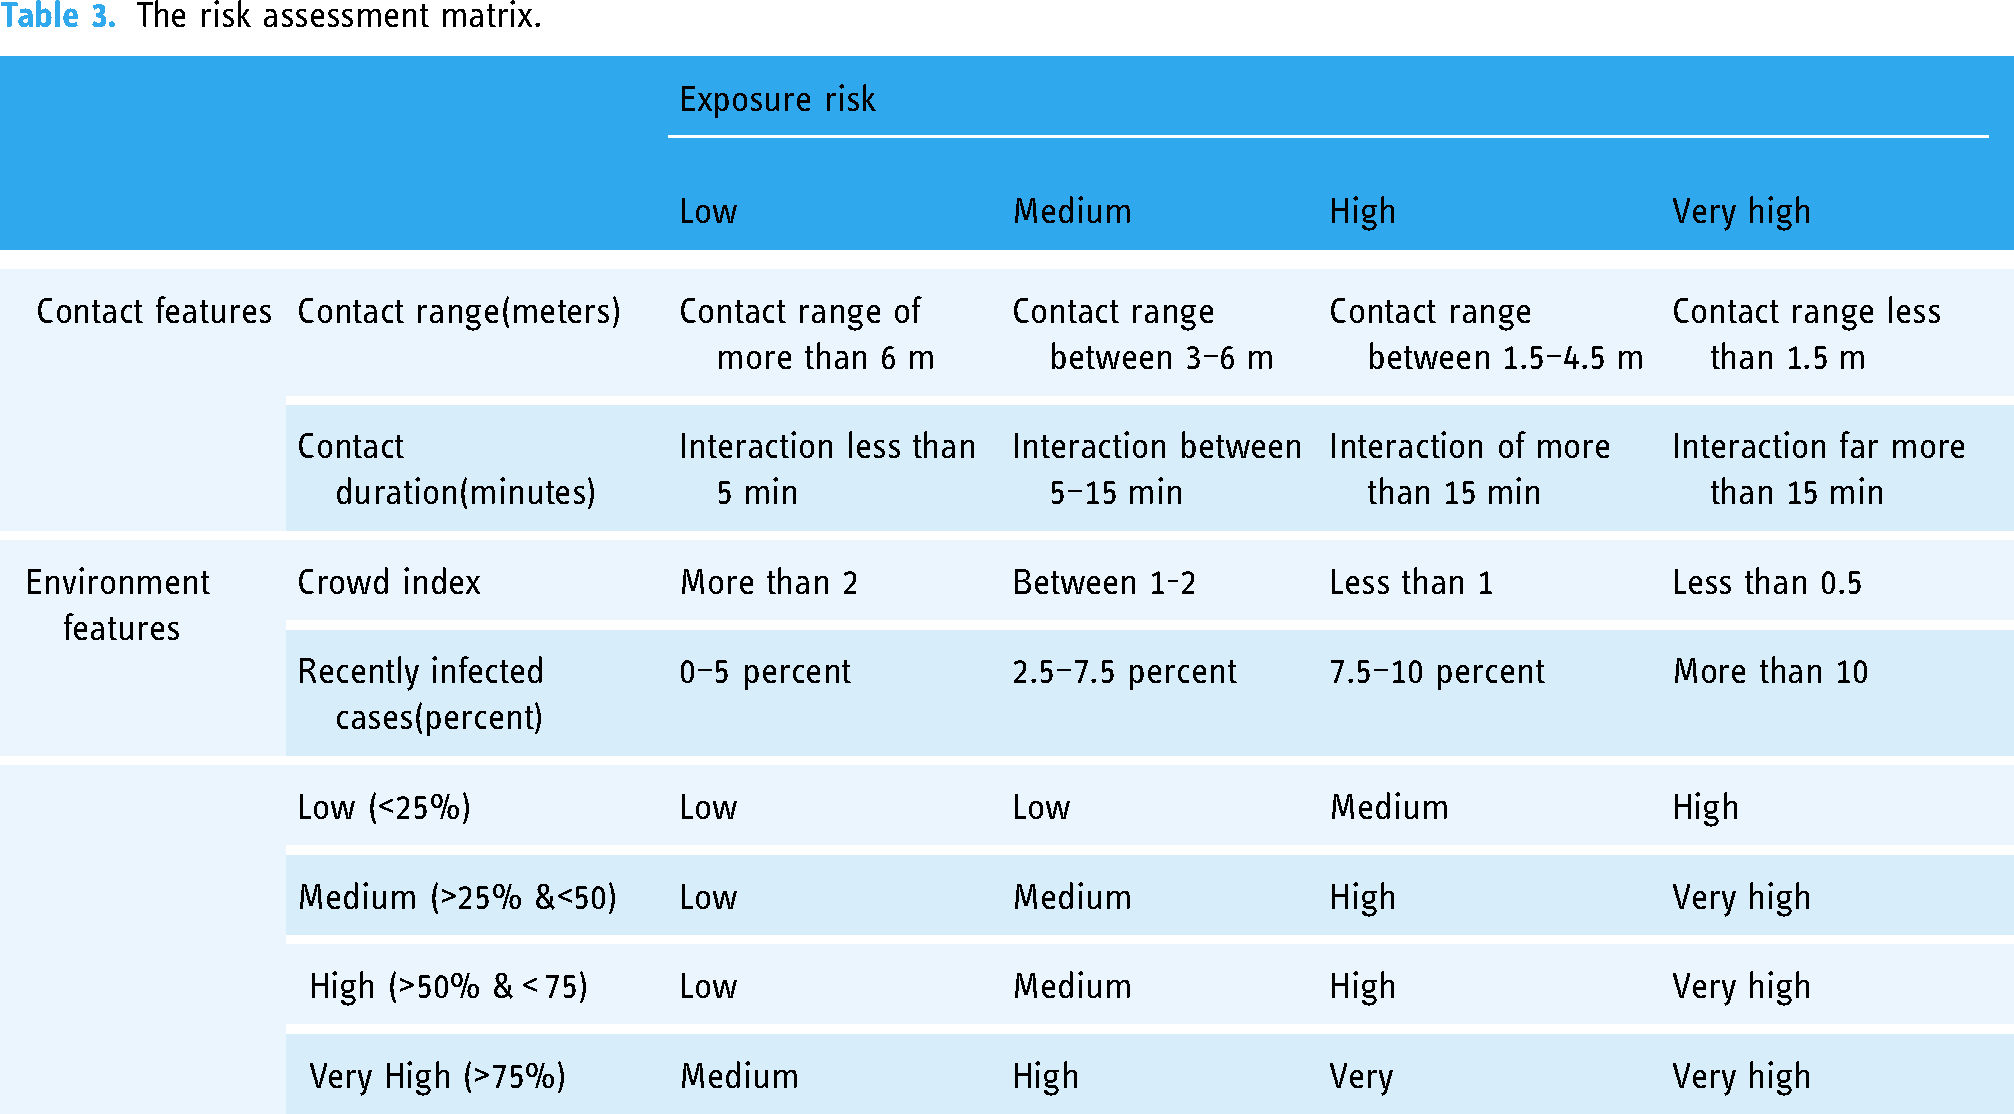
Where c1, c2…, cn are the centroid coordinates on the x-axis, and S1, S2…, Sn are the areas of regions under the aggregated function. The outputs of defuzzification were scaled from to zero to 100, and four exposure risk classes were defined as low (0–25%), medium (25–50%), high (50–75%), and very high (more than 75%). Table 3 shows the risk assessment matrix.
The risk assessment matrix.
Evaluation outcomes
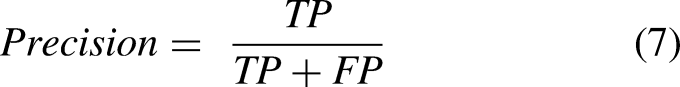
We employed two measures, which included precision and accuracy, in order to evaluate the efficacy of the proposed exposure risk assessment. Four parameters, which include true positive (TP), true negative (TN), FP, and FN, are needed in order to calculate these measures. TP refers to risky contacts, which the system has correctly detected as risky. TN denotes a safe and non-infection interaction, which the system correctly detected as a safe contact. The number of safe contacts that the system wrongly identified as risky contacts is denoted by FN, and FP denotes the risky contacts that were wrongly detected as safe contacts. These parameters are summarized in Table 4. The above metrics can be calculated by using Equation 6 and Equation 7.

Summary of the needed parameters for the metrics.

FP: false positive; FN: false negative; TP: true positive; TN: true negative.
Accuracy is the proportion of TPs and TNs that were accurately identified. Precision indicates how many are truly at high risk from all the positive forecasts. Four contact durations, four crowd indices, and four recent infection rates, were designed in order to evaluate the system's performance out of 256 test instances with all feasible states, which included four testing ranges. The application had two settings for logging measurements, which included BLE only and BLE with a fuzzy approach. Both Mamdani and Takagi-Sugeno FISs are implemented for mapping to an output. In addition, two viruses were examined in order to assess the scalability of the proposed method with different variants and viruses with different characteristics in the same environment features and different contact features, which included one with close contact characteristics of the coronavirus, a contact distance that was closer than 2 meters, and a contact duration that was shorter than 15 min. The second one included another hypothetical virus with a higher contact distance and a longer contact time as the close contact.
The results were compared with the test data following data measurement. Figure 9 illustrates the obtained results for COVID-19, and Figure 10 illustrates the obtained results for a hypothetical virus. The results show that the system's accuracy was only 37.89%, and the precision was only 32.59% when BLE-only proximity sensing was used in the COVID-19 contact feature set. The total number of FPs was 151. The high visibility and RSS variation of BLE are the most likely explanations for the negative result. Table 5 illustrates that the system recognized 52 FPs and 45 FNs with more than 62% accuracy and 72% precision by implementing Takagi-Sugeno FIS. Using fuzzy logic with filtered RSS and Mamdani FIS significantly reduced the FPs to 58, which increased the system's accuracy to 64.45% and the precision to71.98%. Also, the obtained accuracy of the hypothetical virus for the BLE-only proximity sensing was only 30.10%, and the precision was 38.67%, which are displayed in Table 6. The system recognized 75 FPs and 31 FNs when Takagi-Sugeno FIS was implemented, which produced an accuracy of 58% and a precision of 61%. The FPs were reduced to 69 compared to when fuzzy logic with filtered RSS and Mamdani FIS was implemented, which increased the system's accuracy to 67.45% and the precision to 62.89%.

Evaluation results for the corona virus. The green bars are BLE only, the yellow bars are the proposed fuzzy approach with Mamdani FIS, and blue bars are the proposed fuzzy approach with Sugeno FIS. BLE; Bluetooth low energy; FIS; fuzzy inference system.
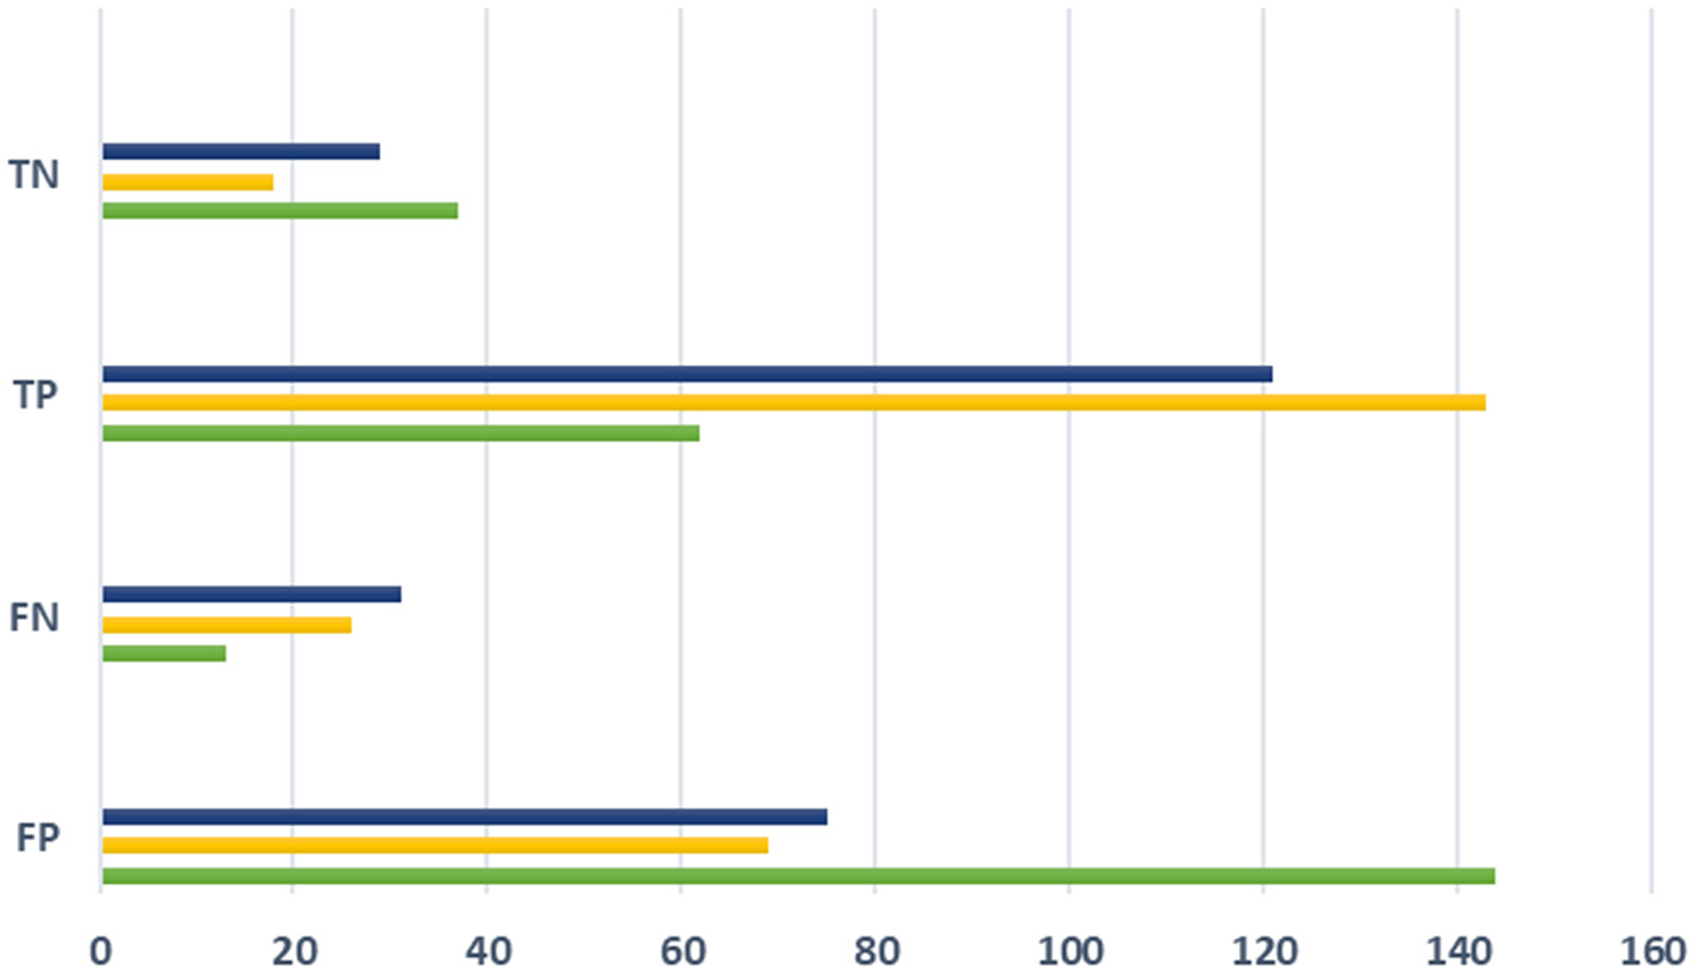
Evaluation results for hypothetical virus. The green bars are BLE only, the yellow bars are the proposed fuzzy approach with Mamdani FIS, and the blue bars are the proposed fuzzy approach with Sugeno FIS. BLE: Bluetooth low energy; FIS; fuzzy inference system.
Evaluation results for COVID-19.

RSS: received signal strength; FP: false positive; FN: false negative; BLE: Bluetooth low energy; TP: true positive; TN: true negative; FIS: fuzzy inference system.
Evaluation results for hypothetical virus.
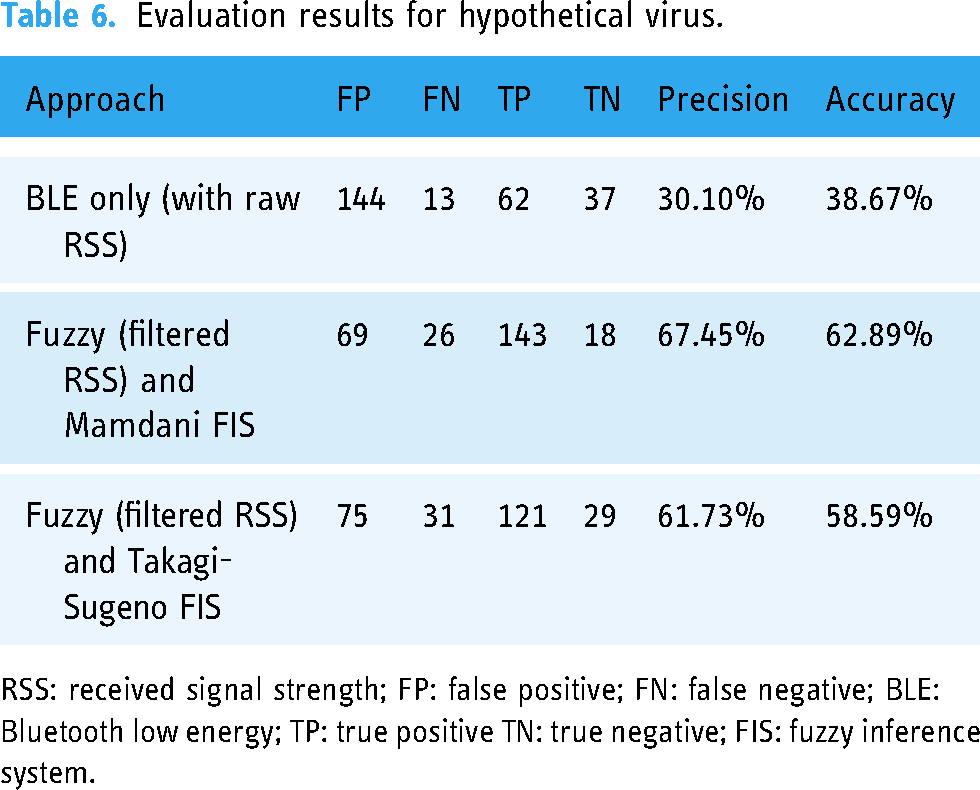
RSS: received signal strength; FP: false positive; FN: false negative; BLE: Bluetooth low energy; TP: true positive TN: true negative; FIS: fuzzy inference system.
These results indicate that the use of fuzzy logic with filtered RSS and Mamdani FIS can effectively reduce the FPs and improve the overall accuracy and precision of the system.
BLE was initially intended for communication, and its use as a proximity-sensing technique is relatively new. BLE transmissions are susceptible to interference from environmental factors, which include multipath, scattering, shadowing, and attenuation. As a result, measuring the exact length between two devices may be difficult especially when they are indoors. However, the acquired results demonstrated that the situation could be improved by using filtering techniques, which is the moving average in our case.
Discussion
This study presents a novel framework for evaluating and classifying personal exposure risk using BLE-based contact-tracing applications during the COVID-19 pandemic. The framework considers both contact features (such as distance and length of contact) and environmental features (such as crowd size and the number of recently infected cases in the environment).
We evaluated the proposed exposure risk assessment system using precision and accuracy measures. Four parameters were used: TP, TN, FN, and FP. We tested the system on 256 test instances with varying contact durations, crowd indices, and infection rates. The application used two settings for logging measurements: BLE-only and BLE with a fuzzy approach.
The results showed that the system had an accuracy of 37.89% and precision of 32.59% when BLE-only proximity sensing was used in the COVID-19 contact feature set. The system recognized 52 FPs and 45 FNs with over 62% accuracy and 72% precision using Takagi-Sugeno FIS. The data presented here suggests that fuzzy logic with filtered RSS and Mamdani FIS reduced FPs to 58, increasing the system's accuracy to 64.45% and precision to 71.98%. The data analysis reveals a relationship between estimated proximity data using the suggested method and an accuracy gain, which may result in identifying more FNs.
We tested the system with various close contact features to assess the scalability of the proposed method for potential epidemic diseases and its adaptability to virus variants and protocols. These protocols’ linguistic variables translate logically into 256 fuzzy rule sets. The results show improvements in both cases in terms of accuracy and precision, indicating that the suggested method is capable of handling different variants.
This research, however, is subject to several limitations. The first limitation is collecting RSSI measurements using a single device. As BLE transmissions are susceptible to interference from environmental factors, which include multipath, scattering, shadowing, and attenuation, it might be difficult to evaluate the impact of various mobile phone brands in different situations when observing the RSSI. Another limitation concerns considering additional environmental factors, such as ventilation and the role of walls in detecting false contacts.
Conclusions
In conclusion, the rapid spread of COVID-19 has resulted in the emergence of various mobile apps and research projects that are focused on DCT. However, most contact-tracing solutions only utilize raw RSSI values in order to estimate the users’ risk, which may lead to more contacts than necessary and result in unwarranted worrying and anxiety among the users.
This paper proposed a novel BLE-based contact-tracing approach that utilizes a fuzzy expert system in order to assess exposure risks by considering both contact characteristics and environmental features. Our empirical findings demonstrated that the proposed approach outperforms the current BLE-only methods in terms of accuracy and precision. The proposed method's ability to adjust contact and environmental features additionally makes it scalable for various potential epidemic diseases.
Future studies will involve considering additional environmental factors, such as ventilation and the role of walls in regard to detecting false contacts as well as intelligent lockdown suggestions based on geographical regions as opposed to political borders, such as a country or state.
This study's proposed method overall provides a practical and adaptable framework in regard to assessing the exposure risks in a more realistic manner, which could aid in order to develop more effective DCT applications and policies.
Footnotes
Acknowledgements
This work was supported in part by the ITRC Support Program under Grant IITP-2024-RS-2022-00156354, in part by the Metaverse Support Program to Nurture the Best Talents under Grant IITP-2024-RS-2023-00254529 funded by the Ministry of Science and ICT of Korea and the Institute of Information and Communications Technology Planning and Evaluation (IITP).
Declaration of conflicting interests
The authors declared no potential conflicts of interest with respect to the research, authorship, and/or publication of this article.
Ethical approval
Not applicable