
Abstract
Objective
Social anxiety disorder (SAD) is characterized by heightened sensitivity to social interactions or settings, which disrupts daily activities and social relationships. This study aimed to explore the feasibility of utilizing digital phenotypes for predicting the severity of these symptoms and to elucidate how the main predictive digital phenotypes differed depending on the symptom severity.
Method
We collected 511 behavioral and physiological data over 7 to 13 weeks from 27 SAD and 31 healthy individuals using smartphones and smartbands, from which we extracted 76 digital phenotype features. To reduce data dimensionality, we employed an autoencoder, an unsupervised machine learning model that transformed these features into low-dimensional latent representations. Symptom severity was assessed with three social anxiety-specific and nine additional psychological scales. For each symptom, we developed individual classifiers to predict the severity and applied integrated gradients to identify critical predictive features.
Results
Classifiers targeting social anxiety symptoms outperformed baseline accuracy, achieving mean accuracy and F1 scores of 87% (with both metrics in the range 84–90%). For secondary psychological symptoms, classifiers demonstrated mean accuracy and F1 scores of 85%. Application of integrated gradients revealed key digital phenotypes with substantial influence on the predictive models, differentiated by symptom types and levels of severity.
Conclusions
Leveraging digital phenotypes through feature representation learning could effectively classify symptom severities in SAD. It identifies distinct digital phenotypes associated with the cognitive, emotional, and behavioral dimensions of SAD, thereby advancing the understanding of SAD. These findings underscore the potential utility of digital phenotypes in informing clinical management.
Keywords
Introduction
Social anxiety disorder (SAD) is characterized by intense fear and avoidance of social situations, often accompanied by physical symptoms such as rapid heartbeat, sweating, and trembling.1,2 This anxiety often triggers negative thought patterns, resulting in self-doubt and compromised self-esteem during social interactions, which contribute to a perpetuating cycle of anxiety and avoidance. 3 Such patterns can severely disrupt daily activities and social relationships, leading to decreased quality of life, delayed medical treatment, and even exacerbation in social, academic, and occupational areas.4–6 Moreover, if left untreated, the risk for comorbid psychiatric conditions like depression and other anxiety disorders also increases.5,6 Given that SAD significantly impacts daily activities, maladaptive behaviors such as the avoidance of social settings and increased time spent at home can be quantitatively assessed through continuous monitoring.
In this context, digital phenotypes have emerged as valuable metrics for capturing one's behavioral and physiological patterns. Derived from data gathered through smartphones and wearable sensors, these digital phenotypes offer insights into the emotional and mental states experienced in daily life.7,8 In existing studies investigating the relationship between digital phenotypes and mental health, there are attempts to investigate linear relationships between digital phenotypes and mental states.9–11 However, the constraints of a linear approach can lead to an oversimplification of the intricate interactions between digital phenotypes and the levels of symptoms associated with mental health.
To overcome these limitations, machine learning techniques offer a powerful toolset for analyzing complex relationships. In particular, machine learning methods have been proposed for the analysis of mental disorders, and some studies have employed these methods to classify individuals based on digital phenotypes.12–15 Identifying latent features of digital phenotypes, low-dimensional representations using dimensionality reduction technique, which can simplify the complex dataset to facilitate better understanding. For using latent features, one of the techniques identifying the characteristic of data is latent class analysis, which focuses on categorical data. 16 Digital phenotypes include continuous values and are so complicated that dimensionality reduction techniques are inevitable for analysis. Autoencoders, a type of deep learning-based neural network, have shown promise in employing nonlinear compression and reconstruction to generate latent features that effectively represent the original data.17,18 This technique has been successfully applied in various medical domains, such as differentiating autism spectrum disorder through magnetic resonance imaging data, 19 depression through speech analysis, 20 and anxiety disorder through sleep-related digital phenotypes. 21
We identified two previous studies that applied machine learning techniques using digital phenotypes to predict the severity of SAD symptoms with validated psychological scales. One study utilized GPS data to predict levels of social anxiety, 22 while another study applied accelerometer and phone/text interactions for a similar objective. 23 However, these studies were limited by their reliance on nonclinical samples, specifically college students, and focused solely on the Social Interaction Anxiety Scale, which assesses primarily emotional aspects of social interaction anxiety. 24 Additionally, these analyses included only a select few behavioral traits as captured by digital phenotypes.
To address these issues, the present study conducts a comprehensive analysis encompassing cognitive, behavioral, and emotional symptoms related to SAD with a clinical sample. It leverages a series of machine learning models, each one designed to process and learn from a unique combination of digital phenotypes, such as GPS activity, phone call logs, and app usage metrics. Correspondingly, individual models are each designated to predict a particular symptom measurement, including levels of fear and avoidance of social situations, fear of negative evaluation by others, depression, and life satisfaction. By employing these predictive models on a dataset comprising individuals diagnosed with SAD as well as those from a healthy control group, enabling a comparative analysis across the severity groups.
With these in mind, this study postulates that autoencoders and feature representation learning techniques could provide a novel methodological framework for uncovering the latent characteristics of SAD. This enhanced understanding of symptom severity through digital phenotyping could, in turn, contribute to the development of more precise diagnostic and therapeutic protocols for SAD.
Methods
Participants and demographic characteristics
During the recruitment period from October 2021 to May 2023, a total of 88 Koreans, consisting of 49 patients with SAD and 39 healthy control (HC) participants living in Seoul or nearby areas, voluntarily applied to participate in the study through an outpatient clinic or online platforms. Eligibility for the SAD group required a previous diagnosis of SAD, and this diagnosis was confirmed using Diagnostic and Statistical Manual of Mental Disorders, Fifth Edition (DSM-V) criteria and a Mini-International Neuropsychiatric Interview (MINI) conducted by a clinical psychologist. Exclusion criteria for SAD group included the presence of substance and alcohol use disorders, brain injuries or neurological diseases, intellectual disabilities, left-handedness, or the presence of metallic implants in the body. HC participants had neither a psychiatric history nor current symptoms according to DSM-V criteria.
Among the recruited participants, four withdrew their consent to participate in the study, and 10 were disqualified due to measurement duration less than 2 weeks. Data were collected from the remaining participants, but data from 16 of these were excluded from analysis due to incomplete data across one or more types. Consequently, our study included a total of 58 participants, with 27 patients with SAD and 31 HC participants, with ages ranging from 19 to 49 years. Demographically, the SAD group had a mean age of 28.37 (SD 6.57) years, with 52% female, while the HC group had a mean age of 28.41 (SD 7.34) years, with 58% female (detailed demographics in Table 1). Statistical tests revealed no significant differences in age (t56 = 0.03, P = .98) and sex (
Participant demographics (N = 58).

GAD: Generalized Anxiety Disorder; HC: healthy control; MDD: major depressive disorder; N/A: not applicable; OCD: obsessive compulsive disorder; PD: panic disorder; PDD: persistent depressive disorder; SAD: social anxiety disorder.
All participants submitted written informed consent to participate in the study before installing a custom-developed app on their smartphones. They were informed that they could withdraw from the study at any point, and that data collection could be terminated at their discretion by uninstalling the app. This study protocol was approved by the institutional review board of Yonsei University Gangnam Severance hospital.
Data collection
Various types of behavioral and physiological data were collected from participants over a period ranging from 7 to 13 weeks (mean, 8.5; SD, 1.8). Digital phenotype data were automatically collected through a noncommercial app (‘HAID’, Waysen Co., Ltd), developed by our research team and installed on the participants’ own Android smartphone and a commercial smart band (‘DOFIT’, Medi Plus Solution Co., Ltd) provided to them. All participants stayed in South Korea during the data collection period, and thus there was no disruption to data collection.
To assess the severity of symptoms in SAD, participants reported on self-report psychological scales once every 2 weeks, facilitating an in-depth analysis of the utility of digital phenotypes. As social anxiety-specific scales, the Liebowitz Social Anxiety Scale (LSAS) 25 with fear and avoidance subfactors was used to assess the emotional and behavioral aspects of social anxiety, and the Brief Fear of Negative Evaluation Scale (BFNE) 26 was used to measure the cognitive dimension, specifically the fear of negative evaluation by others. Additionally, secondary psychiatric symptom measurements included the Hospital Anxiety and Depression Scale, 27 Generalized Anxiety Disorder-7, 28 Panic Disorder Severity Scale (PDSS), 29 Maudsley Obsessive Compulsive Inventory, 30 Penn State Worry Questionnaire (PSWQ), 31 State-Trait Anxiety Inventory, 32 and Satisfaction with Life Scale (SWLS). 33 We confirmed the copyright of all tools and psychological scales used in the study.
Extraction of digital phenotype data
As shown in Table 2, there were eight distinct types of digital phenotype data, from which 76 features were extracted to represent the participants’ underlying behavioral and physiological patterns. These phenotypes were extracted at 2-week intervals, with a 1-week overlap between consecutive segments (e.g. weeks 1–2, weeks 2–3, etc.) to effectively capture transitions in behavioral and physiological patterns over time. Nonlinear imputation called K-Nearest Neighbors Algorithm
34
was applied to fill in the remaining missing data. Finally, the analysis included 511 overlapping 2-week segments. Table S1 in Supplemental Appendix presents the number of samples in each participant.
App usage: We quantified app usage based on logs, calculating metrics over a 2-week span including the total duration of app usage (i.e. sum of usage), the average time per session (i.e. mean of usage), and the frequency of app sessions (i.e. number of usage). Data were classified into 10 categories based on their primary function to investigate their impact on symptom severity. Phone usage: Data on interactions with the phone were extracted from phone logs. Metrics such as total phone usage duration over 2 weeks (i.e. sum of on-time), average time per interaction (i.e. mean of on-time), and the frequency of phone interactions (i.e., number of on-time) were calculated. Call patterns: Call logs were analyzed to understand interactions with other individuals. Metrics including total call duration, maximum duration of a single call (i.e. call max at one time), the number of unique individuals called (i.e. number of people), frequency of calls (i.e. number of call), missed call ratio, incoming-to-outgoing call ratio (i.e. in–out ratio), and variability in call duration (i.e. call entropy) were calculated. These metrics were gathered for both incoming and outgoing calls. Movement patterns: Spatial behavior was ascertained via GPS data. Metrics such as the diversity of locations visited (i.e. local variance), regularity of movement (i.e. circadian movement), speed, total distance covered (i.e. distance), the number of unique locations visited (i.e. cluster number), diversity in time spent at locations (i.e. location entropy), duration spent at home (i.e. home stay ratio), and transition times (i.e. transition ratio) were computed. Environmental patterns: Given the correlation between anxiety disorders and environmental factors like noise and light,35,36 we measured ambient noise and brightness levels. The 2-week average levels of ambient noise and brightness were calculated. Recognizing the differential impact of light during daytime and nighttime, we also computed the average light levels during these respective periods (i.e. daytime and nighttime). Physiological patterns: Physiological metrics such as the heart rate, sleep duration, and sleep latency were measured. The average heart rate in beats per minute over a 2-week span was calculated. Sleep metrics were derived from gyroscope and lux log data; specifically, sleep onset and wake times were inferred from sharp changes in light levels and movements.
37
Sleep latency was calculated as the time lapse between the moment the light was turned off and the onset of sleep. The 2-week averages for sleep duration and latency were computed.
Data and digital phenotype descriptions.

SNS: Social Network Service; OTT: over-the-top media service; GPS: Global Positioning System.
lat: latitude; long: longitude; σ: variance of latitude and longitude values.
f: least-squares spectral analysis (the Lomb-Scargle method); psd: the power spectral density.
t: time point.
daytime: sunrise to sunset; nighttime: sunset to sunrise.
Model development and evaluation
We designed and evaluated models to classify the levels of clinical symptoms by leveraging characteristics identified within digital phenotypes over a 2-week period. In these models, the digital phenotype data were paired with symptom measurement scores in a cross-sectional manner for the purpose of model training. The models comprised three primary components: an autoencoder tasked with capturing the underlying structure of digital phenotypes (Figure 1a), symptom severity classifiers that utilize latent features as inputs extracted by the autoencoders (Figure 1b), and integrated gradients (IGs) that assess the contributions of digital phenotypes to the prediction of symptom severity (Figure 2a).
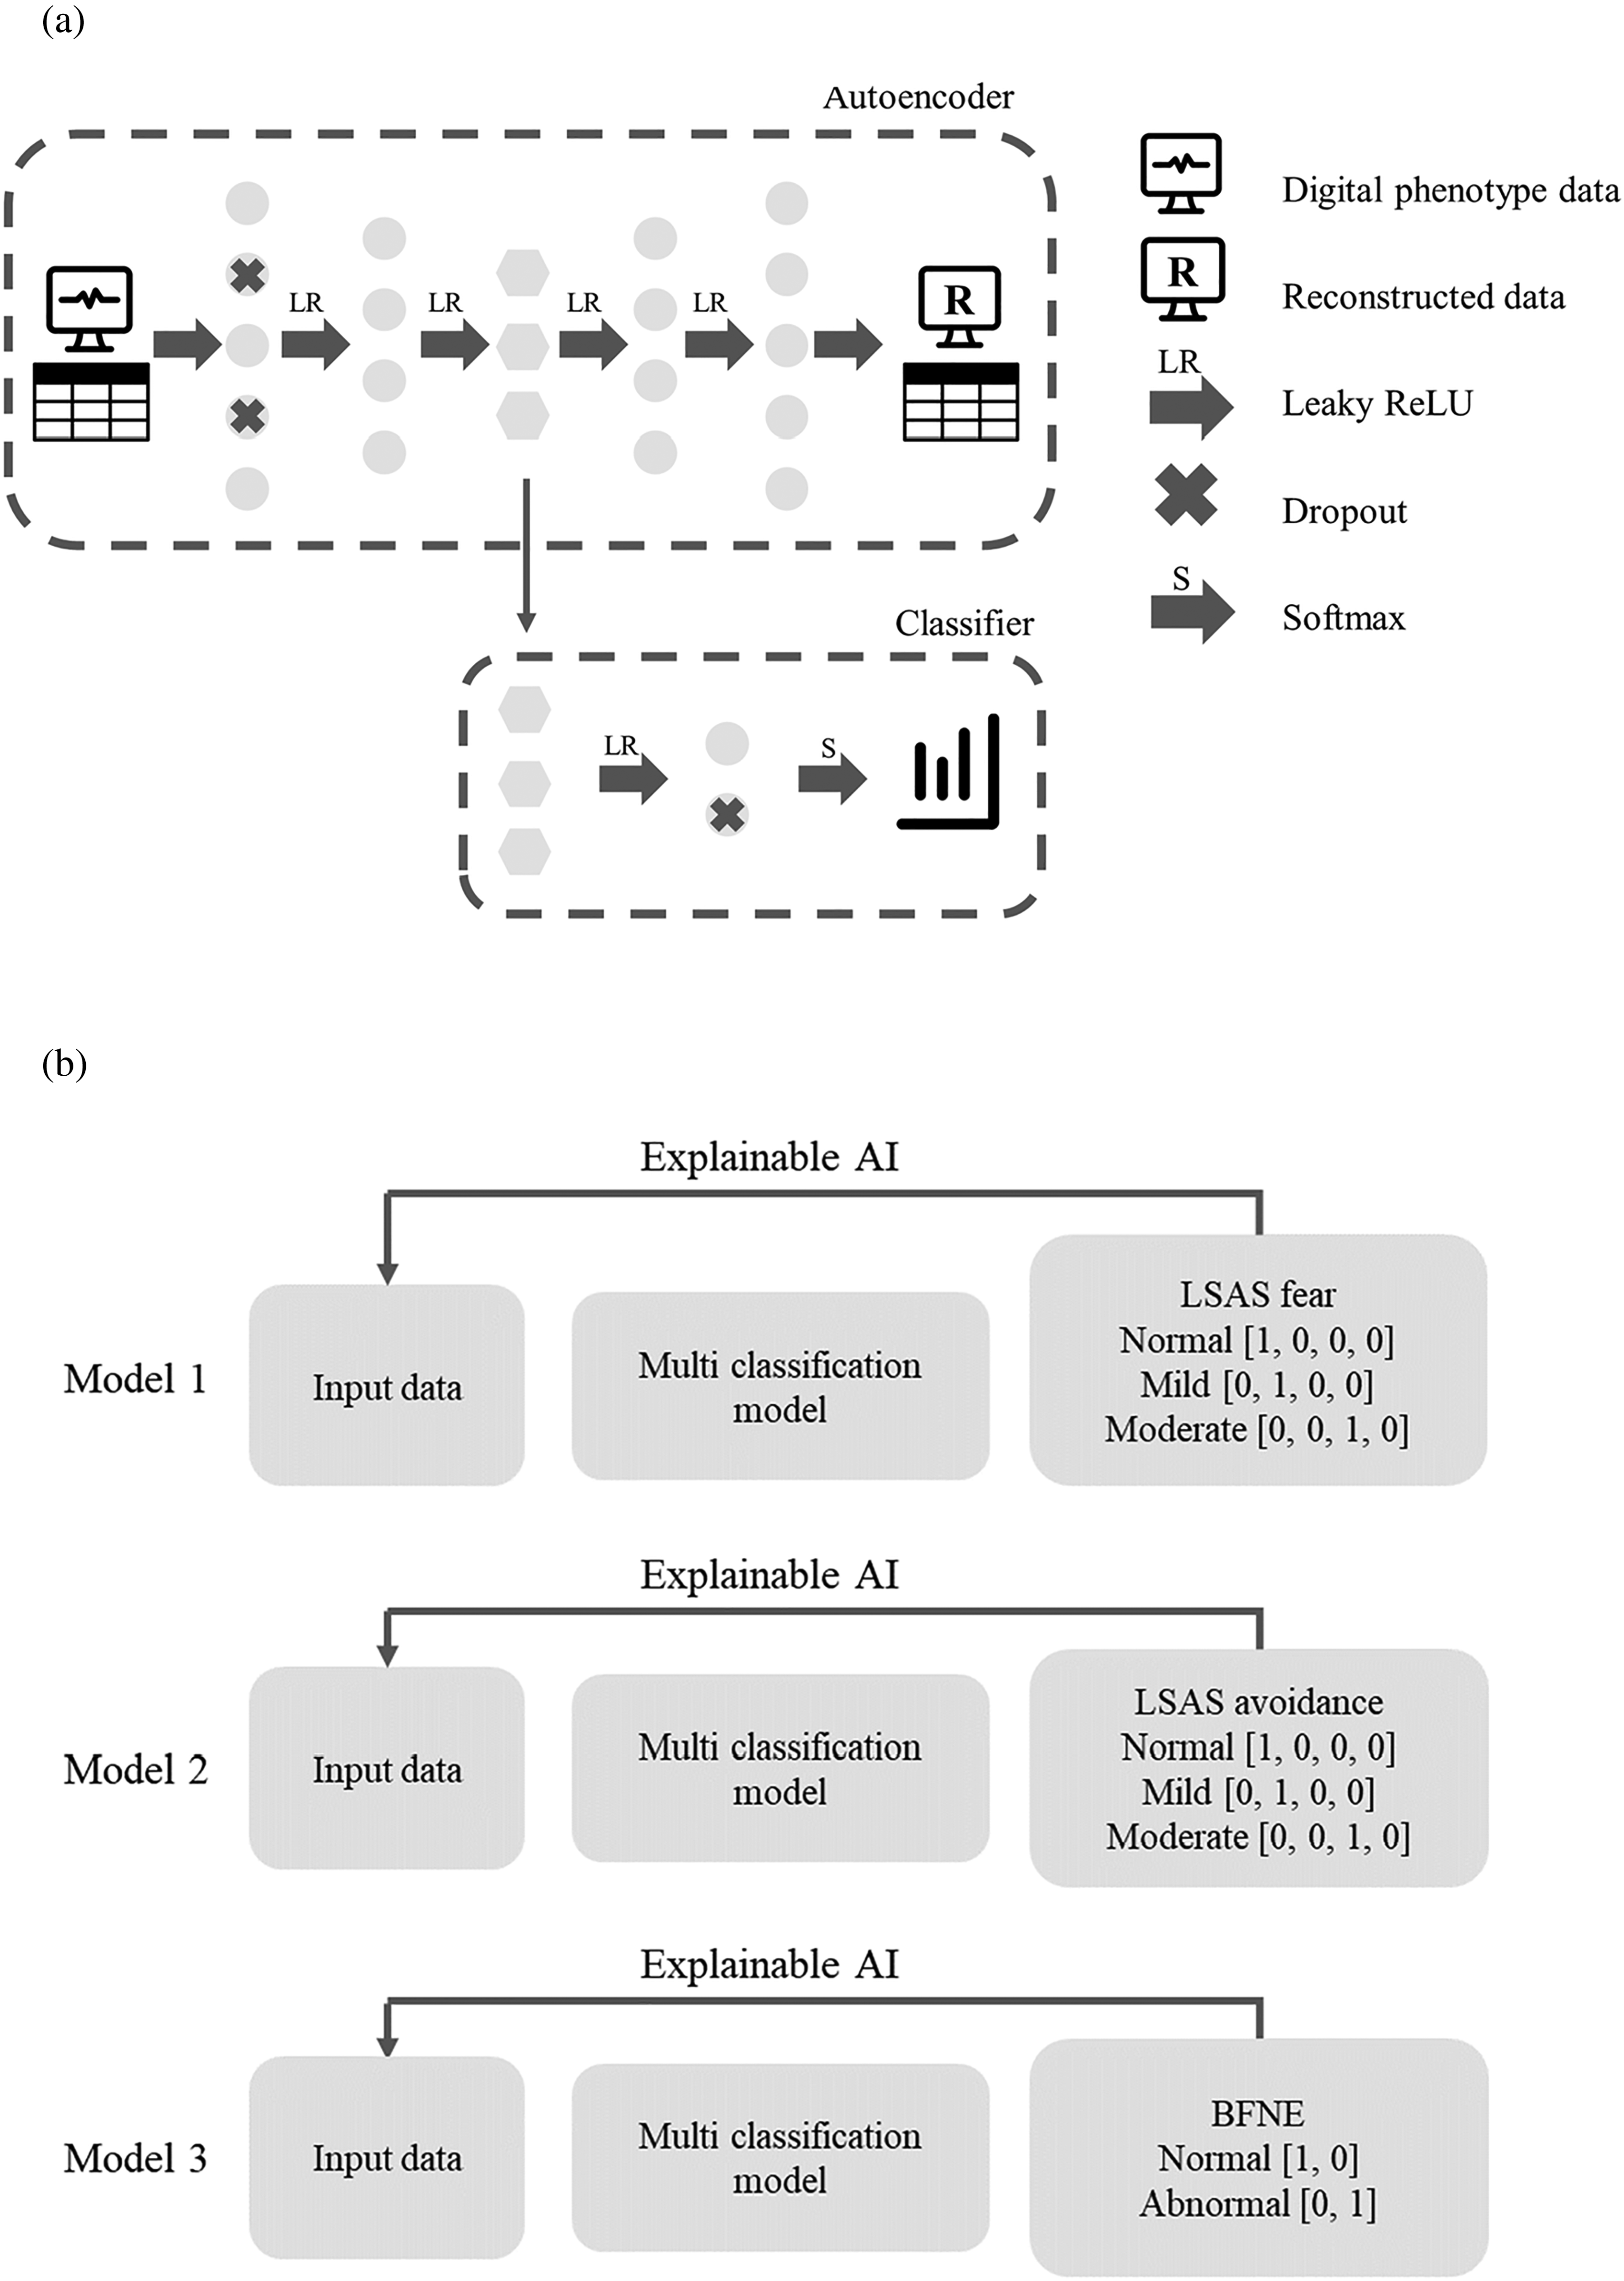
Symptom severity classification using the autoencoder-based feature representation. (a) Schematic of the autoencoder model. The autoencoder model learns latent features of the digital phenotype, and the classifier predicts symptom severity using these latent features. (b) The schema of the classification model for each questionnaire. The predicted output of each model is interpreted using an explainable AI technique.

The attribution of digital phenotype using the integrated gradient technique. (a) The integrated gradient technique computes the attribution of the input in predicting the output. It achieves this by averaging the contributions as the intensities of the input changes. (b) The attribution of digital phenotypes by social anxiety disorder symptom measurements using integrated gradients. Effects estimated by symptom severity class based on the social anxiety disorder symptom measurements models. (c) Comparative plots showing the attribution of digital phenotypes to secondary psychiatric symptom measurements.
Architecture of the autoencoder model
Using an autoencoder, latent features were generated from digital phenotype. The autoencoder model is defined as follows:


Architecture of the classifier model
The scores of the self-report scales were categorized based on established cut-off values (Table 3). These categorical classifications of symptom severity were implemented to perform an analysis that takes into account the current clinical framework used to recommend specific therapies.40,41 See Table S2 in Supplemental Appendix for detailed descriptions of the severity levels.
Symptom measurement scales.

BFNE: Brief Fear of Negative Evaluation Scale; GAD-7: Generalized Anxiety Disorder-7; HADS: Hospital Anxiety and Depression Scale; LSAS: Liebowitz Social Anxiety Scale; MOCI: Maudsley Obsessive Compulsive Inventory; PDSS: Panic Disorder Severity Scale; PSWQ: Penn State Worry Questionnaire; STAI: State-Trait Anxiety Inventory; SWLS: Satisfaction with Life Scale.
The architecture of the classifiers was designed to predict multiple severity classes, as delineated by various questionnaires that a range of two to four classes (see Figure 1b for the schema of models and Tables S3 in Supplemental Appendix for score distributions). In this model, latent features in the hidden representation layer h were used to classify symptom severity. The classifier model is defined as follows:

IGs for model explanation
To elucidate the role of each digital phenotype in predicting symptom severity, we employed the IGs method for interpretability.
42
This technique quantifies the contribution of individual input variables—in our case, digital phenotypes—to the model's predictions (i.e. symptom severity classes). In particular, the IG for the ith neuron is mathematically expressed as: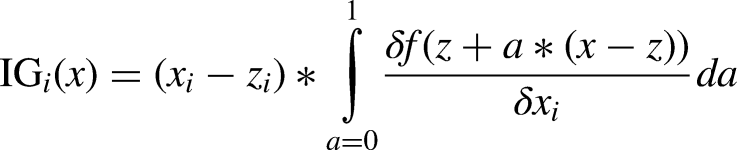

Assessment of digital phenotypes and statistical analysis
In pursuit of a comprehensive understanding of the digital phenotypes and their cognitive, emotional, behavioral, and physiological relationships through diverse scales for the target groups, our analysis was guided by three primary objectives. Initially, we assessed the values of IG to understand how digital phenotypes contribute to predictions across diverse symptoms. Subsequently, we identified key variables that characterize each severity level, focusing on variables with the largest absolute IG values, as outlined in previous reports.43–45 Within this framework, we further concentrated on comparing the top three variables in each model, placing a particular emphasis on SAD symptom measurements. Finally, we validated the discriminatory power of the predicted results through statistical tests (t-tests or analysis of variance (ANOVA), as appropriate) for IG values across severity levels for each digital phenotype. To correct for multiple comparisons and control the false discovery rate (FDR), we employed the Benjamini-Hochberg procedure. 46
Results
Evaluation of classification model performance
We generated latent features of digital phenotype from an autoencoder model, which demonstrated a significant correlation between the original and reconstructed digital phenotypes across the participants (mean r = 0.98, SD = 0.02; P < .001; Figure S1 in Supplemental Appendix). The predictive models exhibited substantial accuracy in classifying severity of SAD symptom measurements, with results notably exceeding the baseline predictive accuracies within a range from 84% to 90% (Table 4). Furthermore, models for secondary psychiatric symptom measurements also yielded notable accuracies. For instance, the PSWQ model demonstrated an accuracy approximately 34% higher than baseline, and the PDSS model achieved the highest classification accuracy at 93% (Table 5). Moreover, when comparing the main model with five neural network models and one random forest classifier, the main model stood out, demonstrating superior performance across a variety of questionnaires (Tables S4–S9 in Supplemental Appendix).
Prediction results of social anxiety symptom severity class.

The baseline accuracy is a prediction only of the majority class.
The accuracy is an average of cross-validation results.
BFNE: Brief Fear of Negative Evaluation Scale; LSAS: Liebowitz Social Anxiety Scale.
Prediction results of secondary psychiatric symptom measurements severity class.

The baseline accuracy is a prediction only of the majority class.
The accuracy is an average of cross-validation results.
.
GAD-7: Generalized Anxiety Disorder-7; HADS: Hospital Anxiety and Depression Scale; MOCI: Maudsley Obsessive Compulsive Inventory; PDSS: Panic Disorder Severity Scale; PSWQ: Penn State Worry Questionnaire; STAI: State-Trait Anxiety Inventory; SWLS: Satisfaction with Life Scale.
Outlining digital phenotypes across severity levels using IG
We employed the IG technique to identify digital phenotypes that affect the predictive outcomes in the hidden layer (Figure 2a). As a result, opposite directional attributions were observed depending on symptom severity. Specifically, in the context of questionnaires related to social anxiety symptom, we observed that lower levels of symptom severity were primarily associated with negative or near-zero IG values for variables such as communication, entertainment, and shopping app usage, along with home stay duration, transition duration, average heart rate, and night ambient brightness (i.e. lux night). Conversely, circadian movement, number of places visited (i.e. stationary state number), location entropy, and sleep duration showed higher positive values. Importantly, these directions are often reversed at high symptom severity (Figure 2b).
Furthermore, similar trends were observed in IG values of digital phenotypes to severity predictions across secondary psychiatric symptom measurements. When lower symptom severities, negative IG values predominantly were associated with missed call ratio, home stay duration, transition duration, average heart rate, and lux night. Conversely, positive IG values were linked to the distinct number of incoming calls, circadian movement, and the number of stationary states. Simultaneously, under conditions of higher symptom severity, a tendency was observed for the direction of the IG values to be opposite to those observed at lower symptom severity levels (Figure 2c).
Ranking key digital phenotypes by absolute IG within severity levels
We evaluated the most influential digital phenotypes in predicting symptom severity by focusing on the top three features with the largest absolute values of IG. For the LSAS-fear scale that includes normal, mild, and moderate classes, home stay duration was a major contributor in both moderate and mild classes, while exhibiting opposite directional attribution. Notably, normalized location entropy was a major contributor to the prediction of moderate class. Unique to the mild class was camera number of usage, while the distinct number of incoming calls and location entropy were notable for the normal class. Across all severity levels, circadian movement was a consistent predictor (Table 6).
Comparison of key features’ integrated gradient values across severity levels for the LSAS-fear scale (the italicized integrated gradient values are top three features indicative of a specific severity level).
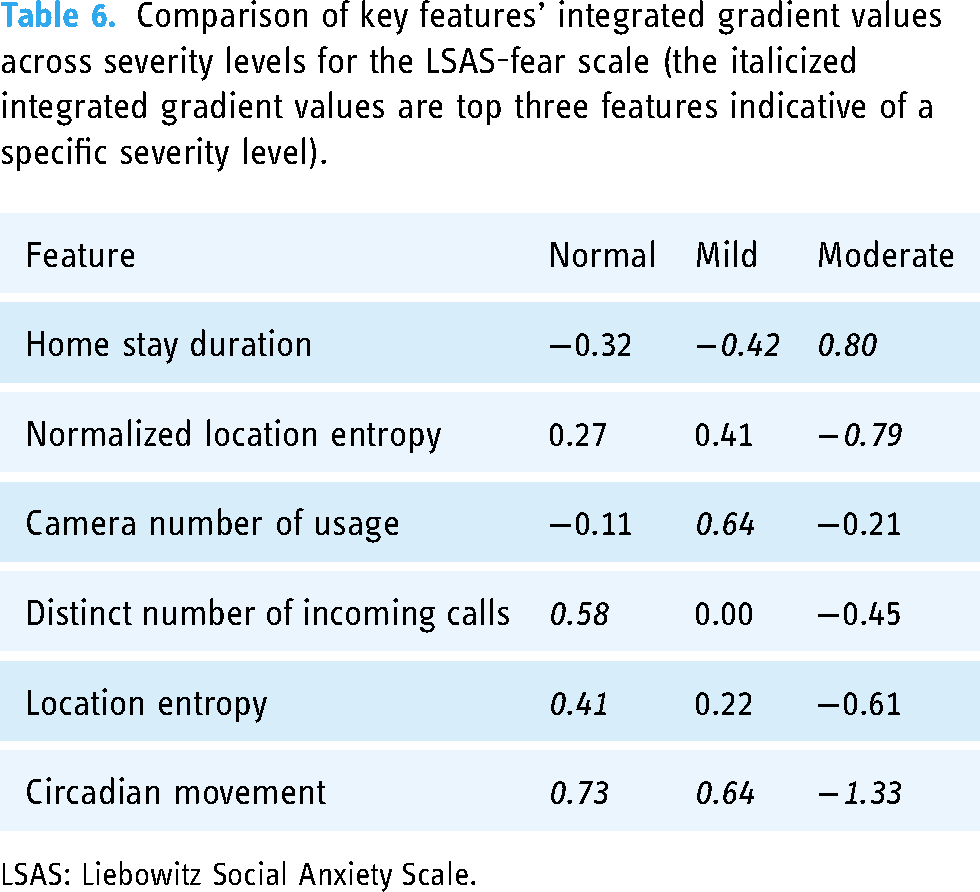
LSAS: Liebowitz Social Anxiety Scale.
In the predictive model for the LSAS-avoidance scale, which includes normal, mild, and moderate classes, the duration of entertainment app usage and heart rate were crucial factors in predicting moderate class. For both mild and normal classes, time spent at home and ambient noise level were key variables, while indicating opposing attribution. Unique to the mild class was frequency of smartphone usage. Circadian movement served as a main predictor for both normal and moderate classes (Table 7).
Comparison of key features’ integrated gradient values across severity levels for the LSAS-avoidance scale (the italicized integrated gradient values are top three features indicative of a specific severity level).

LSAS: Liebowitz Social Anxiety Scale.
In the predictive model for the BFNE scale, which consist of normal and abnormal classes, circadian movement and ambient brightness during nighttime emerged as consistently important features for both classes; however, these variables exhibited opposite directional attribution depending on the class. In addition, while mean sleep duration served as an important predictor in the normal class, the duration of communication app usage emerged pivotal for predicting the abnormal class (Table 8).
Comparison of key features’ integrated gradient values across severity levels for the BFNE scale (the italicized ig values are top three features indicative of a specific severity level).

BFNE: Brief Fear of Negative Evaluation Scale.
Validating discriminative power of digital phenotypes across severity classes
We investigated the discriminatory power of digital phenotypes, using IG maps, to differentiate among levels of symptom severity by conducting t tests and ANOVA. For questionnaires categorizing symptom severity into two classes such as BFNE, PDSS, and SWLS, two-tailed t tests were applied. In contrast, for scales with multiple classes, ANOVA was employed. The analysis, following FDR correction, revealed statistically significant differences (adjusted P < .001) among the top 10 digital phenotypes across symptom severity classes, including key digital phenotypes, within SAD symptom measurements (Figure 3a). These phenotypes include app usage (i.e. shopping categories), call patterns (i.e. distinct number of incoming calls and number of call mean), movement patterns (i.e. circadian movement, entropy, duration of home stay, and transition duration), and physiological indicators (i.e. average heart rate). Furthermore, these distinctions were consistent across secondary psychiatric symptom measurements, thereby reinforcing the validity and efficacy of these digital markers for severity classification in mental health conditions (Figure 3b).

Differences in integrated gradients of digital phenotypes across symptom severity levels. (a) Differences in the effects from integrated gradients of digital phenotypes across social anxiety symptom severity, plotted with FDR corrected multiple comparisons (P < .001). (b) Comparative plots of integrated gradients across secondary psychiatric symptom severity. Multiple comparisons were corrected using FDR (P < .001). FDR: false discovery rate.
Discussion
Our study advances the utility of digital phenotyping as a predictive tool for assessing symptom severity in SAD. Utilizing digital phenotypes, we were able to classify diverse symptom severities based on autoencoders for feature representation, thus demonstrating the digital phenotypes’ discriminative ability. This aligns with existing research that showed the potential of digital phenotyping in healthcare, 12 specifically in understanding complex behaviors within clinical settings.47,48 Crucially, our models demonstrated high classification accuracy not only for symptoms of social anxiety but also across a spectrum of co-occurring mental states, such as depression, general anxiety or worry, panic attacks, obsession, and life satisfaction, thereby emphasizing the expansive potential of digital phenotyping in the characterization of various mental health conditions.
Addressing the challenge of model interpretability inherent in neural networks,49,50 we employed IGs. This technique helped us identify key contributing digital phenotypes for predicting symptom severity, solving the model's intricate combinations of nonlinearities.42,51–54 By discerning variations in digital phenotypes that are predictive of differing symptom levels and severities, we extended existing studies that have demonstrated the importance of behavioral, physiological, and social patterns as indicators of symptom severity.55–58 A crucial consideration in these predictions concerns the temporal dynamics between feature extraction for digital phenotypes and symptom measurement. Our model design assumed no time lag between symptoms and phenotypes and posited that digital phenotypes could reflect symptom levels within a 2-week time window. However, digital phenotype data were to encompass the 2-week period prior to symptom assessment of 2-week intervals. A 50% overlap of segments in the extraction of digital phenotype features resulted in a discrepancy in frequency between assessment and symptoms. To bridge this gap, we applied an interpolation method to symptom scores, but there was still a difference in frequency. Additionally, different symptoms and behaviors have different timescales. For example, heart rate and limited mobility are expected to have different temporal correlations with anxiety. Therefore, it is inevitable that fixed time lags and windows across all phenotypes have a potentially negative impact on model performance. Even taking this inevitability into account, there is evidence that a 2-week period is within the acceptable range for the relationship between digital phenotypes and psychiatric symptoms. As an example, Stamatis et al. in a recent study found an optimal temporal relationship between circadian movement and depressive symptoms, which was specifically within a 2-week time window and with no time lag. 59 Although the temporal dimensions were not incorporated into the model due to the cross-sectional design of our study, designing a model that accounts for these dimensions by predicting future symptoms from features identified at a specific time60,61 can be a useful approach to demonstrating the model's actual predictive ability.
Autoencoders extract representation features, which successfully create interpretability by capturing the essence of the original data, and low-dimensional representation techniques using autoencoders make it possible to simplify the understanding of complex datasets.62,63 The use of these techniques allowed us to observe specific patterns in digital phenotypes that related to symptom severity. For example, individuals with higher severity levels in overall trends tended to spend more time without contact with others compared to lower severity levels. In addition, circadian movement, calculated as movement regularity over a 2-week period, was a key predictor across multiple severity levels and various scales, ranging from anxiety and depression to life satisfaction. This finding is consistent with several previous reports that have supported the role of circadian movement as a significant indicator of mental health states. For instance, Velten et al. 64 found a relationship between the regularity of daily activities such as sleep and eating and mental states including life satisfaction, depression, and anxiety. Saeb et al. 65 discovered the relationship between the regularity of GPS movement patterns and depression. Difrancesco et al. 66 showed that circadian rhythm and physical activity based on sleep time and activity levels were correlated not only with depression but also anxiety.
Focusing on the emotional dimensions of social anxiety, it is evident that limited mobility patterns play a meaningful role in predicting high levels of social anxiety. An increase in time spent at home and limited geographic range of activities could serve as behavioral indicators of fear related to social exposure. Notably, normalized location entropy stood out as a prominent factor solely in the LSAS-fear model when predicting moderate class, suggesting its potential utility in reflecting behavioral characteristics associated with social anxiety. In contrast, active interaction patterns through phone calls and geographical diversity in location visits were crucial in predicting normal levels of social anxiety.
Regarding avoidance behaviors in social interactions, particularly for the moderate severity class, substantial contributory factors included elevated heart rate and increased use of entertainment apps, as revealed by the analysis. Supporting a previous study that highlighted a correlation between heart rate and levels of social anxiety in real-world settings, 67 our findings suggest that heart rate could serve as a more accurate marker for assessing high levels of social anxiety, particularly its avoidance behaviors. Similarly, the increased use of entertainment apps could signify an avoidance strategy to cope with elevated anxiety levels. Prior research indicates that individuals with high social anxiety tend to use the internet more to avoid social interactions and cope with loneliness. 68 Intriguingly, avoidance behaviors associated with social anxiety can manifest not only through the avoidance of physical social situations but also through increased use of apps,69,70 such as those for entertainment, which are not primarily motivated by the purpose of social interaction but rather facilitate content consumption in a unidirectional manner. 71 Furthermore, for the mild severity class, characterized by partial avoidance tendencies, key predictors included longer home stays, reduced social exposure, and frequent smartphone usage—collectively serving as markers of social isolation. Conversely, for individuals with normal severity levels, frequent exposure to diverse social settings and increased durations outside the home predicted more adaptive behavioral patterns in response to social situations.
Transitioning to the cognitive aspects of social anxiety, specifically the fear of negative evaluation in social interactions, circadian movement and nighttime ambient brightness emerged as noteworthy indicators for both normal and abnormal severity classes. This observation aligns with the study of Lyall et al., 72 who demonstrated that disruptions in circadian rhythms could lead to various adverse mental health outcomes. Similarly, findings from our study reveal that nighttime ambient brightness may be associated with fear of negative evaluation in social situations. Intriguingly, the duration of communication app usage emerged as a pivotal predictor specifically when the severity of symptoms was pronounced. Previous studies have shown that communication skills are important in predicting mental illnesses.73,74 Our observation on the use of communication apps may be related to the cognitive model proposed by Clark and Wells. 75 According to this model, cognitive characteristics of social anxiety encompass excessive self-monitoring and adherence oneself to perfectionist standards during social performances, such as the need to be positively evaluated by everyone in social situations. This model was empirically supported not only in face-to-face interaction situations related to social anxiety, but also in online interaction settings. 70 Importantly, these cognitive factors, measured by the BFNE, are recognized to prolong task performance time. 76 Therefore, this finding suggests that the extended duration of communication apps, especially those involving interaction with others, may be associated with high levels of cognitive symptoms related to social anxiety. Furthermore, the duration of communication app usage was identified as a key feature in predicting cases categorized as moderate obsession/compulsion and dissatisfaction (Tables S10 and S11 in Supplemental Appendix). This aligns with a previous study that identified a negative relationship between SNS usage duration and life satisfaction. 77
In the broader context of this study, the findings hold significance in identifying neurotic traits and digital phenotypes that are specific to various levels of symptom severity in SAD. In addition, this suggests their potential utility in diagnosis and management. The prevailing diagnostic frameworks for psychiatric disorders largely rely on clinician-conducted interviews and self-report scales. Complementing this, the incorporation of behavioral and physiological metrics obtained from digital phenotypes could offer an enriched contextual basis for diagnostic assessments in SAD. From a therapeutic perspective, our results may give insights for targeted interventions in key digital phenotypes depending on the severity of symptoms. Intervention can be customized by focusing on key variables that highly contribute to predicting symptom severity, including strategies for behavior modification. For instance, traditional exposure therapy for avoidance behaviors that contribute to maintaining78,79 and exacerbating 68 social anxiety symptoms has focused on direct interpersonal situations, but incorporating behavior modification strategies for the use of entertainment apps as a coping mechanism may offer a valuable treatment approach for social anxiety.
Limitations
Despite the contributions of this study to the field of digital phenotyping in psychiatric disorders, several limitations warrant mention. First, it must be acknowledged that the final analyzed data of 58 participants was a rather small sample size in digital phenotype analysis. More statistical power could have been obtained if the analysis had been conducted by collecting data from a larger number of participants based on a method recently presented in the literature on determination of appropriate sample size in smartphone-based digital phenotyping studies such as ours. 80 In addition, the combining of data from both SAD and HC groups, with unequal sample sizes across severity classes, may make findings not fully representative of characteristics of either group. While the inclusion of a control group enhances the generalizability of the study, it also underscores the necessity for more targeted future research. Second, although the categorical classifications of symptom severity were implemented to perform the analysis reflecting the current clinical frameworks used to recommend specific therapies, transforming continuous symptom scores into categorical level might oversimplify the subtle variations in symptom severity. Third, since our research was based on technologies that utilize artificial intelligence, inherent biases such as training data bias, algorithmic bias, and cognitive bias might affect the results. The representation learning approach only assesses indirect data contributions, necessitating future research on direct influences from latent features. Additionally, although the predictive models are tested through sensitivity analysis, no such analysis was conducted for the feature importance scores. Consequently, the reported importance of these features is primarily exploratory and necessitates additional validation. Given that there are separate datasets to train and test the model, a subset of the available datasets may be affected by bias, and thus we adopted cross-validation to mitigate bias affecting the results, but the existence of overfitting still remains a problem. Finally, the scope of comparative analysis is restricted to three variables for interpretability, potentially omitting less critical yet still meaningful predictors.
Conclusion
In this study, we have demonstrated the efficacy of digital phenotypes for classifying symptom severities in SAD by leveraging feature representation learning. We uncovered distinct digital phenotypes associated with the cognitive, emotional, and behavioral dimensions of the disorder. These findings, which emerged from an analysis of digital phenotypes, lay the groundwork for a more comprehensive understanding of SAD and open up potential applications for managing symptoms through digital behavioral modifications. Building upon these insights, further randomized controlled trials are warranted to establish the causal relationships between key digital phenotypes and symptomatology of SAD, which holds the potential to significantly improve intervention strategies.
Supplemental Material
sj-docx-1-dhj-10.1177_20552076241256730 - Supplemental material for Multiclassification of the symptom severity of social anxiety disorder using digital phenotypes and feature representation learning
Supplemental material, sj-docx-1-dhj-10.1177_20552076241256730 for Multiclassification of the symptom severity of social anxiety disorder using digital phenotypes and feature representation learning by Hyoungshin Choi, Yesol Cho, Choongki Min, Kyungnam Kim, Eunji Kim, Seungmin Lee and Jae-Jin Kim in DIGITAL HEALTH
Footnotes
Acknowledgements
We thank Bohyun Park and Soomin Kim for their partial participation in data collection.
Contributorship
HC and YC drafted this article. YC, EK, and SL supervised the data collection. CM and KK provided supervision for the entire project and helped draft the manuscript. HC and CM provided support for data analysis. JJK was principal investigator for the project. All authors read and approved the final version of the manuscript.
Declaration of conflicting interests
The authors declared no potential conflicts of interest with respect to the research, authorship, and/or publication of this article.
Ethical approval
Ethics approval was obtained from the institutional review board of Yonsei University Gangnam Severance hospital (3-2021-0267).
Funding
The authors disclosed receipt of the following financial support for the research, authorship, and/or publication of this article: This work was supported by the National Research Foundation of Korea (NRF) grant funded by the Korea government (MSIT) (grant 2021M3E5D9025019).
Guarantor
JJK.
Supplemental material
Supplemental material for this article is available online.
References
Supplementary Material
Please find the following supplemental material available below.
For Open Access articles published under a Creative Commons License, all supplemental material carries the same license as the article it is associated with.
For non-Open Access articles published, all supplemental material carries a non-exclusive license, and permission requests for re-use of supplemental material or any part of supplemental material shall be sent directly to the copyright owner as specified in the copyright notice associated with the article.