
Abstract
Objective
Malnutrition is prevalent among cancer patients, smartphone-based self-administered nutritional assessment tools offer a promising solution for effective nutritional screening. This study aims to retrospectively analyze the relationships between nutritional status evaluated by the digital tool (R+ Dietitian) and clinicopathologic factors of cancer patients.
Methods
Cancer patients who met the inclusion criteria were divided into two subgroups based on age, Nutritional Risk Screening-2002, Patient-Generated Subjective Global Assessment Short Form, body mass index, and hospital stays for comparison. Correlation and regression analysis were used to comprehensively assess the relationship between nutritional status and clinicopathologic factors.
Findings
A total of 535 hospitalized cancer patients (58.32 ± 11.24 years old) were recruited. Patients identified with nutritional risk assessed by R+ Dietitian were significantly older, had lower body weight, lower body mass index, greater weight loss, and longer hospital stays (all of above, P < 0.01). Multiple logistic regression analysis indicated that serum prealbumin concentration (odds ratio: 0.992, 95% confidence interval: 0.987–0.997, P = 0.001), weight loss (odds ratio: 7.309, 95% confidence interval: 4.026–13.270, P < 0.001), and body mass index < 18.5 (odds ratio: 5.882, 95% confidence interval: 2.695–12.821, P < 0.001) predicted nutritional risk indicated by Nutritional Risk Screening-2002 score ≥3. Hemoglobin concentration (odds ratio: 0.983, 95% confidence interval: 0.970–0.996, P = 0.011), weight (odds ratio: 1.111, 95% confidence interval: 1.056–1.169, P < 0.001), weight loss (odds ratio: 7.502, 95% confidence interval: 4.394–12.810, P < 0.001), body mass index (odds ratio: 0.661, 95% confidence interval: 0.564–0.775, P < 0.001), and energy intake (odds ratio: 0.996, 95% confidence interval: 0.995–0.997, P < 0.001) predicted nutritional risk indicated by Patient-Generated Subjective Global Assessment Short Form score ≥4. Multiple linear regression analysis revealed that Patient-Generated Subjective Global Assessment Short Form scores ≥3 (b = 2.032, P = 0.008) were significantly associated with longer hospital stays.
Conclusions
The nutritional risks assessed by R+ Dietitian accurately reflected the characteristics of malnutrition in cancer patients and predicted hospital stay and cost, indicating the applicability of R+ Dietitian to improving the efficiency of nutritional management for cancer patients.
Keywords
Introduction
Cancer is one of the leading causes of global mortality and the burden of diseases, resulting in nearly 10.0 million cancer-related deaths and 250 million disability-adjusted years annually.1,2 Projections suggest that the worldwide cancer burden will persist in its upward trajectory over the next 50 years.3,4 This surge is anticipated to disproportionately affect low to middle-income countries, which often have limited access to medical resources. 5
Ensuring adequate nutrition is of paramount importance in enhancing the overall health outcomes of hospitalized oncology patients. However, malnutrition is prevalent among the majority of cancer patients, often due to disease progression and the intolerable side effects of therapies.6,7 Studies have consistently shown that suboptimal nutritional status is linked to extended hospital stay, diminished treatment responses, adverse clinical outcomes, and reduced quality of life in cancer patients.8–11 Furthermore, randomized controlled trials have underscored the potential of nutritional support in reducing mortality across various cancer types.12,13 Based on the above evidence, it is strongly recommended that dietitians and nutritionists collaborate closely with cancer patients. 14
Nevertheless, real-world studies have highlighted that over half of cancer patients do not have access to timely nutritional assessments and dietary support.6,15 This situation may be attributed to a shortage of qualified professionals in the field. In fact, as per the Compensation and Benefits Survey of the Dietetics Profession 2021, the USA is grappling with a deficit of registered dietitians and nutritionists holding terminal degrees. 16 This scarcity of proficient dietitians and nutritionists could potentially be more acute in low to middle-income countries, which could be associated with inadequate nutritional status assessment and heightened mortality rates among cancer patients.
The advancement of digital technologies has paved the way for the effectiveness of mobile health and telemedicine in healthcare management.17,18 Moreover, these technologies, given their automated nature, demand fewer trained human resources, which can significantly contribute to achieving medical equality, particularly in low- to middle-income countries.19,20 R+ Dietitian, a digital smartphone-based self-administered tool for nutritional risk screening (NRS), has demonstrated remarkable consistency in dietary assessment compared to assessments performed by professional dietitians. 21 The user interface of the R+ Dietitian is shown in Figure 1, which includes collecting patients’ basic information, automatically conducting electronic nutritional assessments using the NRS-2002 tool and the Patient-Generated Subjective Global Assessment Short Form (PG-SGA-SF) tool,14,22–24 and evaluating energy and protein intake through the assessment of dietary intake of rice, meat, and milk. This digital tool holds great potential for practical implementation in real-world clinical nutritional assessment and support for cancer patients.

The user interface of the R+ Dietitian. (A and B) Collection of basic information of patients. (C, D, and E) Parts of nutritional assessments, including evaluation of weight loss, type of food intake, and changes in appetite. (F) Visualize the assessment of rice intake.
This study aims to evaluate nutritional status using a digital tool (R+ Dietitian) and analyze the association between nutritional status, clinical characteristics, and biochemical parameters in cancer patients, retrospectively.
Methods
General study information: Inclusion and exclusion criteria
A retrospective analysis was conducted on the medical records of 535 patients who sought medical care in the Oncology Department of Sichuan Provincial People's Hospital, Chengdu, China, between July 2020 and September 2021. During their first hospitalization, nutritional assessments, including NRS-2002, PG-SGA-SF scores, and assessment of dietary intake of energy and protein, were conducted by using R+ Dietitian mini program. Among these patients, there were 340 males and 195 females, with an average age of 58.32 years (ranging from 21 to 87 years). The inclusion criteria were as follows: age ≥18 years, pathologically confirmed tumors, and the ability to communicate effectively. The exclusion criteria included patients with psychiatric or psychological disorders, those who were not assessed by R+ Dietitian, and those who were unwilling or unable to provide written informed consent.
General clinical and nutritional characteristics
Tables S1 and S2 present the general clinical characteristics of 535 patients. The average weight of the patients was 58.02 ± 9.38 kg (35.00–88.00 kg), with 214 patients (40.00%) experienced weight loss (WL), with an average reduction of 4.07 ± 2.51 kg (1.00–13.00 kg). Among them, 48 patients (9.00%) had WL ≥10%. A total of 374 patients (69.90%) were with a body mass index (BMI) within the normal range of 18.5–24.9 kg/m², 78 patients (14.60%) with a BMI < 18.5 kg/m², and 83 patients (15.50%) with a BMI ≥ 25 kg/m². Table S1 outlines the clinical characteristics of patients in terms of medical history and hospitalization information. Among them, 231 (43.20%) had gastrointestinal tumors, 152 (28.40%) had respiratory tract tumors, 59 (11.00%) had head and neck tumors, and 93 (17.40%) had gynecological and other tumors. The average length of hospital stay for patients was 5.58 ± 8.00 days (1–58 days), with a median stay of 3 days. The average hospitalization cost was 13,669 ± 16,020 Chinese Yuan (663–157,211 CNY).
Using R+ Dietitian, patients completed NRS-2002 and PG-SGA-SF assessments, as well as surveys of dietary energy and protein intake, either independently or with assistance, without the involvement of professional dietitians. The results revealed that the average NRS-2002 score for patients was 2.11 ± 1.26 (0–5) points, with 372 patients (69.50%) scoring <3 points and 163 patients (30.50%) scoring ≥3 points on the NRS-2002 assessment. The average PG-SGA-SF score for patients was 3.96 ± 3.22 (1–16) points, with 289 patients (54.00%) scoring <4 points, 188 patients (35.10%) scoring 4–8 points, and 58 patients (10.80%) scoring ≥9 points on the PG-SGA-SF assessment. Patients’ average dietary energy intake was 1506.65 ± 482.41 (300.0–2958.6) kilocalorie, and their average protein intake was 76.42 ± 25.32 (15.0–169.8) g. The average rice intake was 223.95 ± 115.13 (0–500.0) g, the average meat intake was 107.82 ± 64.23 (0–400.0) g, and the average milk intake was 166.03 ± 141.39 (0–500.0) ml.
Study design
On the day of first admission, eligible patients were requested by dietitians to undergo NRS and dietary assessment using the R+ Dietitian mini program. Patients or their family members accessed the R+ Dietitian program by opening the WeChat application on their smartphones and scanning a QR code. After completing the assessment, estimated values of NRS-2002 scores, PG-SGA-SF scores, and dietary energy and protein intake were displayed on the R+ Dietitian 's result interface and stored in the program backend. Data for this retrospective study were transcribed by researchers from the program backend.
Baseline demographic and medical characteristics of participants, including age, gender, means of healthcare payment, occupation, marital status, residence, education level, chronic disease status, cancer type, cancer family history, length of hospital stay, and costs, were obtained by researchers from electronic medical records. Patients’ height and weight were measured upon admission, and the BMI and WL during the disease process were calculated. Laboratory blood tests were conducted to analyze blood cell count parameters (hemoglobin, white blood cells, platelets) and serum biochemical parameters (creatinine, total protein, albumin, prealbumin) levels. Patients were categorized into subgroups based on age (<65 years vs. ≥65 years), NRS-2002 scores (<3 points vs. ≥3 points), PG-SGA-SF scores (<4 points vs. ≥4 points), BMI (<18.5 kg/m² vs. ≥18.5 kg/m²), and hospitalization duration (≤3 days vs. >3 days) for comparative analysis. Clinical factors, nutritional factors, and selected laboratory parameters were compared between these subgroups. Furthermore, correlations were explored between selected nutritional parameters (NRS-2002, PG-SGA-SF, BMI), hospitalization duration, and selected clinical-pathological factors. Risk factors for malnutrition and prolonged hospitalization were determined.
Ethical approval and consent to participate
This study was conducted in accordance with the 1964 Helsinki Declaration and received approval from the Medical Ethics Committee of Sichuan Provincial People's Hospital (2019/243). Written informed consent was obtained from all participants.
Statistical analysis
All statistical analyses were performed using SPSS 26.0 software (IBM Inc.). The Kolmogorov-Smirnov test was employed to assess the normality of continuous variables, which were then presented as means (SD) or medians (IQR) based on the distribution type. For continuous variables, comparisons between groups were made using either the parametric Student's t-test or the non-parametric Mann-Whitney U test, while for categorical variables, comparisons between groups were conducted using the χ² test or Fisher exact test. A significance level of P < 0.05 was considered statistically significant.
Statistical analyses of correlations between selected nutritional parameters (NRS-2002, PG-SGA-SF, BMI), hospitalization duration, clinical-pathological factors, and blood indicators were conducted using Pearson's or Spearman's rank-correlation coefficient. The interpretation of correlation strength was based on P-values and correlation coefficients (r) as follows: 0.00–0.30 (weak correlation), 0.31–0.50 (moderate correlation), 0.51–0.80 (strong correlation), and 0.81–1.00 (very strong correlation). Furthermore, multiple forward stepwise linear regression model analysis was used to examine the relationships between nutritional parameters (NRS-2002, PG-SGA-SF), hospitalization duration, and clinical pathological factors. Multiple binomial logistic regression analysis was used to identify independent risk factors associated with malnutrition (NRS-2002 ≥ 3 points or PG-SGA-SF ≥ 4 points). Odds ratios (ORs) and the corresponding 95% confidence intervals (CIs) in the contingency tables were used to estimate relative risks.
Results
Comparison of selected clinical pathological factors and nutritional parameters based on age
Patients were categorized into two groups based on age <65 years (younger group) and ≥65 years (older group). Table S3 provides a summary of all comparisons between the two age groups. Compared to the younger group, the older patients showed a significantly higher NRS-2002 score, but less WL (all of above, P < 0.05). Additionally, the older patients had significantly lower serum albumin levels, prealbumin levels, and a lower rate of achieving the standard level of serum total protein concentration (≥60 g/L) compared to the younger group (all of above, P < 0.05).
Comparison of selected clinical pathological factors and nutritional parameters based on NRS-2002
Patients were categorized into two groups based on NRS-2002 scores: <3 (low-risk group) and ≥3 (high-risk group). Table S4 summarizes all the comparisons between the two NRS-2002 score groups. Compared to the low-risk group, the high-risk group had significantly higher age, lower weight, lower BMI, greater WL, and longer hospital stay (all of above, P < 0.05). Moreover, the high-risk group showed significantly lower rates of achieving recommended serum total protein concentration (≥60 g/L) and albumin concentration (≥40 g/L), and had a more significant appetite loss and decrease in food intake compared to the low-risk group (all of above, P < 0.05).
Comparison of selected clinical pathological factors and nutritional parameters based PG-SGA-SF
Patients were categorized into two groups based on their PG-SGA-SF scores: <4 (low-risk group) and ≥4 (high-risk group). Table S5 summarizes all the comparisons between the two PG-SGA-SF score groups. Similar to the results obtained by grouping based on NRS-2002 scores, compared to the low-risk group, the high-risk group had a significantly higher proportion of older patients (≥65 years), lower weight, lower BMI, greater WL, longer hospital stay, and higher hospitalization costs (all of above, P < 0.05). The high-risk group also showed significantly lower rates of achieving recommended serum total protein concentration (≥60 g/L) and albumin concentration (≥40 g/L) compared to the low-risk group (all of above, P < 0.05).
Comparison of selected clinical pathological factors and nutritional parameters based BMI
Patients were categorized into two groups based on the BMI standards recommended by the World Health Organization: <18.5 (underweight group) and ≥18.5 (normal group). Table S6 presents a summary of all the comparisons between the two BMI groups. Due to body weight being one of the determinants of BMI, the underweight group had a significantly lower body weight compared to the normal group (P < 0.001). In comparison to the normal group, the underweight group showed significantly higher proportions of NRS-2002 scores ≥3, PG-SGA-SF scores ≥4, had longer hospital stays, higher hospitalization costs, and lower rates of achieving recommended serum total protein concentration (≥60 g/L) and albumin concentration (≥40 g/L) (all of above, P < 0.05).
Comparison of selected clinical pathological factors and nutritional parameters based hospitalization stay
Patients were categorized into two groups based on the median hospitalization stay (3 days): ≤3 days and >3 days. Table S7 provides a summary of all the comparisons between the two groups divided by the median hospitalization stay. Patients with a hospital stay of ≤3 days had significantly lower hospitalization expenses, lower NRS-2002 scores, lower PG-SGA-SF scores, reduced WL, and a higher rate of achieving recommended serum albumin concentration (≥40 g/L) compared to those with >3 days (all of above, P < 0.05).
Correlations between selected clinical pathological factors and nutritional parameters
As shown in Table 1, there were significant positive correlations between the NRS-2002 score and age, hospitalization duration, and serum platelet concentration (all of above, P < 0.05). Furthermore, the NRS-2002 score had significant negative correlations with serum total protein, albumin, prealbumin, hemoglobin, weight, BMI, WL, energy intake, protein intake, rice intake, and meat intake (all of above, P < 0.05).
Correlations between NRS 2002, PG-SGA-SF, BMI, duration of hospitalization, and selected clinical and laboratory parameters.
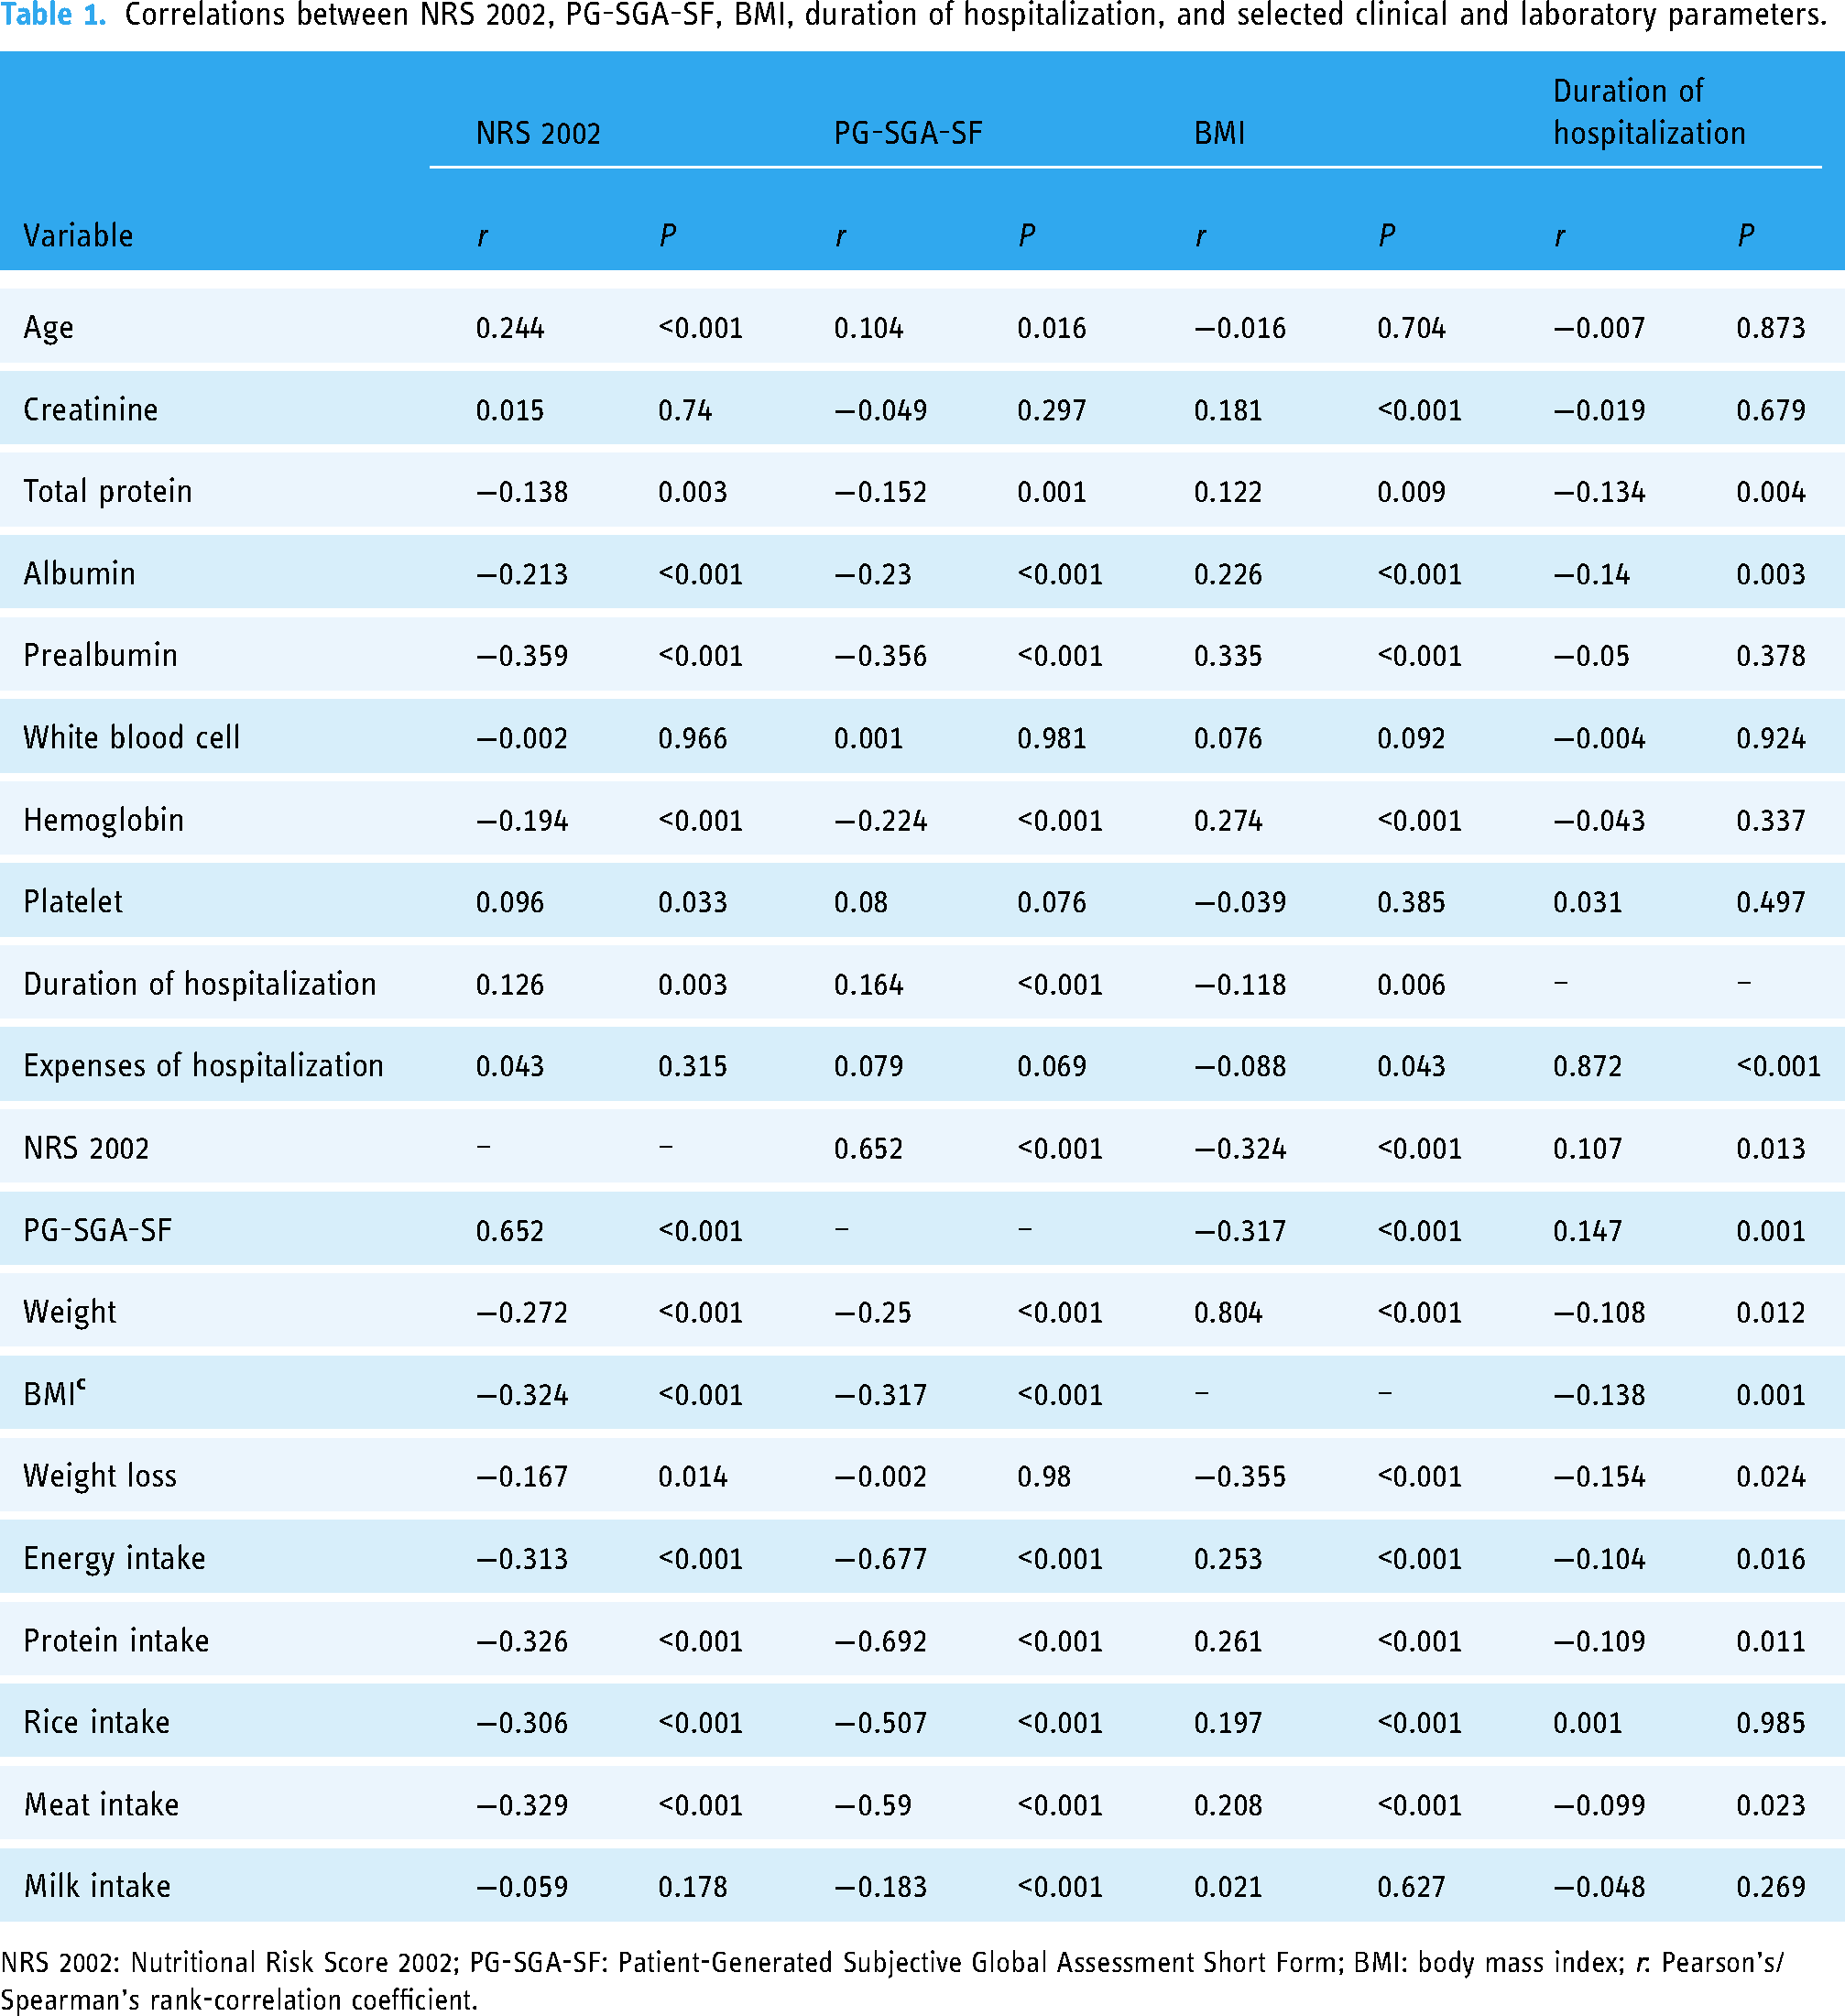
NRS 2002: Nutritional Risk Score 2002; PG-SGA-SF: Patient-Generated Subjective Global Assessment Short Form; BMI: body mass index; r: Pearson's/Spearman's rank-correlation coefficient.
The PG-SGA-SF score had significant positive correlations with age and hospitalization duration (all of above, P < 0.05), and significant negative correlations with serum total protein, albumin, prealbumin, hemoglobin, weight, BMI, energy intake, protein intake, rice intake, meat intake, and milk intake (all of above, P < 0.05).
BMI had significant negative correlations with NRS-2002 score, PG-SGA-SF score, WL, hospitalization duration, and hospitalization expenses (all of the above, P < 0.05). Moreover, it had significant positive correlations with serum creatinine, total protein, albumin, prealbumin, hemoglobin, weight, energy intake, protein intake, rice intake, and meat intake (all of above, P < 0.05).
Duration of hospitalization had significant negative correlations with serum total protein, albumin, weight, BMI, WL, energy intake, protein intake, and meat intake (all of above, P < 0.05). Furthermore, it had significant positive correlations with hospitalization costs, PG-SGA-SF score, and NRS-2002 score (all of above, P < 0.05).
Regression analysis between selected nutritional parameters and clinical pathological factors
Results from multiple linear regression analysis showed in Table 2 revealed that higher NRS-2002 scores (indicating nutritional risk) were significantly associated with lower serum prealbumin concentration, BMI < 18.5, and lower rice intake (all of the above, P < 0.001). Conversely, as shown in Table 3, higher PG-SGA-SF scores (indicating nutritional risk) were significantly associated with lower serum prealbumin concentration, higher weight, BMI < 18.5, and lower energy intake (all of the above, P < 0.001).
Association between NRS 2002 and selected clinical and laboratory parameters in multiple regression linear analysis.
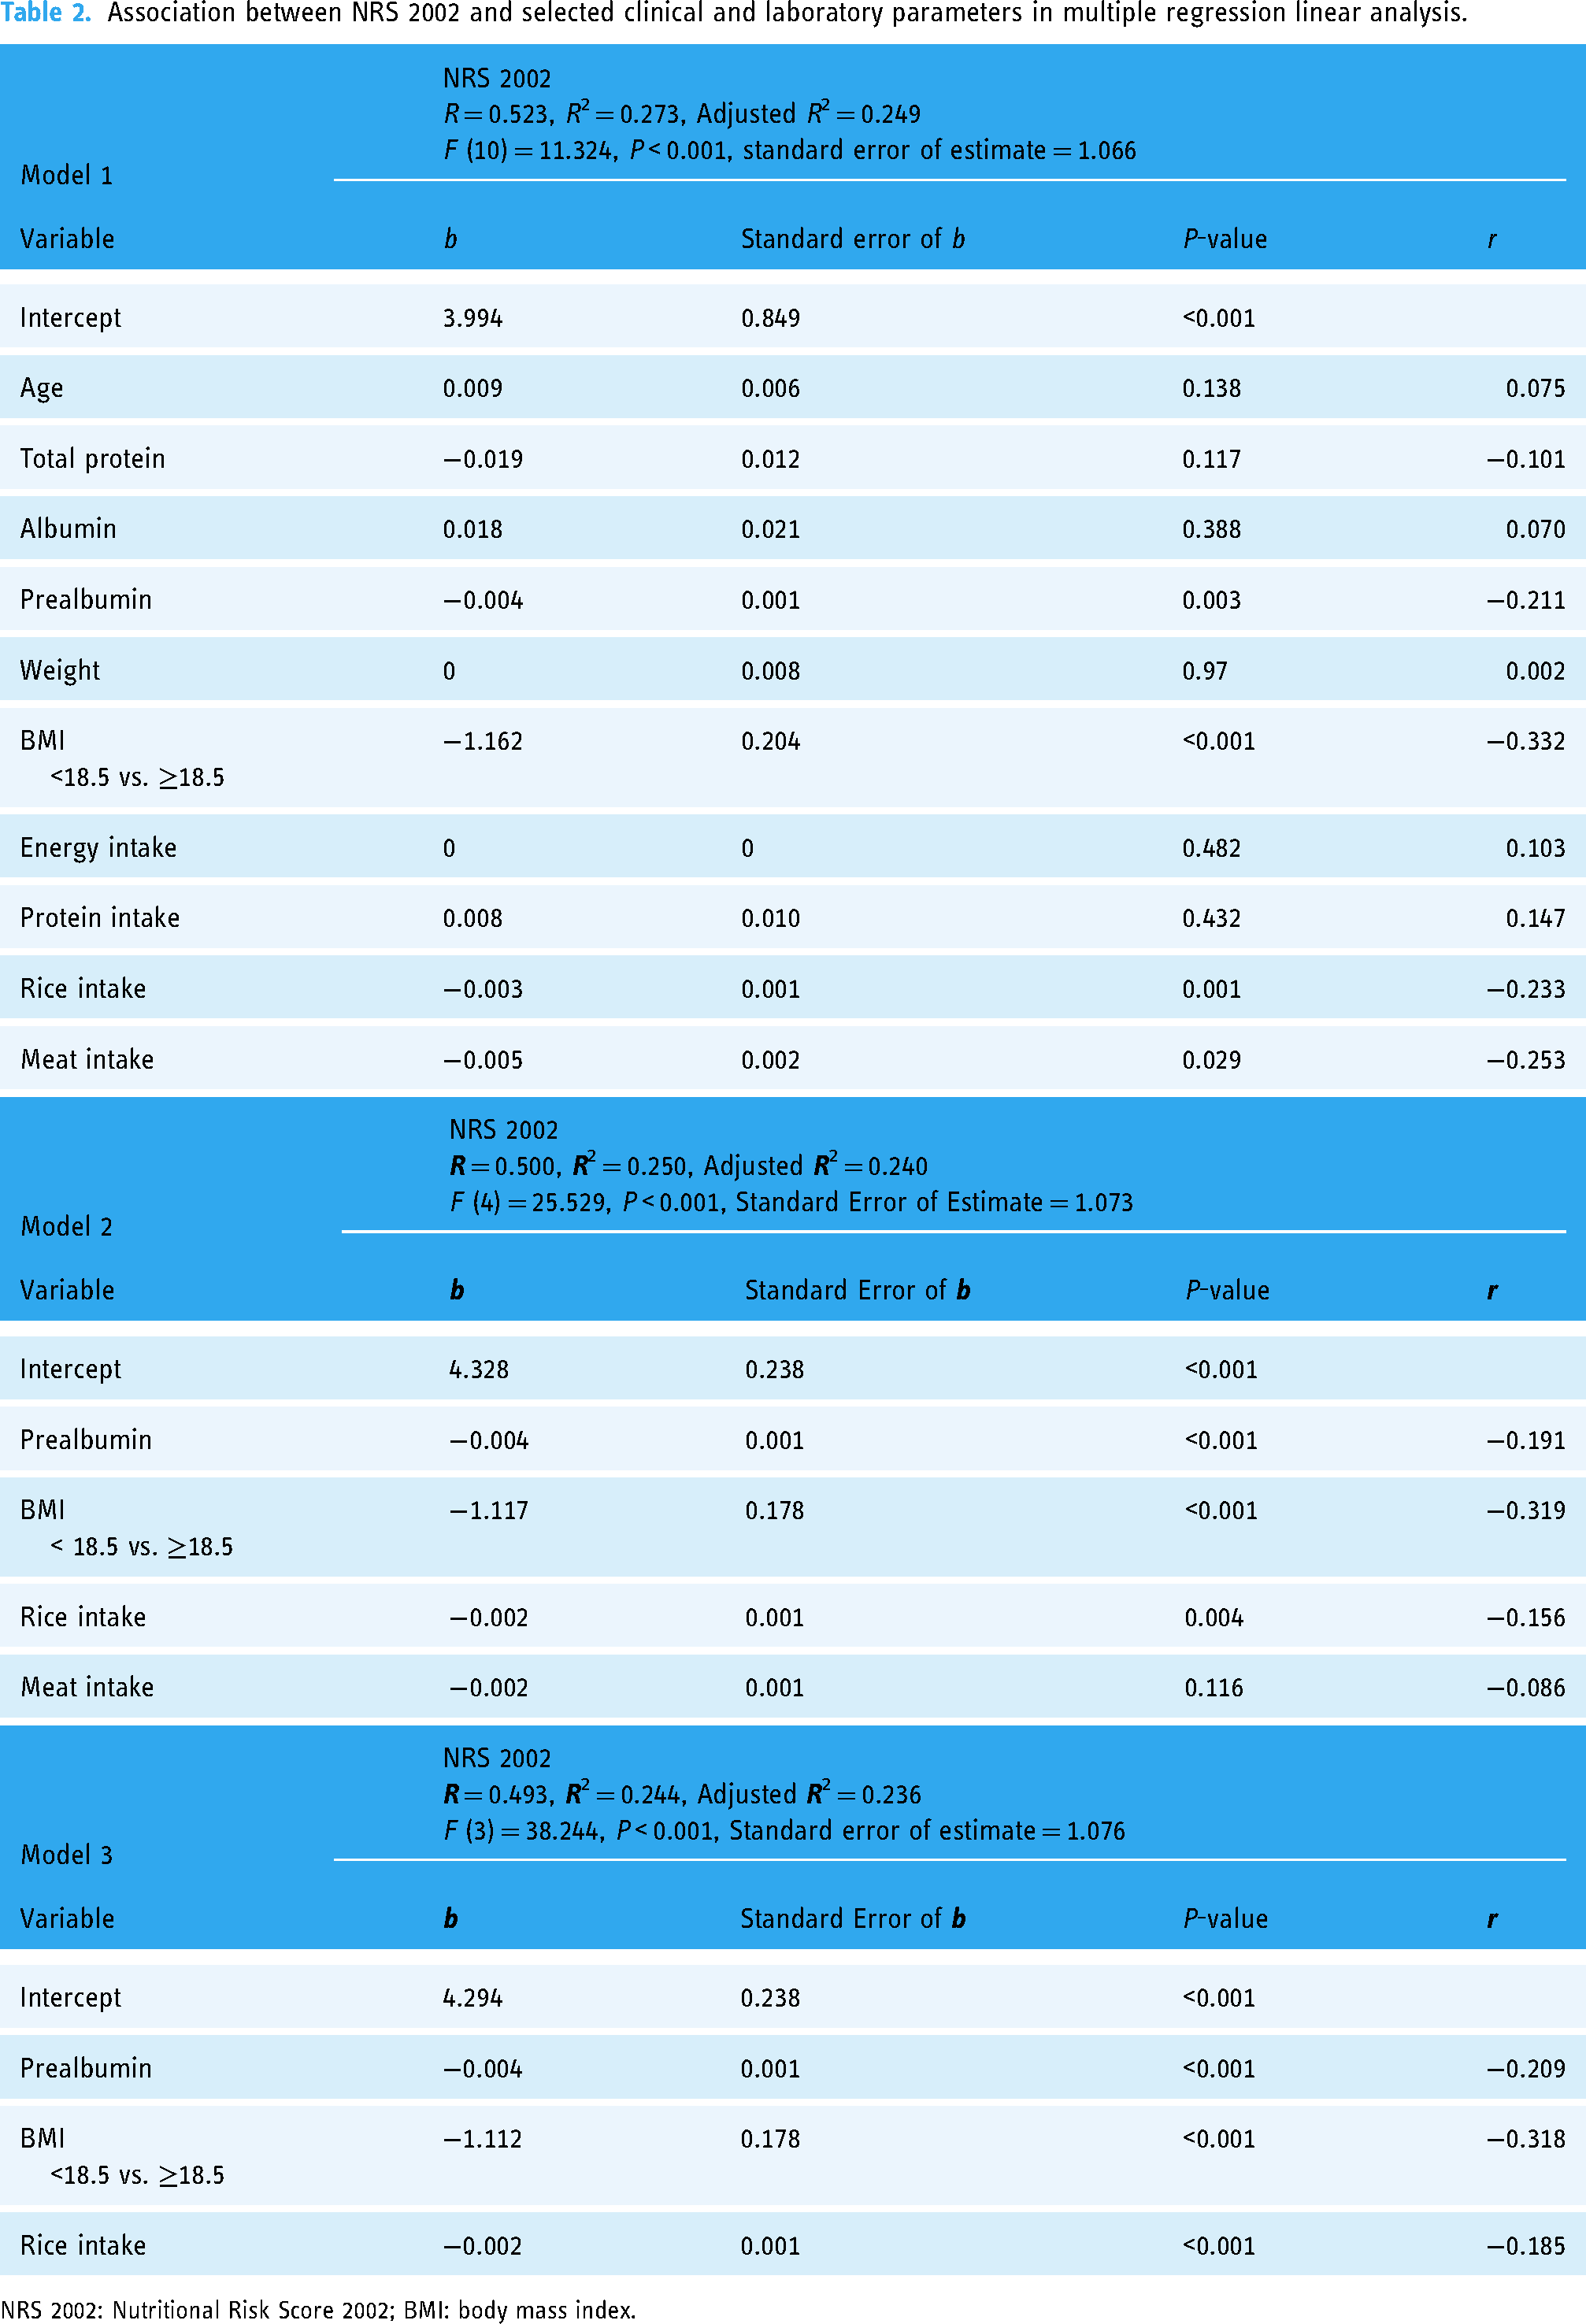
NRS 2002: Nutritional Risk Score 2002; BMI: body mass index.
Association between PG-SGA-SF and selected clinical and laboratory parameters in multiple regression linear analysis.

PG-SGA-SF: Patient-Generated Subjective Global Assessment Short Form; BMI: body mass index.
Multiple logistic regression analysis results showed in Table 4 revealed that lower serum prealbumin concentration, WL, and BMI < 18.5 (all of the above, P < 0.005) were significantly associated with nutritional risk indicated by NRS-2002 score ≥3. Similarly, results in Table 5 showed that lower serum hemoglobin concentration, higher weight, WL, lower BMI, and lower energy intake (all of above, P < 0.001) were significantly associated with nutritional risk indicated by PG-SGA-SF score >3.
Association between NRS 2002 classification and selected clinical and laboratory parameters in multiple binomial logistic regression analysis.

NRS 2002: Nutritional Risk Score 2002; BMI: body mass index; SE: standard error; 95% CI: 95% percent confidence intervals; OR: odds ratio.
Association between PG-SGA-SF classification and selected clinical and laboratory parameters in multiple binomial logistic regression analysis.

PG-SGA-SF: Patient-Generated Subjective Global Assessment Short Form; BMI: body mass index; SE: standard error; 95% CI: 95 percent confidence intervals; OR: odds ratio.
Multiple linear regression analysis in Table 6 showed that serum albumin concentration ≥40 g/L (P = 0.005) was significantly associated with shorter hospitalization stay, while PG-SGA-SF score >3 (P = 0.008) was significantly associated with longer hospitalization stay.
Association between duration of hospitalization and selected clinical and laboratory parameters in multiple regression linear analysis.

Patient-Generated Subjective Global Assessment Short Form.
Discussion
Our study has demonstrated that without the need for manual evaluation by professional nutritionists, nutritional status assessed by the digital tool (R+ Dietitian) accurately reflected clinicopathological factors such as serum prealbumin concentration in cancer patients, as well as nutritional parameters including BMI, WL, and energy intake in cancer patients. Comprehensive analysis revealed that higher nutritional risk identified by the R+ Dietitian is associated with longer hospital stays and higher healthcare costs. This relationship could potentially impact the efficiency and effectiveness of hospital care.
Previous studies have clearly demonstrated a significant association between malnutrition and adverse clinical outcomes in cancer patients.7,11,25,26 As a result, NRS is both important and necessary for cancer patients. NRS-2002 and PG-SGA-SF are recommended for NRS in many countries, but this often necessitates a substantial professional workforce.14,22,23 In this context, digital applications or telemedicine can play a crucial role in automating the screening process,27,28 particularly in regions with limited resources. Leveraging digital screening tools allows healthcare providers to promptly evaluate the nutritional status of patients, even in areas where access to nutritionists may be limited, a common scenario in many countries. Furthermore, digital applications and telemedicine offer the advantage of high accessibility and can be readily implemented in various healthcare settings, thereby promoting healthcare equity.28,29
In our previous publication, we assessed the validity of the digital screening tool employed in the current study. The NRS-2002 and PG-SGA-SF tools within the digital screening tool exhibited significant accuracy, sensitivity, and specificity, with values of 77.5%, 81.0%, and 76.7% for NRS-2002 and 69.3%, 84.5%, and 64.5% for PG-SGA-SF, respectively. 21 These findings demonstrated a strong alignment between the digital screening tool used in this study and the conventional human-rated screening. Recent research has highlighted PG-SGA as a robust predictor of hospital stay duration specifically for patients with cancer during treatment. 26 Additionally, other studies have indicated that NRS-2002 and PG-SGA-SF scores are inversely correlated with various nutritional parameters in cancer patients.30–32 The findings of this study are consistent, as both nutritional risks scoring systems were negatively correlated with total protein, prealbumin, body weight, BMI, energy intake, protein intake, and other variables. And PG-SGA-SF scores predicted the long hospital stays. The body of evidence suggests that R+ Dietitian as a digital screening tool for nutritional risk holds promise for practical clinical applications.
Among various nutritional parameters, albumin, and prealbumin are the primary proteins found in human serum, and they can effectively reflect the protein nutritional status of the body.33,34 Recent research has unveiled the predictive value of albumin and prealbumin in the occurrence, development and prognosis of various cancers, highlighting their potential as independent prognostic factors for cancer patients, even superior to other inflammatory indicators.35–37 Regression analysis conducted in the present study also indicates that, beyond pivotal factors like WL and BMI that determine nutritional scores, reductions in serum prealbumin, albumin, and hemoglobin concentrations are associated with poorer nutritional status and longer hospital stays among cancer patients. This underscores the significance of clinical laboratory indicators in addition to the utility of digital screening tools in guiding clinical nutritional interventions for cancer patients.
Furthermore, the consensus among dietary nutrition experts for cancer patients emphasizes that the provision of reasonable and effective nutritional support can enhance postoperative nutrition and immune status, reduce mortality and medical expenses, and hold favorable implications for the majority of malnourished cancer patients.38–40 In China, the vast majority of cancer patients rely on parenteral nutrition support, especially for ordinary oral diets. Hence, the evaluation of oral dietary nutrient intake is critical for assessing the nutritional status of these patients. Apart from facilitating a quick assessment of nutritional scores, R+ Dietitian also features digital tools for the rapid evaluation of a patient's energy and protein intake, enabling doctors to gain a preliminary understanding of intake levels of these two nutrients. Previous studies have indicated that the variance in estimated energy and protein intake between R+ Dietitian's electronic assessment and the clinical nutritionist's 3d-24HR manual assessment is notably smaller compared to variations observed among other three digital dietary recording applications. This feature helps clinical doctors promptly grasp the patient's nutrient intake levels. 21 This study also suggests a significant correlation between assessed energy intake and the risk of malnutrition assessed by a PG-SGA-SF score, further underscoring the advantages of R+ Dietitian in simultaneously and efficiently performing both nutritional score evaluations and dietary nutrient intake assessments.
Strengths and limitations
This article boasts several key strengths, including substantial sample size and the comprehensive nature of the clinical data collected. We gathered a wide range of data encompassing baseline characteristics, essential nutritional parameters, biochemical indicators, and crucial hospitalization-related information. Such multidimensional clinical data significantly enhance the reliability of the comparisons made between digital screening and traditional dietitian-based screening, as reported in prior publications. Furthermore, this article stands out for its inclusion of a diverse group of cancer patients, closely mirroring real-world clinical scenarios. Our findings highlight the applicability of the digital screening tool to various types of cancer. Nevertheless, there are also some limitations of this study. Firstly, this retrospective analysis lacks sufficient prognosis data, such as 5-year survival rates. Additionally, different cancer types may be linked to varying nutritional statuses and distinct hospitalization-related factors, such as duration and cost. Future research endeavors could establish prospective cohorts to delve into the long-term outcomes of cancer patients and explore the impact of digital screening versus manual screening.
Conclusions
This study demonstrated that the nutritional status of cancer patients assessed by R+ Dietitian accurately reflected their nutrition-related clinical characteristics and biochemical parameters, which suggested that digital NRS tools held promise for practical clinical applications. In the context of a shortage of professional clinical nutritionists, the advantages of R+ Dietitian, including accuracy, speed, efficiency, and accessibility, helped healthcare providers understand the nutritional status and nutrient intake of cancer patients, improved patient outcomes, enhanced healthcare management efficiency, and promoted healthcare equity.
Supplemental Material
sj-docx-1-dhj-10.1177_20552076241255475 - Supplemental material for Association between nutritional status assessed by a digital self-administered tool (R+ dietitian) and clinicopathologic factors in cancer patients: A comprehensive analysis
Supplemental material, sj-docx-1-dhj-10.1177_20552076241255475 for Association between nutritional status assessed by a digital self-administered tool (R+ dietitian) and clinicopathologic factors in cancer patients: A comprehensive analysis by Jianmei Zhu, Silu Wang, Tenglong Li, Zhiwen Long, Chengyuan He, Ke Xie and Shan Huang in DIGITAL HEALTH
Footnotes
Acknowledgments
The authors acknowledge all study participants for supporting this study.
Contributorship
SW contributed to the study design, data collection and analysis, and wrote the manuscript. SH and KX contributed to the study design and patient recruitment. JZ and TL contributed to patient recruitment and data collection. ZL and CH contributed to the study design, data analysis, and manuscript preparation and review.
Declaration of conflicting interests
The authors declared no potential conflicts of interest with respect to the research, authorship, and/or publication of this article.
Ethical approval
The study was conducted according to the guidelines of the Declaration of Helsinki and received approval from the Medical Ethics Committee of Sichuan Provincial People's Hospital (2019/243).
Funding
The authors disclosed receipt of the following financial support for the research, authorship, and/or publication of this article: This study was funded by Science & Technology Department of Sichuan Province (Grant number: 2023YFS0131) and Recovery Plus Inc., Chengdu, China, and the R+ Dietitian mini program used in this study was provided by this company.
Guarantor
SW.
Informed consent
Written informed consent was obtained from all participants.
Supplemental material
Supplemental material for this article is available online.
References
Supplementary Material
Please find the following supplemental material available below.
For Open Access articles published under a Creative Commons License, all supplemental material carries the same license as the article it is associated with.
For non-Open Access articles published, all supplemental material carries a non-exclusive license, and permission requests for re-use of supplemental material or any part of supplemental material shall be sent directly to the copyright owner as specified in the copyright notice associated with the article.