
Abstract
Objective
To evaluate the ability of case vignettes to assess the performance of symptom checker applications and to suggest refinements to the methodology used in case vignette-based audit studies.
Methods
We re-analyzed the publicly available data of two prominent case vignette-based symptom checker audit studies by calculating common metrics of test theory. Furthermore, we developed a new metric, the Capability Comparison Score (CCS), which compares symptom checker capability while controlling for the difficulty of the set of cases each symptom checker evaluated. We then scrutinized whether applying test theory and the CCS altered the performance ranking of the investigated symptom checkers.
Results
In both studies, most symptom checkers changed their rank order when adjusting the triage capability for item difficulty (ID) with the CCS. The previously reported triage accuracies commonly overestimated the capability of symptom checkers because they did not account for the fact that symptom checkers tend to selectively appraise easier cases (i.e., with high ID values). Also, many case vignettes in both studies showed insufficient (very low and even negative) values of item-total correlation (ITC), suggesting that individual items or the composition of item sets are of low quality.
Conclusions
A test–theoretic perspective helps identify previously undetected threats to the validity of case vignette-based symptom checker assessments and provides guidance and specific metrics to improve the quality of case vignettes, in particular by controlling for the difficulty of the vignettes an app was (not) able to evaluate correctly. Such measures might prove more meaningful than accuracy alone for the competitive assessment of symptom checkers. Our approach helps elaborate and standardize the methodology used for appraising symptom checker capability, which, ultimately, may yield more reliable results.
Keywords
Introduction
In recent years, symptom checkers have been developed as smartphone applications (“apps”) or web-browser based online applications to aid laypersons in self-assessing their medical complaints. 1 These tools ask users a series of questions about their current medical complaints and provide potential diagnoses (app-assisted self-diagnosis) and/or guidance on where to seek care as output (app-assisted self-triage). 2 They are typically used at home when seeking health information or deciding where or whether to seek care.1,3 As the use of such patient-facing clinical decision support systems has become increasingly popular,3–5 it becomes an important task for researchers and regulators to develop methods to assess the accuracy and safety of their advice. 6 Currently, symptom checker apps are commonly tested by their developers or independent researchers. Though some studies are conducted in a real life setting where patients enter their own complaints into the studied symptom checker, 7 most studies rely on researchers, physicians or laypersons inputting a curated set of patient descriptions summarized in clinical case vignettes. Both when comparing symptom checkers against each other and when assessing a single symptom checker, metrics for triage and diagnostic accuracy, and sometimes sensitivity, specificity and safety of triage recommendations (i.e., not giving advice of less urgency than appropriate for the symptoms) are determined. However, studies vary substantially in the details of their methods and the scope of the case vignettes and symptom checkers considered.
A recent systematic review revealed that currently the safety and accuracy of symptom checkers vary not only substantially between individual apps, 8 but also across the published studies assessing them. Among the possible reasons for this variation between studies are differences in the selected sample of apps (i.e., different apps or versions of them are being assessed) and methodological differences, for example, how urgency levels are defined or on which types of complaints the apps are tested. 8 For example, some authors evaluate symptom checkers using vignettes on a broad variety of general symptoms,1,2,9–13 while others focus on vignettes with symptoms or diseases from specific fields such as rheumatology or hepatitis C.14–20
Another methodological difference is the source of input used for creating the case vignettes based on either real-world patient histories10,14,15,17,19,20 or descriptions of fictitious patients.1,2,9,11–13,18,21 Each case vignette is usually created using various medical materials and is reviewed by multiple physicians to obtain a gold standard solution. 1 While this approach originates in the evaluation of medical professionals 22 and transferring it to the evaluation of symptom checkers seems reasonable, the validity of this practice has been questioned.23,24 For example, Haddad and Tylee 25 developed a test to evaluate school nurses’ recognition of depression and examined the clinical vignettes used for this purpose with a test theory approach. Though their findings indicate that most of the items used were appropriate for the authors’ purpose, some were unsuitable for the evaluation—because they were too easy to solve or did not correlate with the construct—although they were medically correct. Other studies noting limitations of case vignettes recommended creating a benchmarking process to assess symptom checker accuracy 26 and to conduct studies “with greater methodological rigor and transparency”. 27
To answer this call and because case vignettes are commonly used to competitively compare symptom checkers’ safety and accuracy, this paper aims to critically review this standard practice using a test theoretical perspective. 28 By re-analyzing the data from previously published and highly influential studies, we determine common metrics of test theory and use them to evaluate the ability of case vignettes to audit symptom checkers’ performance. The three questions we address are as follows: 1. Using metrics from test theory, how suitable are case vignettes to assess symptom checker performance? 2. If we account for low-quality vignettes, how does this change our interpretation of the currently published results on symptom checkers’ capabilities? 3. In what way can a test theory perspective help advance the methodology for assessing symptom checkers’ capabilities? Our overall aim is to elaborate on and standardize the evaluation methods for symptom checker audits and to answer recent calls to improve the validity and reliability of studies using case vignettes to assess symptom checker performance. 29
Methods
Design
We conducted a secondary analysis of previously published data on triage accuracy of symptom checkers (test subjects) to calculate the common test theoretical metrics of the case vignettes (test items) used in these studies.
Study inclusion
This study aimed to include papers that are comparable to one another, highly cited in this field and provide access to their data. For this reason, only studies focusing on symptom checkers capable of handling a broad variety of symptoms and diseases were included (i.e., excluding studies that focus on specific diseases such as Hepatitis C). Studies were further required to have used case vignettes and must have been cited at least 10 times by the time of our search (from 1 November 2021 until 31 December 2021).
Combinations of the search terms “symptom checker,” “accuracy,” “reliability,” “self-triage,” and “self-diagnosis” were entered into the database search engines Web of Science and Google Scholar, which led to the identification of 14 studies on symptom checker accuracy. Out of those, 8 did not focus on general symptoms, but specific symptoms or diseases such as COVID-19 14 or orofacial pain. 21 Of the remaining 6 studies, one did not use case vignettes 10 and two were cited no more than 10 times.2,11 Finally, data from one study was not available upon request. 12 Thus, two papers were included in the analysis for this study: one conducted by Hill and colleagues 9 and another conducted by Semigran and colleagues. 1
Hill et al. examined the accuracy of symptom checkers that were publicly available in Australia in 2020 and provided patients with medical advice based on their symptoms free of charge. To identify these symptom checkers, they used search engines and the iOS and Android app stores to find apps that were available in English, aimed at patients, and that provided advice on a broad set of diseases. Some of them were classified as employing Artificial Intelligence (AI), whereas others used rule-based algorithms.8,30 Overall, they entered 48 case vignettes into 16 symptom checkers yielding a total of 688 case evaluations, as most symptom checkers were not able to assess all case vignettes.
Semigran et al. employed the same approach in 2015 but searched for symptom checkers worldwide rather than in a particular country. They did not report on the algorithms used in the tools. Overall, Semigran et al. used a curated set of 45 case vignettes with 15 symptom checkers providing triage advice yielding a total of 532 case evaluations. Eight of the evaluated symptom checkers were included in both studies. In its sample of 48 case vignettes, Hill et al. included modified versions of 30 case vignettes from the Semigran et al. study. These case vignettes included both common and uncommon diseases and symptoms ranging from low urgency situations for which self-care would be sufficient to emergency scenarios.
Both studies found that accuracy for triage and diagnosis was mediocre and highly variable across the set of symptom checkers in their sample. Moreover, triage accuracy was dependent on triage level with emergencies more commonly classified correctly than low acuity case vignettes. They also found triage advice to be risk-averse overall, i.e., the urgency levels of a case were more commonly overestimated rather than underestimated. Both author teams acknowledged several limitations in their methodologies that pertain to the present study: 1. They used case vignettes that might not capture the complexity of patient complaints in the real world and 2. they asked a single researcher with a background in the medical sciences or in public health and with knowledge about the gold standard solution to the case vignettes to enter the case vignettes in the symptom checkers rather than a set of laypeople. They further report that—despite their systematic search—they might not have identified all symptom checkers that were available at the time.
Other than sharing the same purpose, i.e., supporting laypersons in self-assessing their symptoms, the studied symptom checkers do not necessarily have much in common. The set of symptom checkers evaluated in the Hill et al. and Semigran et al. studies includes smartphone and website-based applications, from a wide range of providers (private companies, health insurance companies, and government bodies) and with different algorithmic approaches (e.g., Bayesian networks or rule-based logic systems). Unless the algorithmic approach is self-evident from the user interface, the exact approach is rarely described by the provider, though some refer to their app's reasoning engines as “artificial intelligence”. Most of the studied symptom checkers were marketed directly to consumers via app stores or websites without being integrated into healthcare delivery processes. Only some were either endorsed or integrated into the care pathways of healthcare institutions.
We concur with other researchers,1,2 that triage advice from symptom checkers is more important when it comes to assessing their safety and potential impact on healthcare delivery than their diagnostic suggestions. Thus, we focus on triage recommendations from symptom checkers in this study. Since not all symptom checkers appraised all vignettes, Table 1 provides an overview of the symptom checkers and the number of case vignettes they were tested with in each study.
Information on the symptom checkers and the number of cases entered in each study.

Metrics
Though numerous symptom checkers are available and included in the two studies, their number is rather low when it comes to validating test items and determining their test-theory metrics. 31 Thus, we selected two metrics from classical test theory, which can feasibly be calculated with a smaller number of data points: ID and part-whole corrected ITC. 28 Based on these metrics, we constructed two new measures to competitively re-evaluate the performance of the symptom checkers evaluated in both studies (i.e., adjusted accuracy and CCS). A graphical overview of our procedure can be found in Figure 1.
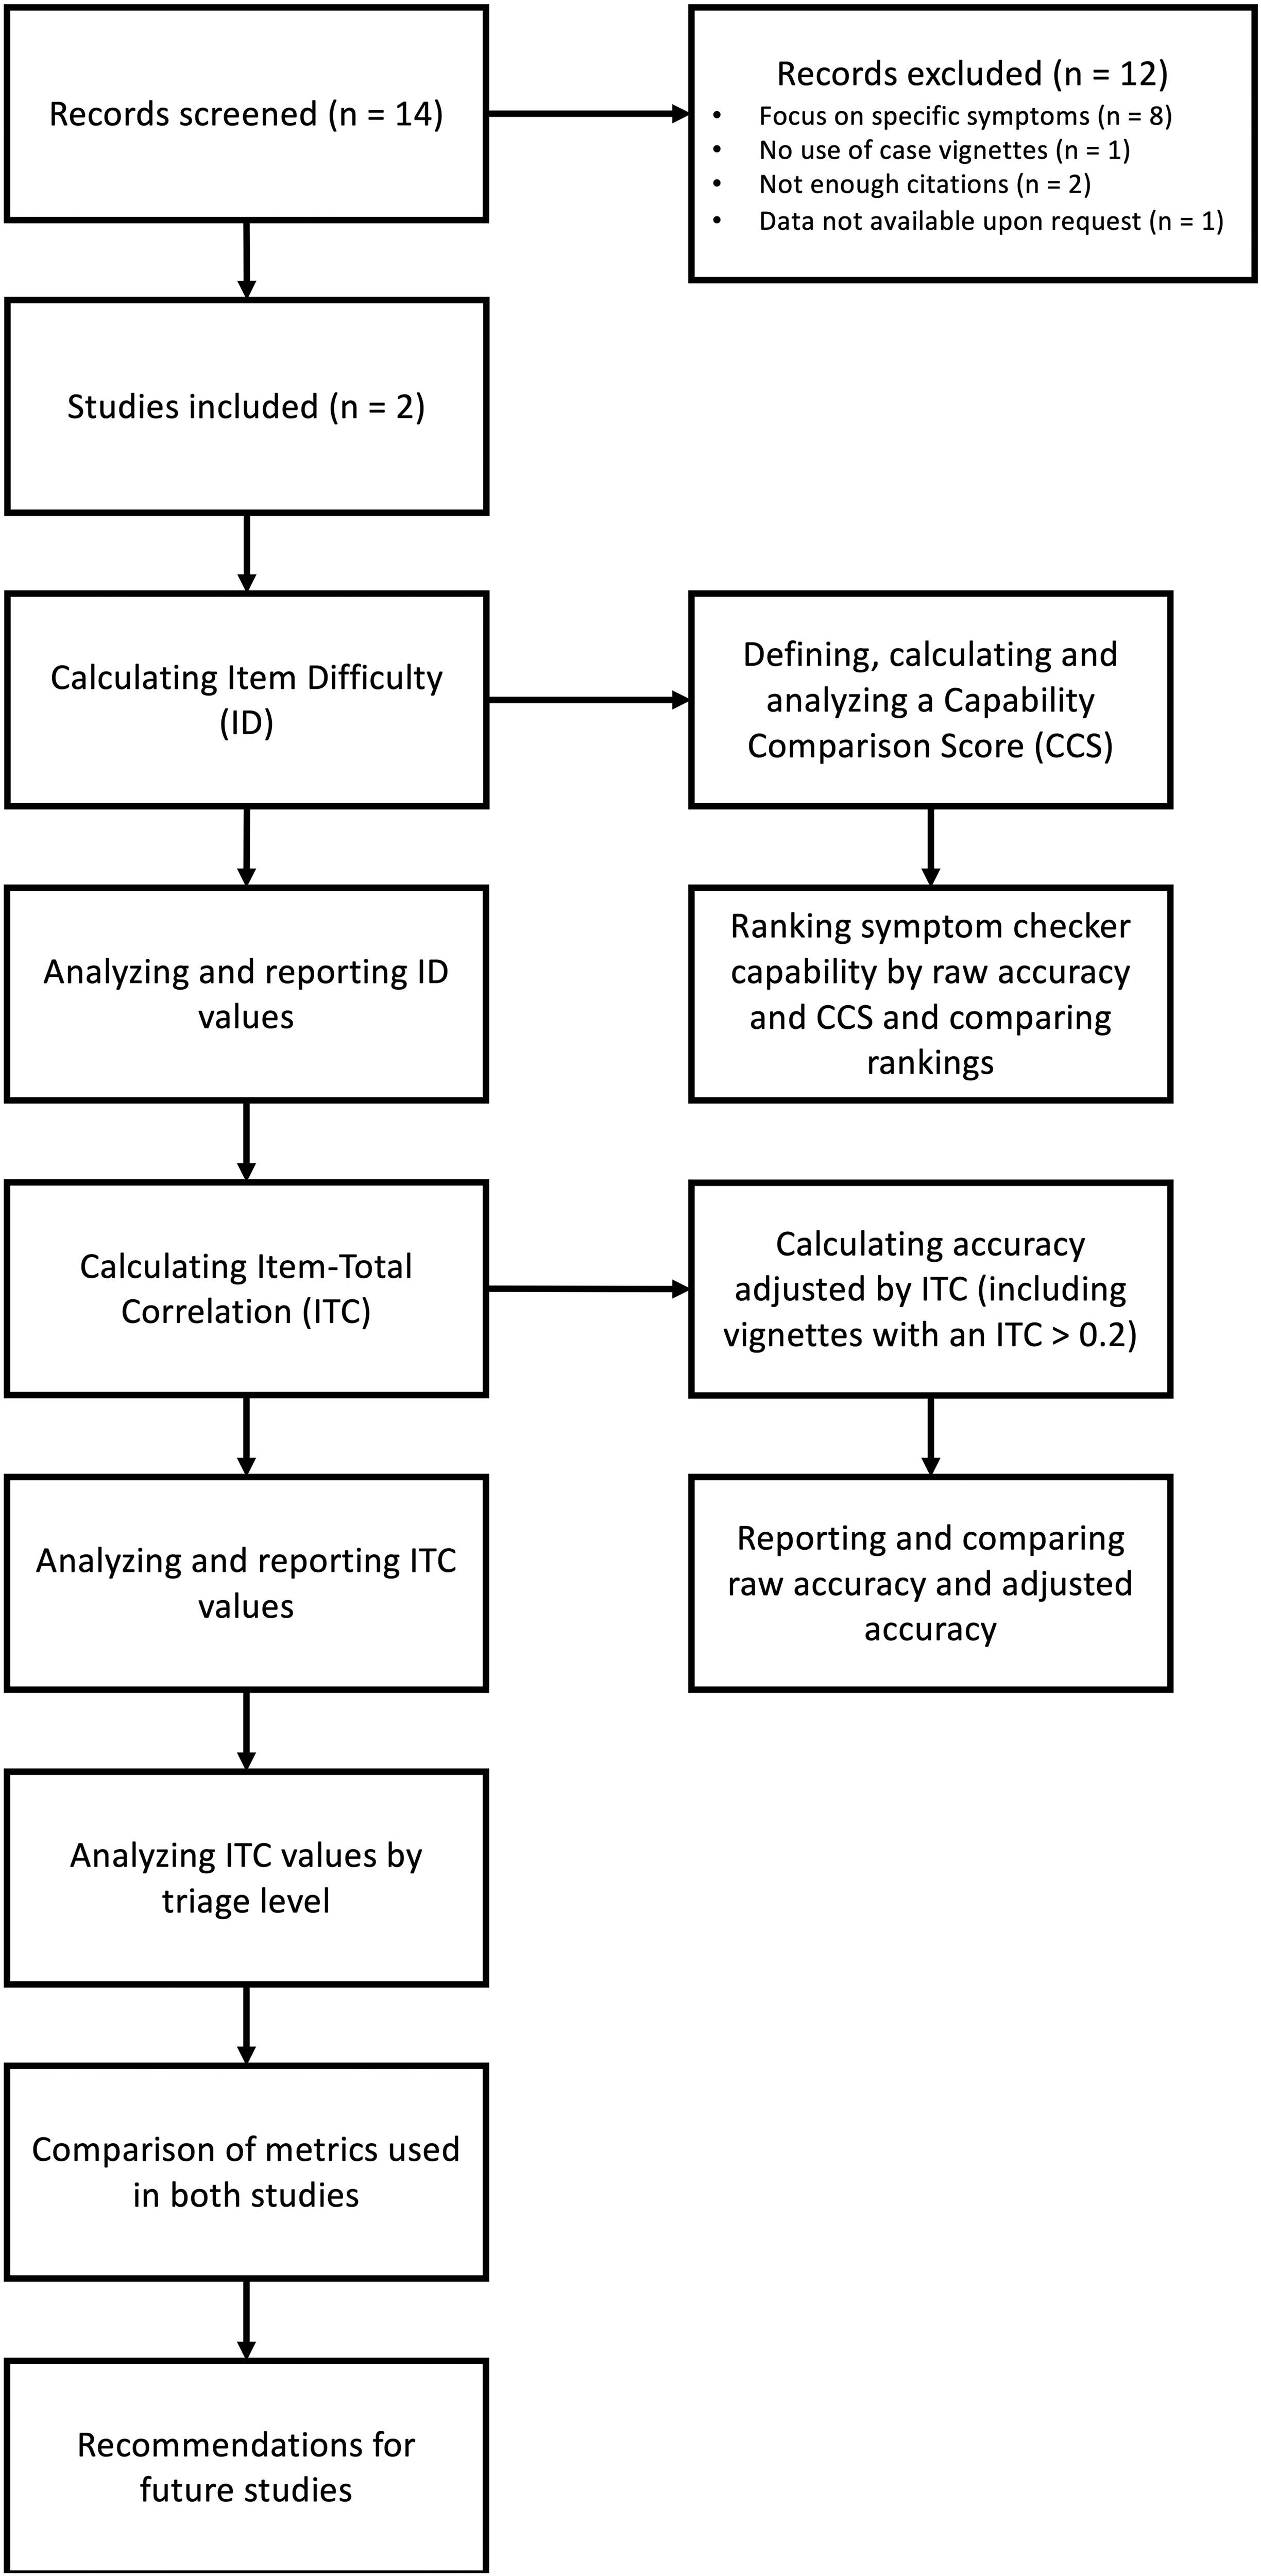
Methodological procedure of the present study.
Metrics from classical test theory on test items (case vignettes)
Item difficulty
ID is a measure of how difficult a test item i is for the symptom checkers as test subjects. In our case, this metric reflects the percentage of symptom checkers in a given study sample that were able to correctly solve case vignette i. It is calculated using the following formula:
Thus, higher values indicate that the vignette was easier to solve (i.e., with a value of 1, all symptom checkers could solve the vignette), while lower values indicate a more difficult case vignette (i.e., with a value of 0.5, only half of the sample of symptom checkers evaluating this case vignette solved it correctly). This metric is relevant to create a balanced palette of test items, including both difficult and easy case vignettes to evaluate symptom checkers. 32
Part-whole corrected item-total correlation
ITC is a measure of item discrimination used to identify a set of items that helps reliably compare test subjects’ performance and rule out those items that result in inconsistent performance patterns. For the purposes of our analysis, this means that it reflects the degree to which correctly solving a specific case vignette (test item) is associated with a symptom checker's (test subject's) accuracy on the remaining case vignettes. The part-whole corrected ITC is computed by calculating the accuracy for each symptom checker when the case vignette in question is omitted. Subsequently, the app's suggestion on the omitted case vignette—coded as either true (correct suggestion) or false (incorrect suggestion)—is correlated with the respective accuracy excluding this case vignette across all symptom checkers. It can also be described as follows:
28

ITC values close to 0 indicate that solving vignette i correctly cannot predict the probability of a symptom checker to solve the remaining vignettes correctly. High values (up to a maximum score of 1) indicate that vignette i is suitable for predicting the overall accuracy of symptom checkers. Negative ITC values indicate an inverse relationship between a symptom checker's overall accuracy and the accuracy regarding case vignette i. That is, poor-performing symptom checkers tend to answer vignette i correctly, while high-performing symptom checkers tend to appraise case vignette incorrectly. Hence, ITC values close to zero or negative indicate that the respective vignette is potentially inadequate to assess the performance of a symptom checker, having little informative value for a competitive comparison between symptom checkers. For the construction of test items in validated instruments, only items with ITC values above 0.2 are considered acceptable according to test theory, with values closer to 1 being preferable. 33 Also, an ITC value cannot be calculated if a test item (here, a case vignette) is solved correctly by either all or none of the test subjects (here, symptom checkers). According to test theory, such test items should be excluded from validated measurement instruments as they provide no value for the competitive comparison between test subjects.
To further explore the construct validity of this triage accuracy metric, we also determined each case vignette's part-whole corrected ITC by triage level. To do this, we correlated the accuracy of each individual vignette with the symptom checkers’ accuracy on the remaining case vignettes of the same triage level, i.e., for emergency care, non-emergency care and self-care triage separately.
Metrics for re-evaluating the test subjects (symptom checkers)
To study whether the calculated values for ID and part-whole corrected ITC justify a re-interpretation of the results of the original studies, we created two new metrics to assess accuracy in case vignette studies. Both metrics revisit the competitive comparison of the symptom checkers’ triage capabilities. The first, adjusted accuracy, investigates how the results would change if shortcomings relating to the part-whole corrected ITC in the vignette sample were considered, essentially focusing on vignettes with an ITC of > .2. The second, the capability comparison score, explores how taking ID into account changes the assessment of a symptom checker's capability.
Adjusted accuracy
We used the part-whole corrected ITC as the foundation for a critical reflection of the informative value of the raw accuracy metric commonly used to appraise a symptom checker's ability. In the two analyzed studies, accuracy represents the proportion of case vignettes that were solved correctly by the given symptom checker evaluated.1,9 As most symptom checkers cannot evaluate all vignettes and differ with respect to the kinds of vignettes they can solve, their reported raw accuracy might be based on samples of case vignettes with different informative values as measured by the case vignettes’ ITC values. Based on the ITC value of a vignette, we defined a new metric complementing this (raw) accuracy metric: adjusted accuracy. To calculate the adjusted accuracy, we included only vignettes with an ITC greater than 0.2, following the common practice in test theory to exclude items with negative and low ICTs, because they tend to add noise rather than helping discriminate between high and low-performing symptom checkers. 28
Thus, adjusted accuracy equals a symptom checker's raw accuracy eliminating those case vignettes with low or questionable informative value. Taken together, these two measures of accuracy (raw and adjusted) can be interpreted as follows: when a symptom checker's raw accuracy diverges from its adjusted accuracy, then its raw accuracy might be biased by unsuitable case vignettes, leading to either an overestimation or underestimation of the symptom checker's capability. This information might also be used to exclude low-quality vignettes in future studies.
Capability comparison score
Unlike in most tests to which test theory pertains, in symptom checker studies it is common that each app assesses a (slightly) different subset of test items (case vignettes), as most symptom checkers are not able to provide advice regarding all chief complaints featured in a given pool of case vignettes: in fact, only 2/15 apps and 4/16 apps considered all case vignettes in the Semigran et al. study and the Hill et al. study, respectively.
ID is therefore a potentially important metric when comparing the raw accuracy values of symptom checkers that have evaluated different sets of case vignettes. For example, two symptom checkers might have similar raw accuracies, but one having evaluated and solved correctly fewer difficult cases than the other, arguably makes it less capable than the other. To look into this, we determined for every symptom checker the mean (M) and the standard deviation (SD) of the ID of the vignettes, which it (a) evaluated and (b) solved correctly, a subset of the former.
Based on these data we defined and calculated a Capability Comparison Score for each symptom checker. We defined the CCS to enable direct comparisons between symptom checker performances by weighing the performance measure with the ID of the case vignettes that a particular symptom checker solved. To obtain the CCS for a symptom checker, the IDs of correctly solved cases are summed up and the sum of the IDs of incorrectly solved cases are subtracted to penalize the symptom checker for incorrect answers. Finally, these values are normalized to limit the values to a range between 0% and 100%. The resulting value can be described using the following formula:

Explanation of the CCS formula components.
For example, a symptom checker providing equally often correct and incorrect advice on case vignettes all with an ID of 0.5 would receive a CCS value of 50, the same as the raw accuracy score of 50%. In comparison, a different symptom checker with the same raw accuracy of 50% but having assessed more difficult case vignettes all with IDs of 0.3 would achieve a higher CCS value (namely, 64). A third symptom checker with an accuracy of 50% having assessed case vignettes of lesser difficulty with IDs of 0.7 would achieve a lower CCS value (namely, 17).
Data analysis
Data were analyzed and visualized using R version 3.6.1 34 and the tidyverse packages. 35 For descriptive analyses, the median (Mdn) and interquartile range (IQR) were calculated when data were not normally distributed. When data were normally distributed, we calculated the mean (M) and standard deviation (SD). Distributions were visualized using raincloud plots. 36
Finally, we analyzed a subset of the data by including only vignettes used in both studies (n = 30) to examine the stability of the test theoretic metrics. A Pearson correlation of the metrics between the studies was calculated, the data points were plotted, and their relationship was visualized using linear regression.
Ethical approval and patient consent
Ethical approval and consent was not required for this study as we analyzed publicly available data that was not collected from human subjects but from publicly available symptom checker apps.
Results
Item difficulty
Although the case vignettes were more difficult in the Hill study than in the Semigran study, the spread of ID was large and of about equal magnitude in both studies: for vignettes used by Hill et al., the ID was Mdn = 0.455 (IQR = 0.412) and for those used by Semigran et al. Mdn = 0.538 (IQR = 0.452). Both studies include vignettes that either all or no symptom checker solved correctly (3/48 in the vignette sample by Hill et al., and 4/45 in the vignette sample from Semigran et al.). The distribution of item difficulties of the vignettes is visualized in Figure 3.

Distribution of item difficulty of the case vignettes used in both studies.
The symptom checkers in the Hill et al. study considered samples of case vignettes with similar mean item difficulty: the mean ID for the app considering the most difficult sample of case vignettes, HealthyChildren, was 0.470, which is close to the mean ID for Everyday Health and Symptomate (both 0.502), assessing the least difficult sample of case vignettes in the Hill study. This gap is greater in the Semigran et al. study (minimum mean ID (HealthyChildren): 0.460, maximum mean ID (Symptomate): 0.692), see Table 2 and 3.
Item difficulty by symptom checker in the Hill et al. study.
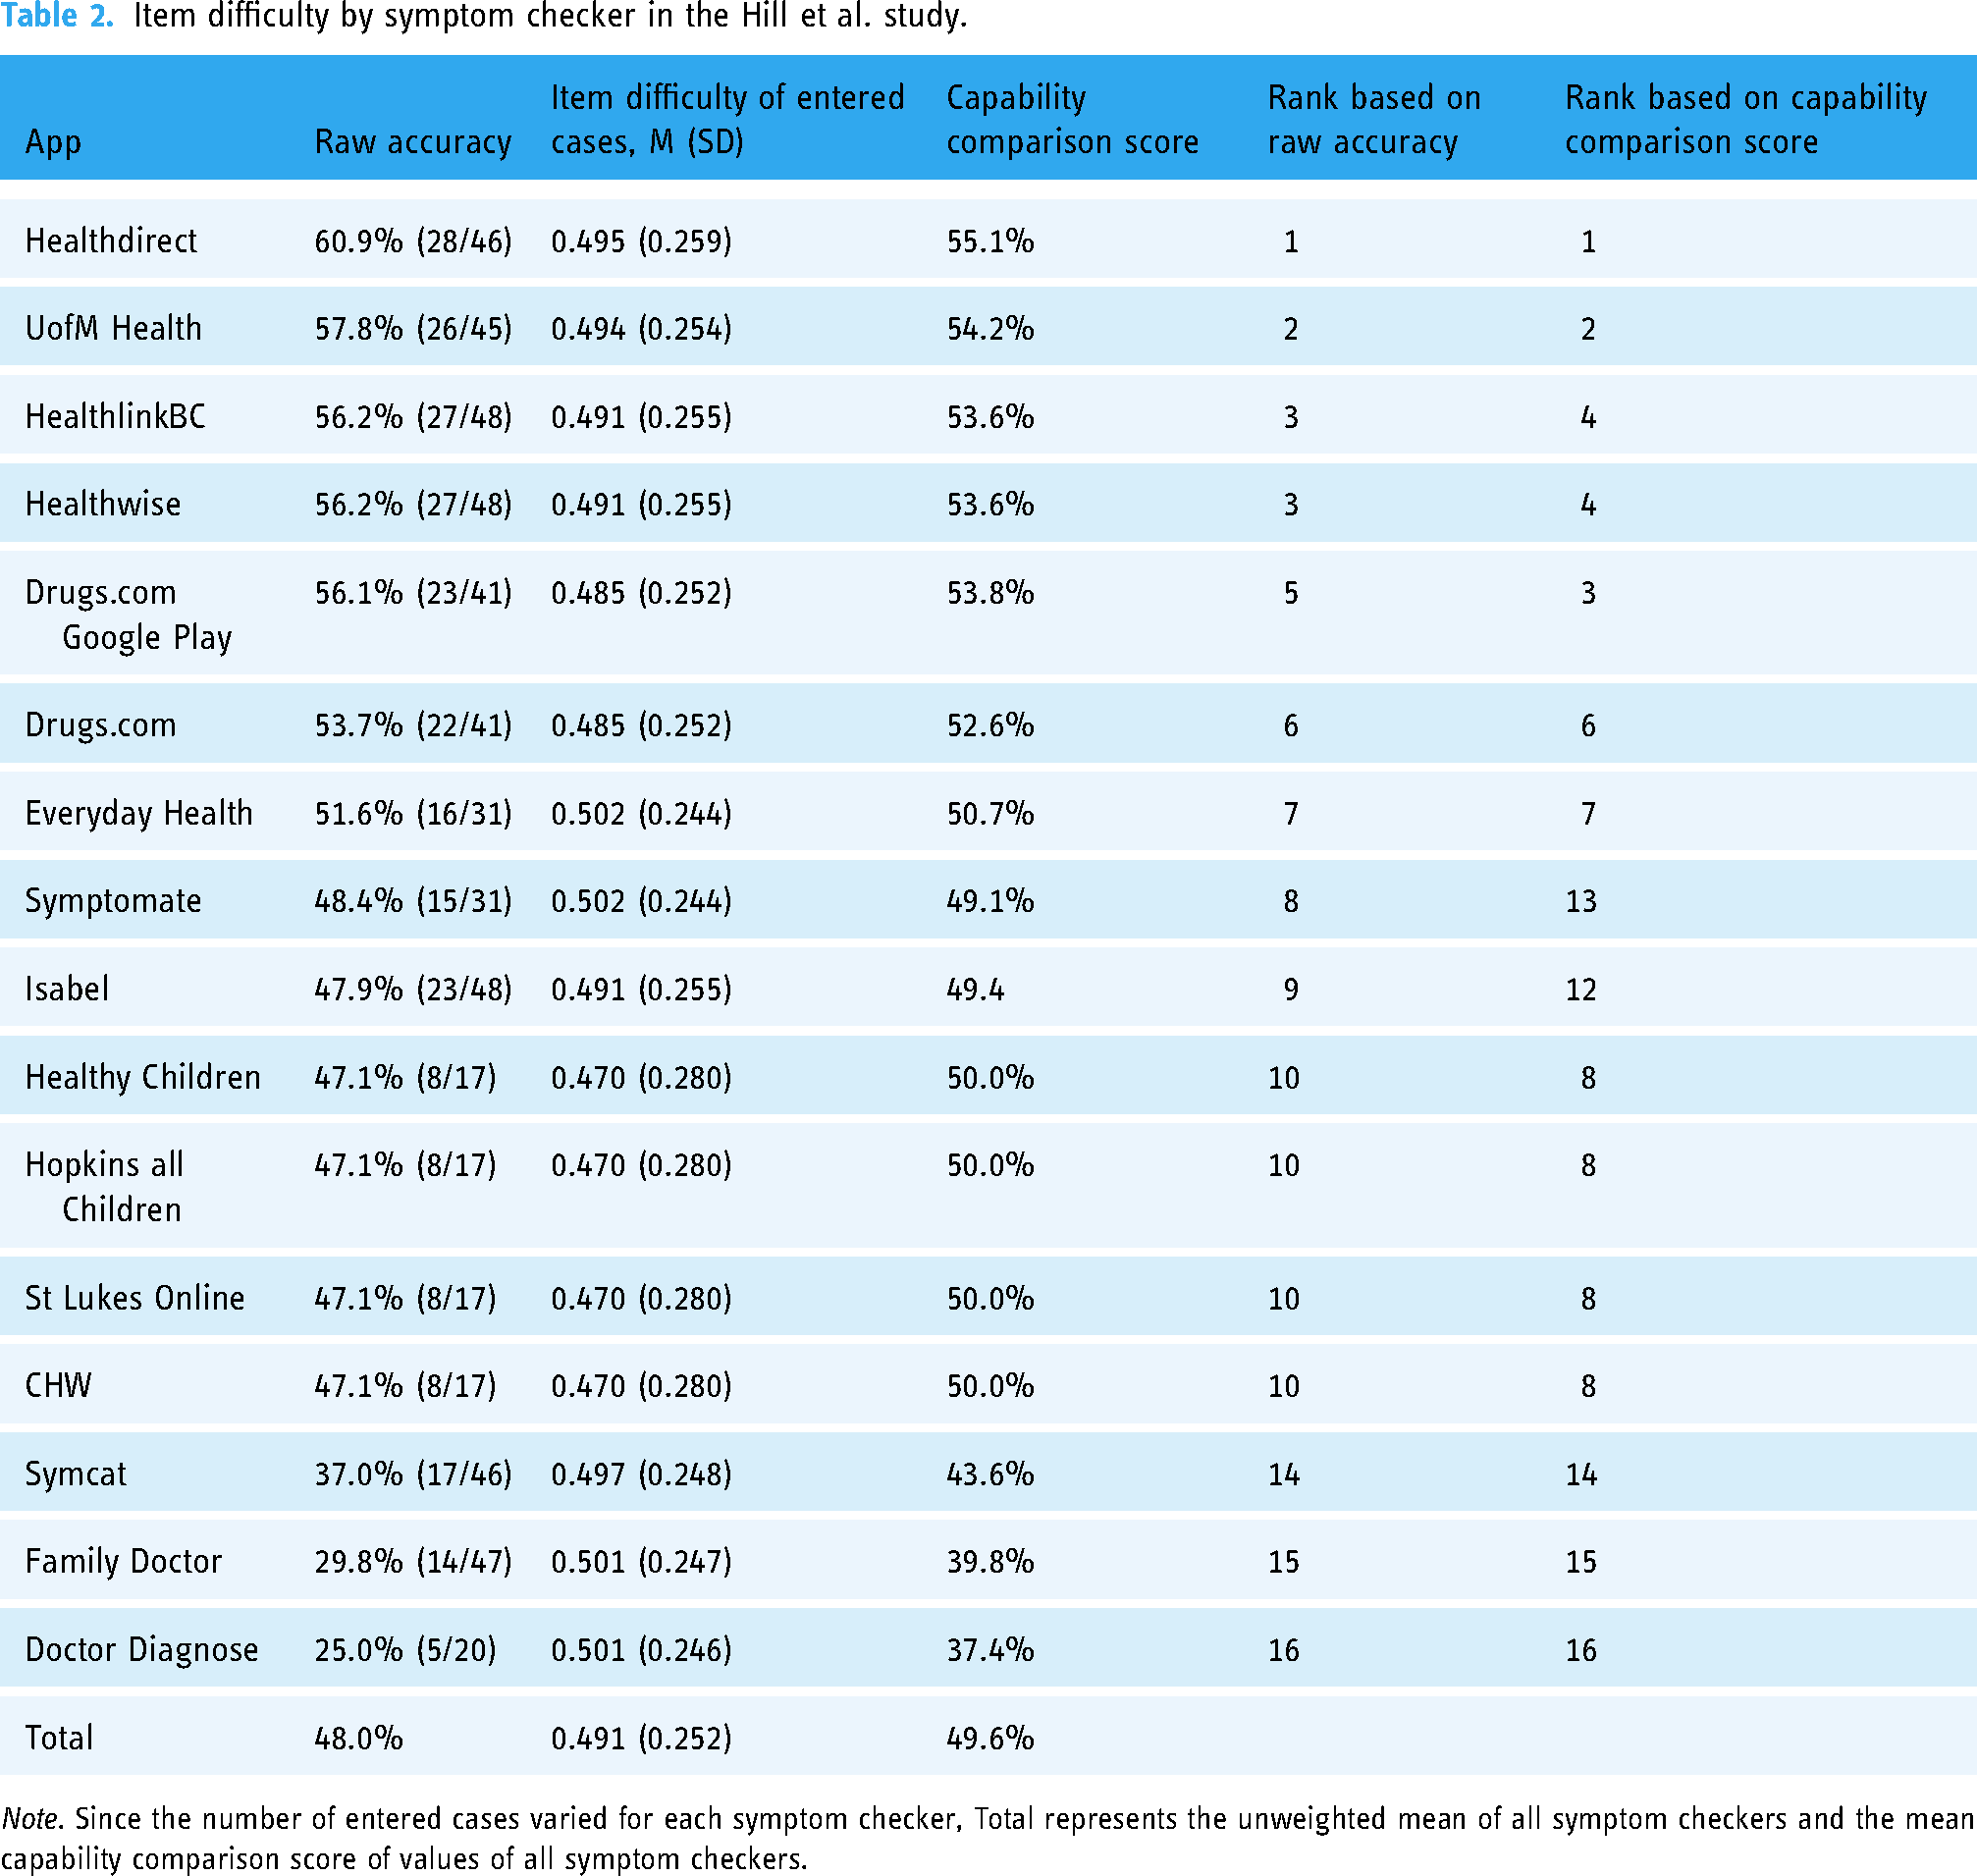
Note. Since the number of entered cases varied for each symptom checker, Total represents the unweighted mean of all symptom checkers and the mean capability comparison score of values of all symptom checkers.
Item difficulty by symptom checker in the Semigran et al. study.

Note. Since the number of entered cases varied for each symptom checker, Total represents the unweighted mean accuracy of all symptom checkers and the mean capability comparison score of values of all symptom checkers.
Capability comparison score
The mean CCS for the symptom checkers assessed in the Hill study 9 (49.6, SD = 5.15) is similar to their mean raw accuracy (48.0%, SD = 10.0%). Specifically, half of the symptom checkers (9/16) achieved a higher CCS than their raw accuracy in the Hill study, with 7 of 16 receiving a lower CCS. In contrast, the mean CCS in the Semigran study 1 (50%, SD = 6.85) is lower than the mean raw accuracy (58.0%, SD = 12.8%), see Table 2 and Table 3. In line with this, all but three apps received a lower CCS than their raw accuracy in the Semigran study. When ranked by the CCS rather than the raw accuracy, 9 of 16 and 10 of 15 symptom checkers change their rank position in the Hill and Semigran studies, respectively. Most of these rank order changes occur in the mid-tier of apps, that is, the two best or worst performing apps in each study are not affected much in terms of rank order changes.
Item-total correlation
Distribution of item-total correlation values
For some case vignettes, no ITC could be calculated because either all symptom checkers solved them correctly (HillAllCorrect = 0, SemigranAllCorrect = 3) or none did (HillNoneCorrect = 3, SemigranNoneCorrect = 1). The distribution of ITC values for the remaining vignettes is displayed in Figure 4 for both studies.

Density of item-total correlation by study.
In the study conducted by Hill et al., 40% (18/45) of case vignettes for which an ITC could be calculated had a negative item-total-correlation. Those with a positive item-total-correlation had a Median of 0.431 (IQR = 0.368). Among these, 21 had an item-total correlation above 0.2 (Mdn = 0.517, IQR = 0.271).
In the study conducted by Semigran et al., 29.3% (12/41) of case vignettes for which an ITC could be calculated had a negative item-total correlation. Those with a positive item-total correlation had a median of 0.425 (IQR = 0.236). Among these, 23 reached an item-total correlation greater than 0.2 (Mdn = 0.450, IQR = 0.171).
Notably, all emergency case vignettes (15/15) in the Semigran study presented an ITC value below 0.2. In the Hill study, the majority of emergency case vignettes (7/13) had an ITC value greater than 0.2.
To aid the reader in the interpretation of ITC values and to doublecheck the logic of the ITC, Table 4 presents the mean raw accuracies of symptom checkers solving the case vignettes with the most extreme ITC values (highest positive, highest negative and lowest ITC) correctly and incorrectly. Concordant with ITC's logic, the average raw accuracy of symptom checkers providing correct triage advice is lower than those solving it incorrectly for the vignette with the lowest ITC value, i.e., the otherwise highly performing apps fail on this case vignette, while the otherwise poorly performing apps do not. Conversely, the vignette with the highest ITC value was solved correctly by highly performing apps and incorrectly by apps of lower triage accuracy.
Characteristics of case vignettes with the highest negative ITC, lowest ITC (close to 0) and the highest positive ITC.

Accuracy adjusted by item-total correlation
Adjusting the triage accuracy of symptom checkers by excluding the vignettes with an ITC value below 0.2 changes the accuracy scores of the sample of symptom checkers in both studies: Out of the 16 symptom checkers tested by Hill et al., 81% (13/16) showed improvement, and 19% (3/16) showed a decline in accuracy when comparing adjusted to raw accuracy (see Table 5). Their average adjusted accuracy (67.9%, SD = 29.3%) is substantially higher than the average raw accuracy score reported by Hill et al. (48.0%, SD = 10.0%).
Accuracy of the symptom checkers reported by Hill et al.

Note. Because the number of entered cases varied for each symptom checker, Total represents the unweighted mean of all symptom checkers.
In contrast, in the Semigran et al. study, a minority of 40% (6/15) of audited apps showed an improvement, and 60% (9/15) showed a decline in their accuracy score when comparing adjusted to raw accuracy values (see Table 6). Accordingly, the mean adjusted accuracy (52.8%, SD = 28.4%) was below the mean raw accuracy (58.0%, SD = 12.8%) on a sample level.
Accuracy of the symptom checkers reported by Semigran et al.
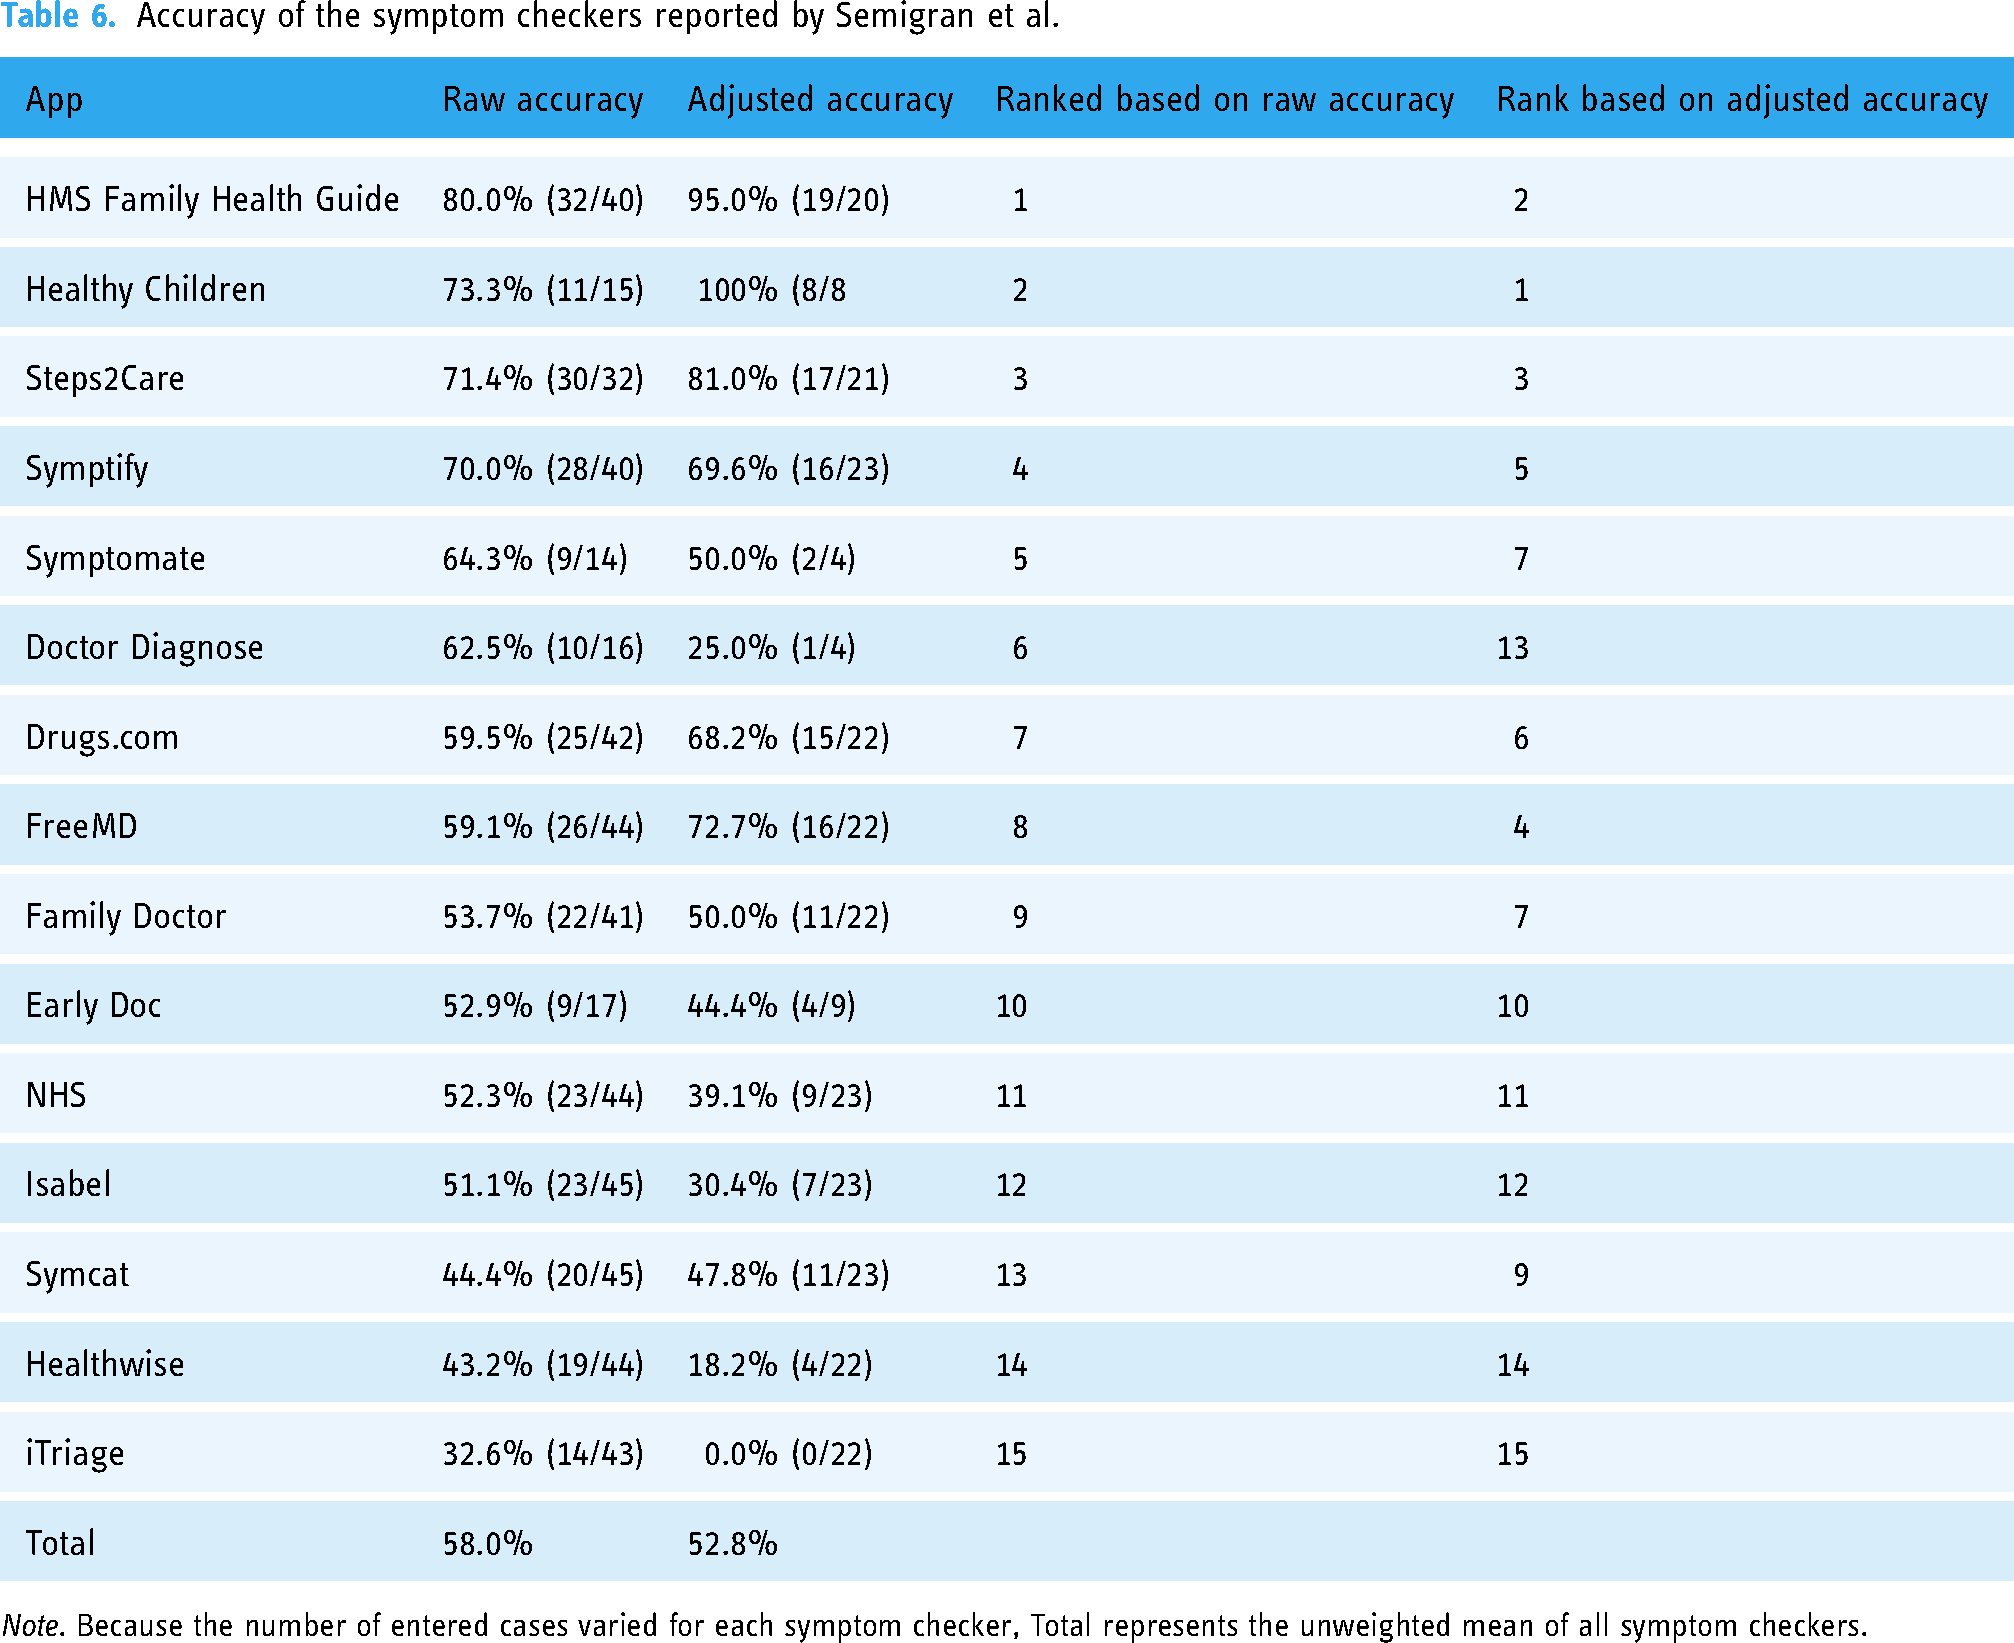
Note. Because the number of entered cases varied for each symptom checker, Total represents the unweighted mean of all symptom checkers.
Item-total correlation by triage level
When calculating the item-total-correlation by assessing the correlation of a given vignette with only the subsample of the remaining vignettes of the same triage level, the item-total correlation values are markedly higher in both studies: Few vignettes in each study show an ITC value below 0 (Hill: 11.1% (5/45); Semigran: 2.4% (1/41)) or 0.2 (Hill: 20% (9/45); Semigran: 9.7% (4/41)), see Figure 5.

Density of item-total correlation by the study for each triage level. Note. Hill et al. used four triage levels (including Non-urgent care), while Semigran et al. used three only.
Comparison of test theoretic metrics of vignettes used in both studies
The item difficulties of the 30 vignettes used in both studies were moderately correlated (r = 0.633, p < .001). Item-total correlations of vignettes used in both studies were correlated negatively, though not reaching statistical significance (r = -0.365, p = 0.073), see Figure 6.
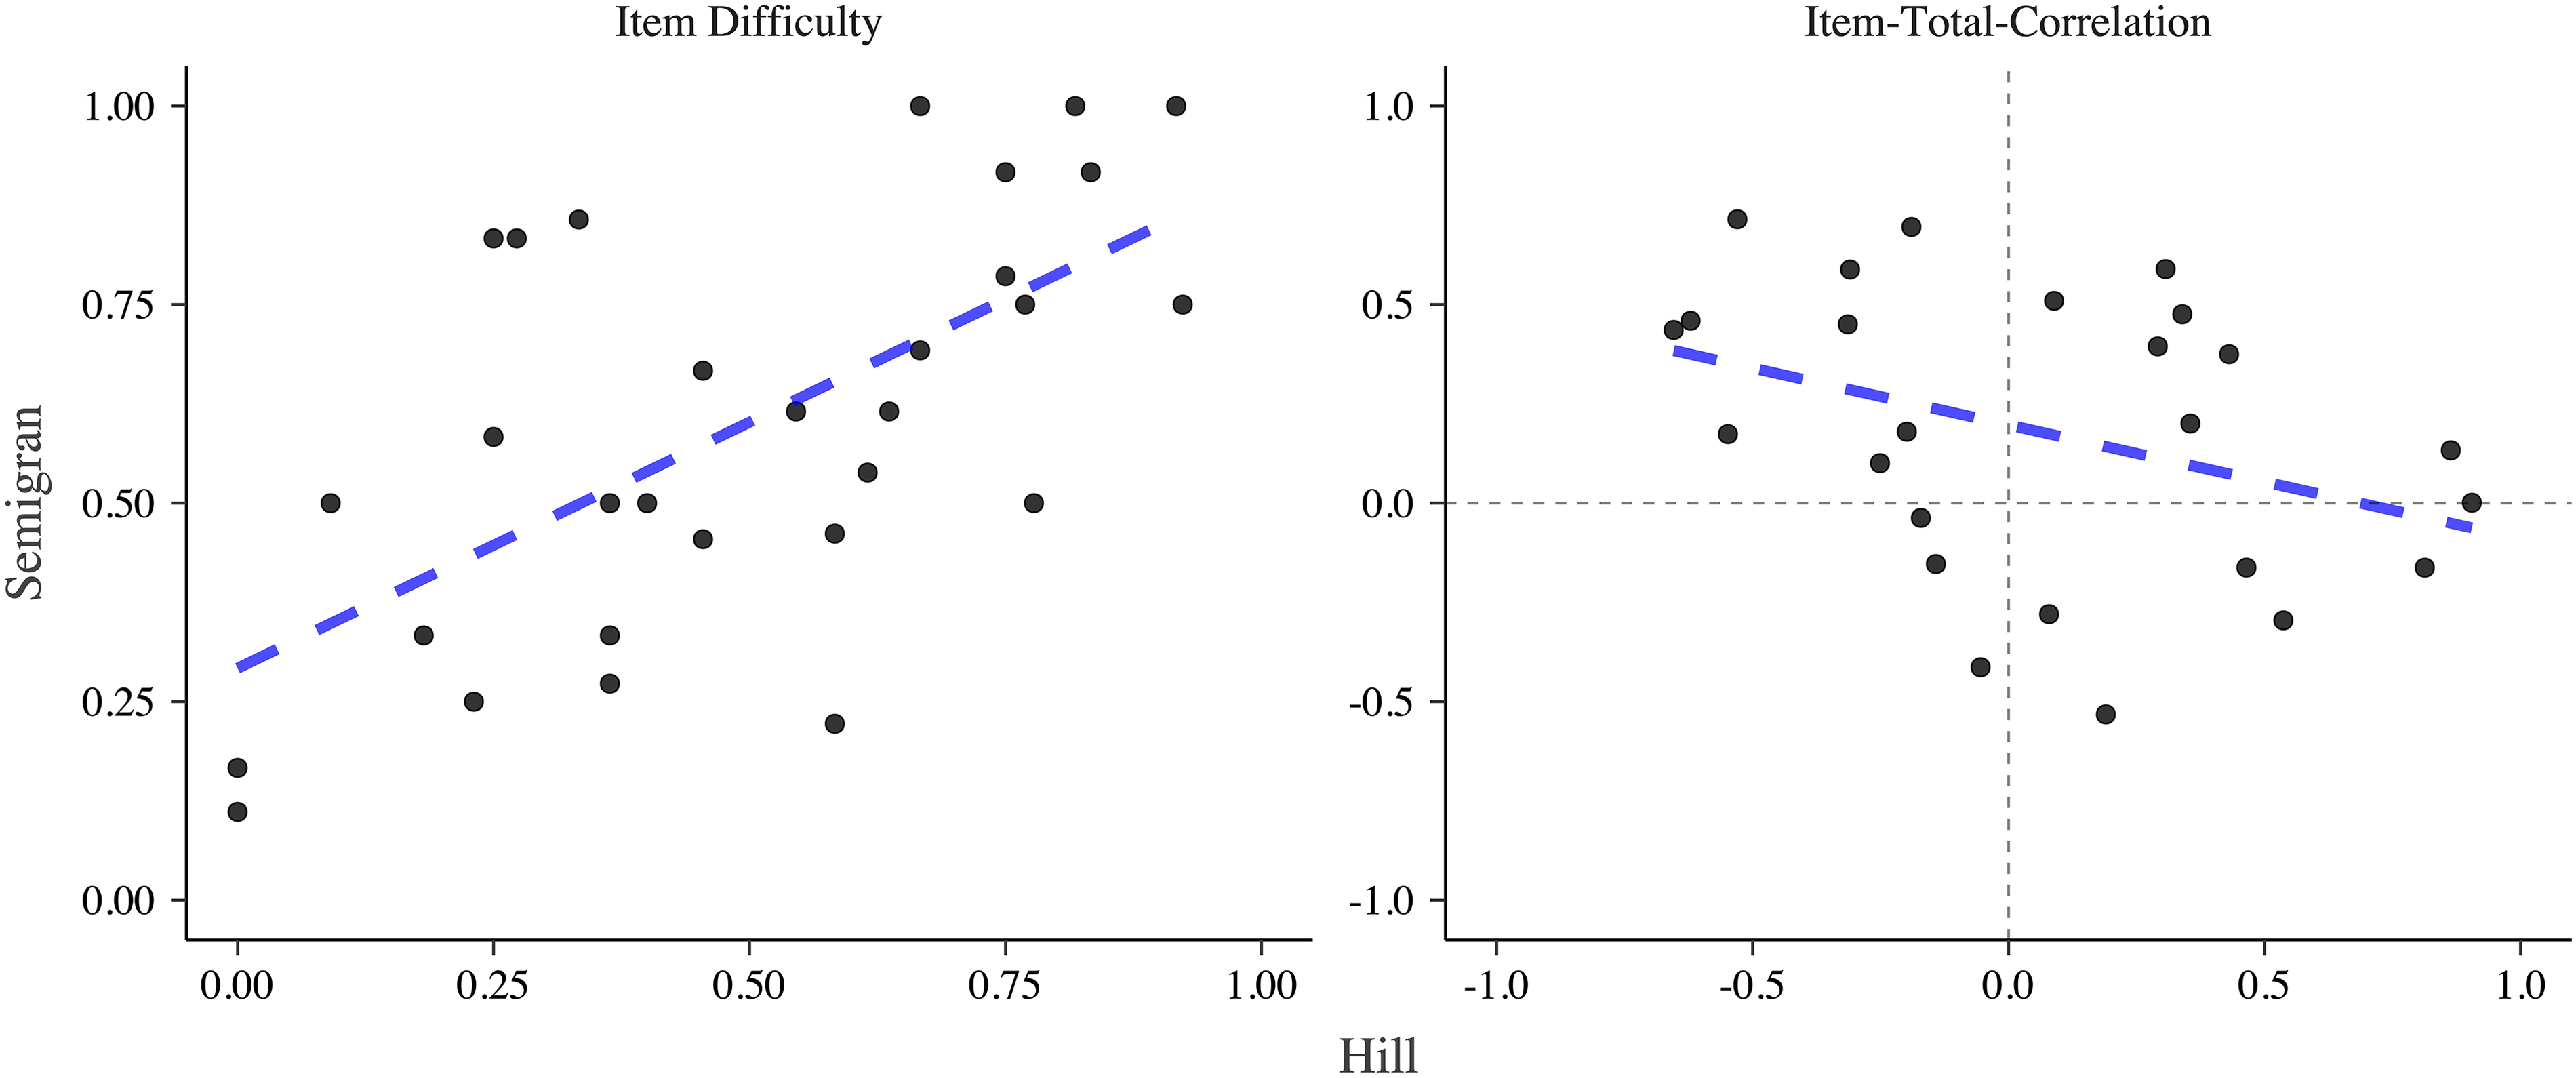
Comparison of item difficulty and item-total-correlation of vignettes used in both studies. Note. The dashed blue line indicates a linear model.
Discussion
Principal findings
Our findings based on a test–theoretic perspective identify previously undescribed limitations of the results reported by two highly influential studies on the capability of symptom checker apps. The calculated metrics, ID (together with the Capability Comparison Score) and item-total correlation (together with the adjusted accuracy), each provide different but convergent insights.
Item difficulty
The analysis of ID uncovers that the rank order concerning the competitive comparison of symptom checkers by their raw triage accuracy may be misleading: Our analyses highlight that apps were assessing not only different numbers and samples of vignettes (as already reported by Hill et al. and Semigran et al.) but these samples also differed in terms of their difficulty. For example, in the Semigran study, the app Symptomate was ranked 5 based on (raw) triage accuracy of 64.3% (9/14). The case vignettes it chose to assess, however, were more than 10 percentage points easier (i.e., having a higher ID score) than the mean ID of case vignette samples across all symptom checkers. When considering this by using the CCS to rank order the symptom checkers, Symptomate's rank dropped from 5 to 11 out of 15. With ranks for raw accuracy differing from CSS ranks for a majority of apps in both studies, the validity of the competitive ranking based on the raw accuracy of the symptom checkers is limited.
This identified limitation also impacts the interpretation of results on the sample of apps as a whole: The difference between mean raw accuracy and mean CCS values is substantial in the Semigran study. Thus, this study presumably overestimates the capability of the audited symptom checker sample based on raw accuracy. In contrast, the mean CCS for the sample of apps assessed in the Hill study is similar to their mean raw accuracy score. Consequently, the Hill study's interpretation of their sample of apps’ triage capability is seemingly less influenced by the limitation of apps selectively assessing easier and disregarding harder cases, although there are still marked changes in the rank ordering of the symptom checkers.
Item total correlation
Both assessed studies collected and curated their set of test items (i.e., the case vignettes) purposefully to include a range of rare and common case presentations with different urgency levels, with a gold standard solution provided by a panel of experts. Determining the item-total correlation of the included case vignettes identified a limitation overlooked by the current method of creating such case vignettes: Many vignettes showed ITC values below 0.2, making them unsuitable as test items according to common practice in test theory. In practice, one might still consider using vignettes with ITC values in the range of 0 to 0.2, if the sample of test items were limited. This would be the case, for instance, when re-analyzing the performance of symptom checker apps in already published studies, which use only a few vignettes. For vignette creation in future studies, vignettes with values above 0.2 should be the goal. In our re-analysis, some vignettes even showed a negative ITC, that is, overall good apps provided a false recommendation to these vignettes. Thus, based on a test-theoretic perspective, not all vignettes appear to be suitable to evaluate the accuracy of symptom checkers, and the ITC provides a theoretically grounded criterion for selecting appropriate vignettes.
Our findings further show that the results of both studies change when the pool of test items (case vignettes) is reduced to include only those with an acceptable ITC: Similar to the findings based on item difficulty, both the rank order of individual apps and the performance of the samples of symptom checkers change (with Hill's study underestimating and Semigran's study overestimating the capability of their symptom checker sample).
We can only hypothesize as to why such a high proportion of case vignettes achieves only an insufficient item-total-correlation value. First, the reason may not lie in the test items (i.e., the case vignettes), but rather in a generalized construct of triage accuracy assumed in most vignette-based studies. That is, in both studies many case vignettes achieve a low ITC value (<0.2) when considering the entire sample of vignettes. When calculating ITC values for vignettes at the same triage level, however, most vignettes achieve an ITC value greater than 0.2. Thus, case vignettes of a given triage level (e.g., emergency care) may have little or no predictive power on how a symptom checker will perform on case vignettes of a different urgency level (e.g., self-care), but an acceptable predictive power on how the symptom checkers perform on other vignettes of the same triage level. Hence, generalized triage accuracy might be a less valid construct than accuracy per triage level.
A further reason could be that despite having been reviewed by an expert panel for medical correctness, the respective vignettes may still be ambiguous. That is, they may not include all the necessary information to arrive at the gold standard solution reliably, and the gold standard solution may be dependent on contextual factors such as the healthcare system, which may or may not be considered by the symptom checkers, or the vignettes present information that can be inputted differently into different symptom checkers. For example, the vignette with the lowest ITC (n° 29 in the Hill study) describes a typical presentation of seasonal allergic rhinitis (hay fever) but does not specify whether self-treatment with an over-the-counter antihistamine would be sufficient or non-urgent care should be sought because self-treatment already failed. The negative correlation of item-total-correlation values between the Hill and the Semigran studies supports the hypothesis that ambiguity in the vignettes, inputter variation due to such ambiguity or contextual factors may all compromise the ITC of case vignettes.
A third reason explaining the low ITC values focuses on the symptom checkers, i.e., the “test subjects”. Test theory assumes that test subjects do not err at random. Instead, high-performing test subjects may struggle with difficult test items but consistently provide correct answers to easy test items. Conversely, low-performing test takers struggle even with easier items and will consistently answer more difficult items incorrectly. However, concerning triage accuracy and symptom checkers, this relationship might be different: A symptom checker might be good at triaging one category of cases (i.e., respiratory tract-related cases) but struggle with dermatologic cases, despite most other symptom checkers solving these cases correctly. Figure 1 in the appendix illustrates the following: FamilyDoctor, one of the more poorly performing apps in the Semigran study, is the only app correctly assessing the second most difficult case vignette (the most difficult case vignette was solved correctly by none of the apps). Conversely, HealthlinkBC is one of the most capable apps in the Hill study, but the only one incorrectly assessing one of the least difficult case vignettes.
The second and third hypothesized explanations are similar in that they point out that triage capability may not be a unidimensional construct, but in fact comprise several different and specialized capabilities. Consequently, rather than assessing symptom checkers’ raw triage accuracy, comparing symptom checkers based on more differentiated metrics such as sensitivity for emergencies (as a proxy for safety) or accuracy per triage level or disease type might be a methodologically sounder approach to gauge their capability. We suggest that the CSS is a relevant metric for implementing and standardizing these more nuanced assessments of symptom checker performance.
Lessons a test theory perspective can teach
Case vignette-based studies can only provide limited evidence concerning the accuracy, safety and usefulness of symptom checker apps in comparison with clinical trials. 6 Nonetheless, high-quality vignette-based assessments that are based on a test-theoretic examination and appropriate metrics still play a vital role in the process of generating evidence: firstly, case vignette-based comparisons of symptom checkers can help select the best-of-class symptom checkers before testing them in more costly and complex clinical trials. Secondly, symptom checkers as digital tools evolve quickly, and their capability and safety may change substantially with each update. Thus, inexpensive, easy-to-apply, but equally rigorous methods are needed to help developers and regulators track performance changes.
In addition to identifying the right metrics for assessment, a test–theoretic perspective can also guide the creation of the set of case vignettes, which should be marked by a balanced spread of ID and high ITC values. If the vignettes are of high quality, even a few cases might suffice to reliably estimate the capability of symptom checkers for a particular use case. This contrasts the current trend in the literature, where studies base their assessment of symptom checkers on a growing quantity of case vignettes, without scrutinizing whether they are suitable for this purpose.1,9,12,37,38
Another factor to be considered when creating a set of case vignettes is the prevalence of the diseases represented by them. In the studies by Hill et al. and Semigran et al. the case vignettes reflected both diagnoses that are common and uncommon in US emergency departments. However, the probability distribution of the vignettes was not representative of the complaints that are characteristic of any particular healthcare setting, be it the emergency department, an urgent care clinic, a primary care clinic, or the complaints laypersons typically enter into symptom checkers. 1 In order to examine symptom checkers’ capabilities, we suggest that the diseases and symptoms covered in the case vignettes should be representative of those characteristics of the targeted health care setting (e.g., patients in the emergency department, at a general practitioner, the most common symptoms or diagnoses entered in a symptom checker or disease incidence). In summary, we used a test–theoretic perspective to (a) identify previously overlooked limitations of studies using case vignettes to assess symptom checker performance. On the positive side, this approach can be used to (b) refine the sample of case vignettes (test items) and to (c) develop metrics (e.g., the CCS presented in this paper) that are more meaningful than raw accuracy values. Together, we consider these three necessary steps towards conducting symptom checker assessment studies “with greater methodological rigor and transparency” as suggested in the literature. 27
Recommendations for future audit studies on symptom checker accuracy
Based on our results, we recommend that future studies not focus solely on reporting accuracy, but on a set of different metrics. These suggestions can be seen in Figure 7.

Procedure for reporting the symptom checker performance in future studies.
While accuracy remains important and represents an easy-to-understand and communicative metric, it is conceptually fuzzy for the reasons stated above and thus misleading when used to compare the performance of different symptom checkers. Instead, reports of accuracy should be restricted to individual symptom checker performance. When it comes to comparing different symptom checkers, at least seven metrics should be reported: (a) accuracy for different (gold standard) triage levels, (b) safety of advice, (c) comprehensiveness, (d) inclination to overtriage (ratio of overtriage and undertriage errors), (e) the ID of different case vignettes used, (f) the CCS, and (g) ranks based on the CCS. The accuracy for different triage levels (a) allows readers to differentiate between performance in different use cases, e.g., detecting emergencies or advice on whether visiting a professional is indicated at all. 39 The safety of advice (b) allows readers to assess if symptom checkers give safe advice. We suggest calculating safety as the proportion of cases correctly identified as requiring emergency or urgent care. The comprehensiveness (c) can give an impression of the breadth of symptoms that can be entered into the symptom checker. It can be calculated as the proportion of case vignettes out of the vignette set that could be successfully entered. The inclination to overtriage (d) gives readers an impression of the risk-averseness of the symptom checker and can be calculated as the ratio of overtriage and undertriage errors. Since the result of undertriaging would be unsafe advice, we do not deem it necessary to report the inclination to undertriage separately when reporting the safety of advice.
Together, these metrics allow readers to gain an impression of the performance, strengths, and weaknesses of an individual symptom checker. However, they should not be used to compare symptom checkers alone. Instead, for performance comparisons, researchers should also report (5) ID and (6) the Capability Comparison Score, which takes into account that differentially difficult case vignettes were entered and that not all symptom checkers could assess all vignettes. The ID allows readers to infer potential differences in the vignettes that the symptom checkers solved. Lastly, the Capability Comparison Score presented in this paper allows researchers to compare symptom checker performance while accounting for differences in ID and included case vignettes. Thus, this metric enables comparing different symptom checkers without bias due to the selective omission of particular case vignettes.
Our findings further highlight the importance of data sharing. The strengths and limitations of vignette-based evaluation studies can only be systematically assessed and compared when authors make their data publicly available so that metrics such as ID and ITC can be calculated.
Lastly, although not directly related to the metrics reported here, there are other methodological pitfalls of using case vignettes that should be considered in future studies. Vignettes are typically entered by one clinician or researcher who might enter symptoms differently than laypeople.26,40 Since symptom checkers are aimed at non-professionals, it should be taken into account that laypersons’ inputting behavior may differ from professionals, and that such heterogeneity likely exists across laypersons, too. Another pitfall concerns the external validity of case vignettes. The vignette sets are often not representative of a targeted patient population and the content and wording are chosen by medical professionals. 40 As such, they do not represent externally valid cases because they might include information that laypeople are not aware of or omit certain information that they would include. Thus, future studies should use case vignettes based on information collected by patients making decisions about their symptom acuity. The whole vignette set should also be representative of a desired patient population.
Limitations
We could only identify two studies that satisfied our inclusion criteria. Thus—although we obtained initial findings through the presented test–theoretic analysis—our results should be validated in other symptom checker evaluation studies. This study—as most other audit studies—also could not scrutinize and control the effect of inputter variation, which relates to differences in how vignettes may be entered into the symptom checker. Inputter variation could be one reason for the negative ITC correlation we found between the two studies. To test this hypothesis, future studies should have different representatives of the target population enter case vignettes into symptom checkers and compare the ITCs between them. Furthermore, we calculated ID based on the performance of the symptom checkers, because only these data were provided in the studies. An alternative approach would be to determine the ID of a case vignette based on the performance of laypersons or healthcare professionals. While our study has focused solely on the use case of self-triage, we believe that a more rigorous underpinning can identify and help remediate similar limitations currently overlooked when determining symptom checkers’ diagnostic capabilities. Thus, our approach could be extended to and tested with respect to diagnostic capabilities. Lastly, our study includes metrics from classical test theory to evaluate case vignettes. However, these metrics are not exhaustive, and further complementary metrics for the evaluation of case vignette samples—e.g., from item response theory 41 —are conceivable.
Conclusions
Applying a test–theoretic perspective to two landmark case vignette-based studies, we identified previously unreported limitations in the assessment of symptom checker capabilities. An analysis of ID revealed that many symptom checkers’ triage ability may have been overestimated or underestimated because the authors did not consider that different symptom checkers may have been assessed with easier or more difficult case vignettes. When adjusting for this bias, the rank order of the symptom checkers differed substantially from the one presented in the original studies. The metric of ITC questions both the informative value of many case vignettes and the metric of (raw) triage accuracy used in most vignette-based audit studies.
Although the level of evidence case vignette-based studies can provide is, and will remain, limited, these types of studies will continue to play an important role in the analysis of symptom checkers: To identify symptom checkers that should be tested in more elaborate clinical trials and as a tool to monitor the development of their growing capability at regular intervals (e.g., for post-market authorization surveillance). We propose and define a Capability Comparison Score as a more nuanced metric to compare symptom checkers’ capabilities competitively. The test theoretic perspective presented here is a first step towards improving the theoretical foundations and methodology for benchmarking symptom checkers' capabilities with case vignettes, for example by putting more focus on the quality of the case vignettes rather than their mere quantity.
In summary, previous studies have disregarded both the representativeness and the psychometric properties of the chosen set of vignettes. This might to some extent mislead the public, the media and regulators about whether and which symptom checker to use or recommend. For researchers, this is a call to keep working on refining their methods. For regulators and professionals, awareness of the insufficiency of simple metrics such as accuracy is crucial when assessing symptom checkers for the purposes of certification, drafting guidelines or making recommendations to patients. For patients and the general public, our study is a cause for caution. Some symptom checkers may prove beneficial when choosing how to navigate the healthcare system and especially, when no other decision support is available. However, choosing the right symptom checker is no trivial task and, to achieve it, current research can only provide limited support.
Supplemental Material
sj-docx-1-dhj-10.1177_20552076231194929 - Supplemental material for How suitable are clinical vignettes for the evaluation of symptom checker apps? A test theoretical perspective
Supplemental material, sj-docx-1-dhj-10.1177_20552076231194929 for How suitable are clinical vignettes for the evaluation of symptom checker apps? A test theoretical perspective by Marvin Kopka, Markus A Feufel, Eta S Berner and Malte L Schmieding in DIGITAL HEALTH
Footnotes
Acknowledgements
The authors express their gratitude to Michella G Hill, Hannah L Semigran and their study teams for making their data publicly available.
Contributorship
MK, MLS & MAF had the idea for the study. MK & MLS conceived the study, designed and conducted the analyses and wrote the first draft of the paper. ESB & MAF provided critical input and worked with MK & MLS on manuscript development. All authors accept full responsibility for the final version of the paper.
Data availability statement
Since we did not collect additional data but used data that has been collected from other authors, we do not re-publish the dataset used. Generated data can be found in the Appendix.
Declaration of conflicting interests
The authors declared no potential conflicts of interest with respect to the research, authorship, and/or publication of this article.
Ethical approval
Ethical approval was not required for this study as we analyzed publicly available data that was not collected from human subjects but from publicly available symptom checker apps.
Funding
The authors received no financial support for the research and/or authorship of this article. They acknowledge support by the German Research Foundation and the Open Access Publication Fund of TU Berlin for the publication of this article.
Guarantor
MK.
Supplemental material
Supplemental material for this article is available online.
Appendix
References
Supplementary Material
Please find the following supplemental material available below.
For Open Access articles published under a Creative Commons License, all supplemental material carries the same license as the article it is associated with.
For non-Open Access articles published, all supplemental material carries a non-exclusive license, and permission requests for re-use of supplemental material or any part of supplemental material shall be sent directly to the copyright owner as specified in the copyright notice associated with the article.