
Abstract
Objective
Core stability assessment is paramount for the prevention of low back pain, with core stability being considered as the most critical factor in such pain. The objective of this study was to develop a simple model for the automated assessment of core stability status.
Methods
To assess core stability—defined as the ability to control trunk position relative to the pelvic position - we used an inertial measurement unit sensor embedded within a wireless earbud to estimate the mediolateral head angle during rhythmic movements (RMs) such as cycling, walking, and running. The activities of muscles around the trunk were analyzed by an experienced, highly trained individual. Functional movement tests (FMTs) were performed, including single-leg squat, lunge, and side lunge. Data was collected from 77 participants, who were then classified into good and poor core stability groups based on their Sahrmann core stability test scores.
Results
From the head angle data, we extrapolated the symmetry index (SI) and amplitude of mediolateral head motion (Amp). Support vector machine and neural network models were trained and validated using these features. In both models, the accuracy was similar across three feature sets for RMs, FMTs, and full, and support vector machine accuracy (∼87%) is greater than neural network (∼75%).
Conclusion
The use of this model, trained with head motion-related features obtained during RMs or FMTs, can help to accurately classify core stability status during activities.
Introduction
Core stability is regarded as the ability to control the position of the trunk relative to the pelvic position,1–3 which helps to maintain balance and a stable posture. Poor core stability alters trunk motion patterns and can result in musculoskeletal injury or pain.4–6 Therefore, core stability assessment is important for the prevention of musculoskeletal injury and pain. 7 The incorporation of core stability into rehabilitation and training programs may allow some individuals to improve their core stability before injury onset. However, the requirement for specialized equipment to measure muscle contractions (e.g. electromyography or ultrasound machines)8–13 and the need for highly experienced operators to conduct clinical tests hinder assessments of core stability.14–17
Research over the past decade has utilized inertial measurement units (IMUs) for the assessment of various tasks such as functional movement tests (FTMs), walking, running, and single-leg squats (SLS).18–23 This emerging trend in literature is partly driven by the advantages of IMUs, including their portability, low cost, and ability to provide real-time feedback.24,25 Even ear-worn sensors or head-worn sensors have been employed in recent studies for gait analysis and balance assessment, further illustrating the versatility of this technology.26,27 Although these studies were not primarily focused on the assessment of core stability, they have gradually expanded the scope of IMU applications in the field.
Trunk symmetry and range of motion during distal extremity movements can serve as indices of core stability. To achieve core stability, core muscle activities should involuntarily occur prior to the movement of distal extremities.28–31 For example, rapid arm raising involves core muscle contractions that begin prior to movement.30,32 These preprogrammed, feedforward core muscle contractions provide the postural stability necessary for distal extremity movements.29,33,34 Insufficient core stability leads to an abnormal range of reactive trunk motion. Low back pain patients exhibit abnormal core muscle activation; similarly, cyclists with low back pain showed a loss of co-contraction of core muscles during trunk motion. 35 Individuals with low back pain also exhibit asymmetrical trunk motion during sitting and standing. 36 An unstable core can lead to low back pain and kinematic asymmetry during movements of the distal segment of the trunk.
A recently developed automated assessment system acquires information that aids clinical decision-making through joint kinematics (measured by an IMU) and sensors worn on the body during FMTs.37–40 This information can be used to develop machine learning models. In most studies using this system, greater than or equal to three sensors were placed on several joints to obtain kinematic data.39,40 However, this method is not user-friendly; the sensors must be attached to bare skin or tight clothing to minimize the effect of cloth motion. To overcome this limitation, we developed a system that measures the symmetry index (SI) and amplitude (Amp) of mediolateral head motion using an IMU sensor equipped with an easy-to-use wireless earbud (Figure 1). According to Morrison et al. (2015), head angle serves as a proxy for trunk motion during rhythmic movements (RMs); mediolateral head motion is associated with mediolateral trunk motion during gait. Our system for measurement of mediolateral head motion could replace existing systems that measure trunk motion, although the wireless earbud has only one IMU sensor

IMU sensor worn during motor tasks. Each participant wore a wireless earbud equipped with an IMU sensor in the left ear to measure head motion during the performance of motor tasks. IMU: inertial measurement unit.
This study evaluates a novel approach to core stability assessment by developing an automated system that leverages a combination of modern technology and machine learning algorithms. The novelty of this study lies in the use of a wireless earbud equipped with an IMU sensor, designed to measure the SI and Amp derived from the head angle during motor tasks. This head angle serves as a proxy for trunk motion, thus providing indirect measures of core stability.
We hypothesized that this proposed system could effectively assess core stability and categorize individuals into good and poor core stability groups based on these measurements. Participants performed motor tasks that trigger reactive trunk movement, such as cycling, walking, and running. Mediolateral trunk motion, which arises in response to the reaction force during these tasks, is dependent on core stability. This was also demonstrated in FMTs, such as SLS, lunge, and side lunge, where controlled trunk motion is essential to maintain balance and prevent falling.
Participants initially underwent the Sahrmann core stability test (SCST), administered by a highly trained, experienced operator, which objectively evaluates core stability. Based on their SCST scores, participants were then categorized into good and poor core stability groups. Subsequently, the SI and Amp were extracted from the head angle measurements obtained during the motor tasks, resulting in three sets of labeled data: a full feature set, a RM feature set, and an FMT feature set. Each feature set was utilized to train and validate machine learning models. To our knowledge, this study is among the first to apply machine learning models for such a purpose, marking a significant step forward in the field of core stability assessment.
Methods
This study is a cross-sectional investigation designed to evaluate the different machine learning classifiers in predicting core stability status. The study involved a total of 77 participants, who were assessed on their core stability using the SCST. Participants then performed a series of FMTs and RMs, during which mediolateral head angle data were recorded using an IMU. Three different feature sets were derived from these data, and support vector machine (SVM) and neural network (NN) were trained on these features to predict core stability status. The performance of these machine learning models was assessed through various metrics including accuracy, sensitivity, specificity, and G-index (Figure 2).

Flow diagram illustrating the methodological process of the study. The process starts with the recruitment of participants, followed by the assessment of their core stability using the SCST. The participants then performed FMTs and RMs, while the mediolateral head angle data were recorded using an IMU. These data are used to derive three different feature sets, which are utilized in the training of SVM and NN models. These models are validated using a leave-one-out method, and their performance is assessed in terms of accuracy, sensitivity, specificity, and G-index. FMTs: functional movement tests: IMU: inertial measurement unit; NN: neural network; RMs: rhythmic movements; SCST: Sahrmann core stability test; SVM: support vector machine.
Participants
We enrolled 77 participants in this study (31 men and 46 women; mean age, 23.1 ± 2.2 years; mean body weight, 63.0 ± 13.3 kg). The exclusion criteria were as follows: overweight; current pregnancy; psychological, neurological, vestibular, or cardiopulmonary disorder; and musculoskeletal pathologies. All participants provided demographic information and visual analog scale pain scores. Anthropometric data were also obtained, including height and weight. All participants provided written informed consent, and the study protocol was approved by the Institutional Review Board of Jeonju University.
Sahrmann core stability test
Each participant completed the SCST as an objective measure of core stability (Figure 3). The SCST comprises five tasks of increasing difficulty. The inflatable pad of a pressure biofeedback unit (Stabilizer; Chattanooga Group, Inc., Hixson, TN, USA) was placed in the natural lordotic curve when the participant was in the supine position. After the pad had been inflated to 40 mmHg, the participant began the SCST. When the participant had completed one of the SCST tasks with a deviation of ≤10 mmHg, the next task began. Task performance was scored using a 5-point scale. Participants with scores <2 were assigned to the poor core stability group, whereas participants with scores of 2–5 were assigned to the good core stability group.
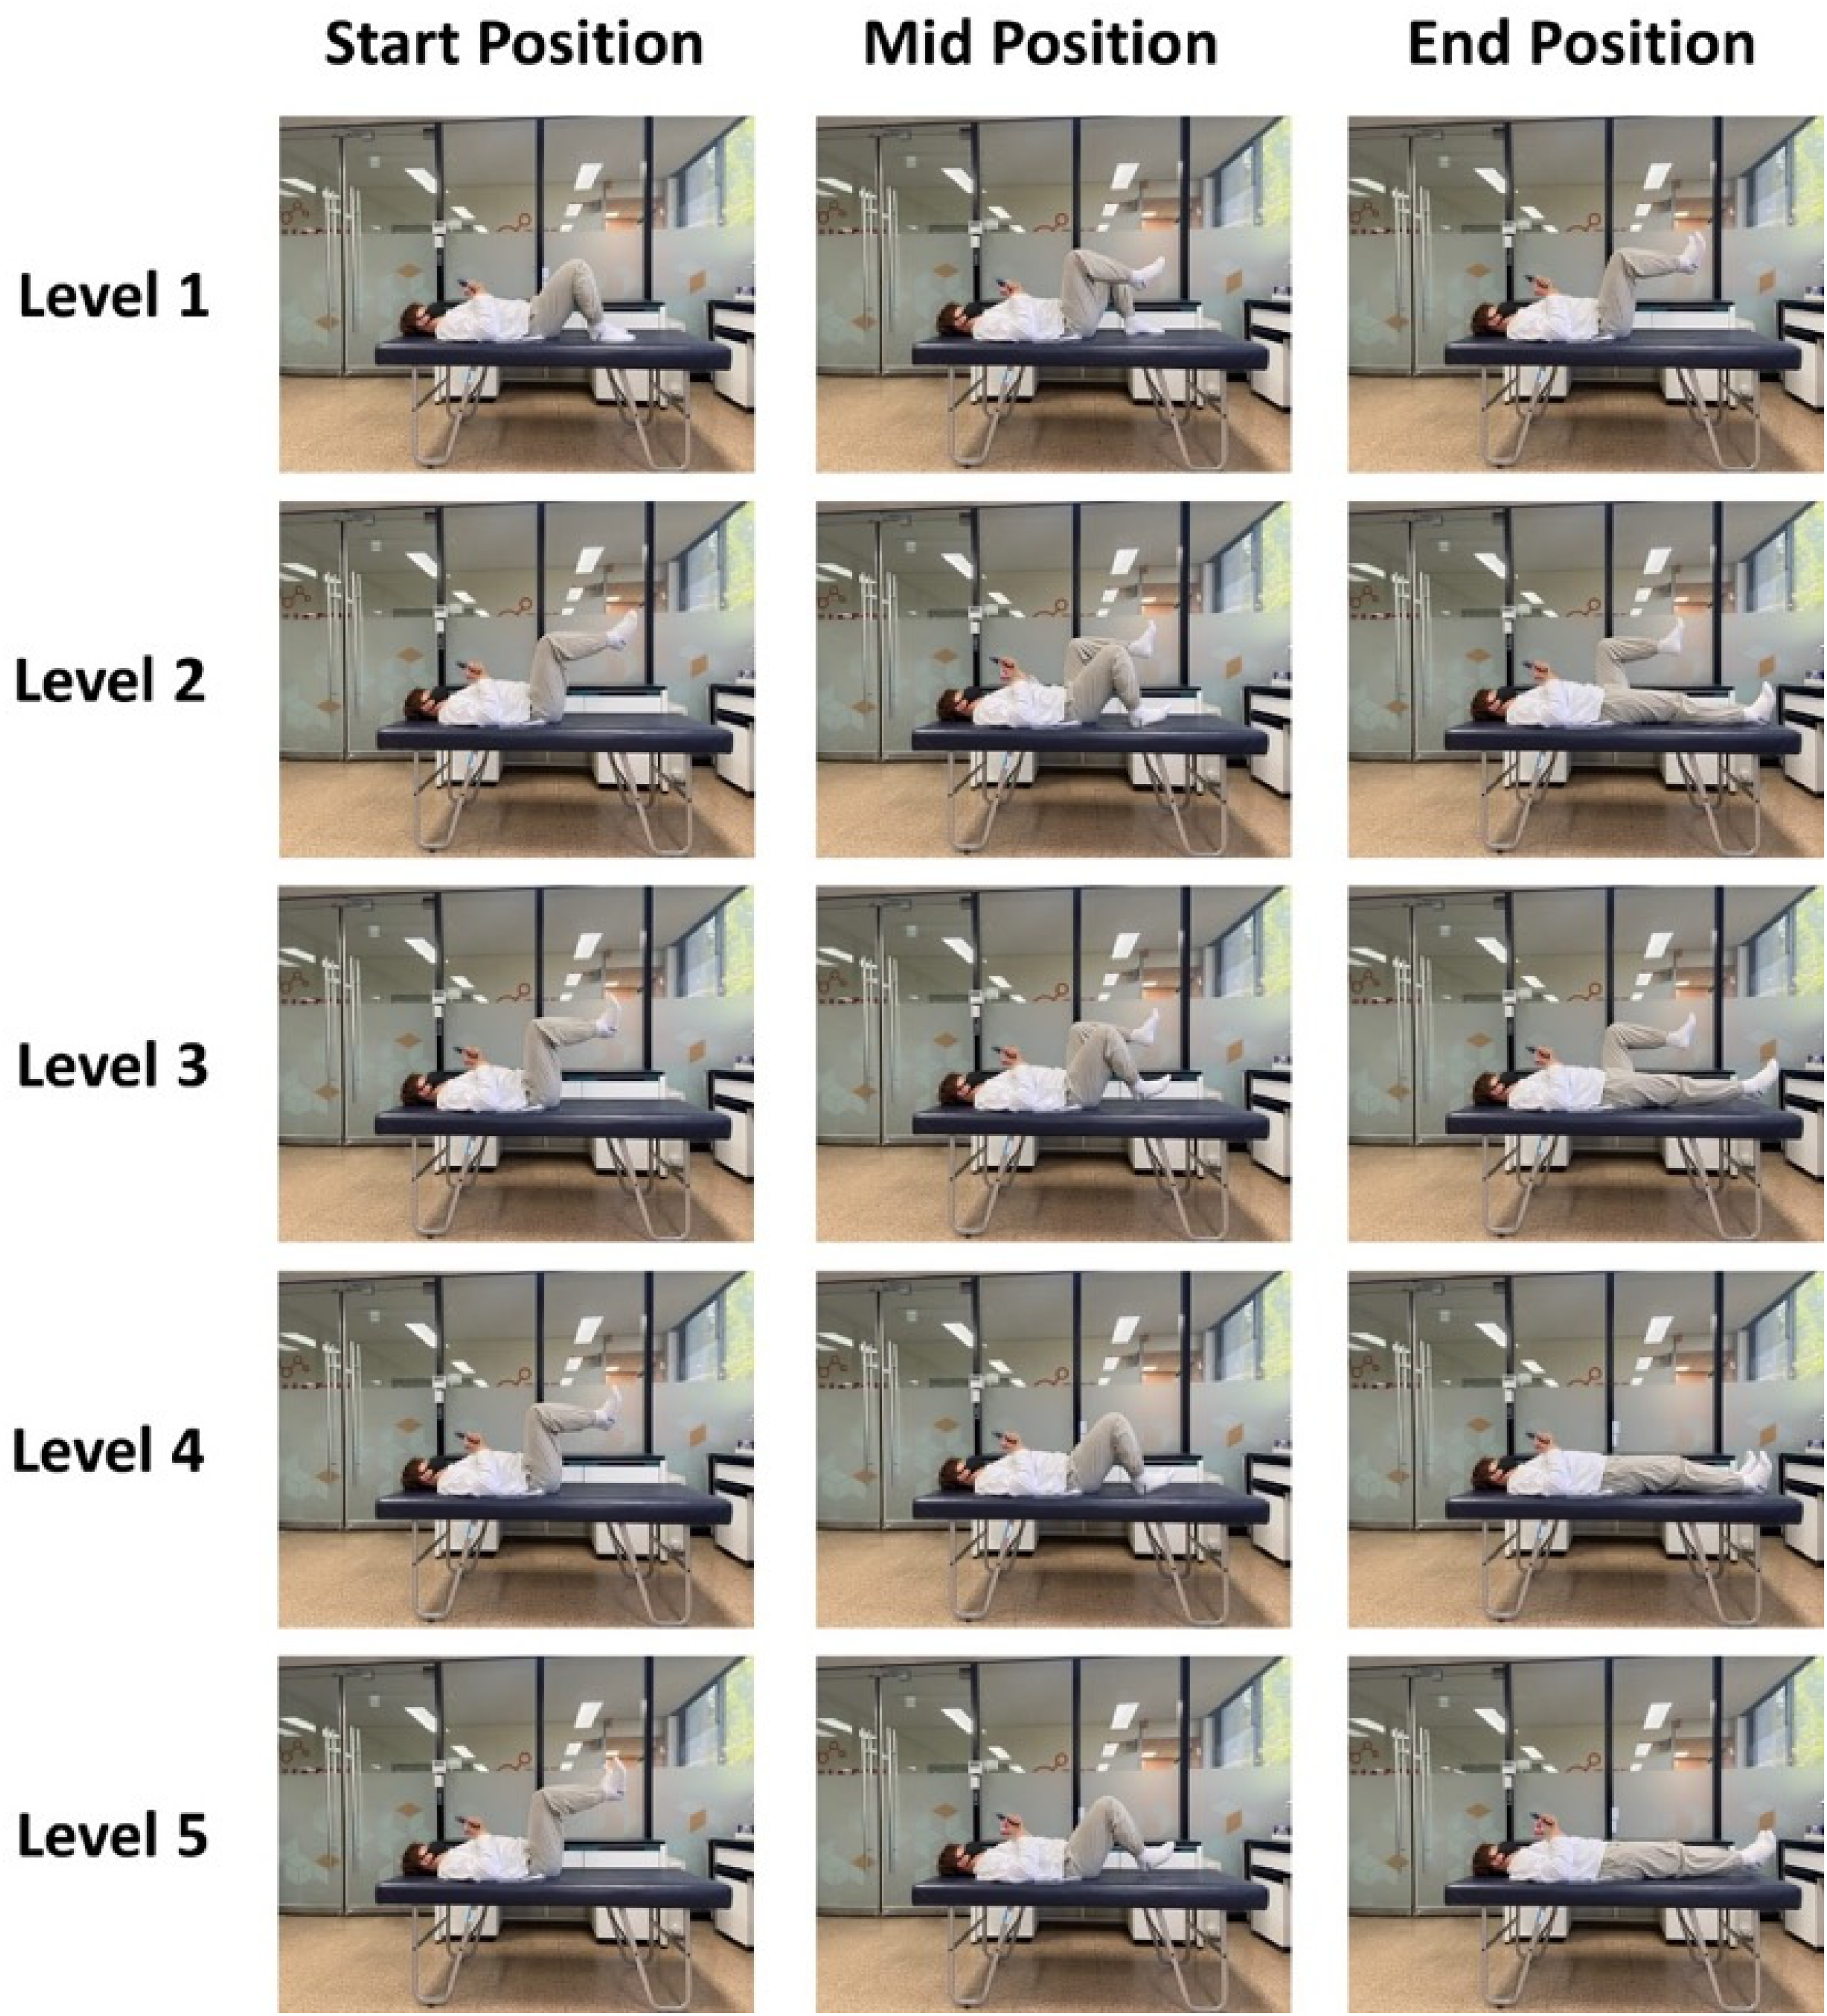
The five levels of the Sahrmann core stability test.
Rhythmic movements
Cycling
As a warm-up activity, each participant cycled for 5 min at their preferred speed, followed by a 5-min rest period; the participant was then asked to cycle as fast as possible. The fastest measured speed was used to calculate the target speed (70% of the fastest speed). The participant then cycled for 1 min at the target speed (Figure 4A, left panel).

Motor tasks. Each participant performed RMs (A) and FMTs (B) while wearing the wireless earbud. (A) RMs included cycling, running, and walking. Each participant performed each motor task for 1
Walking and running
The walking and running speeds were set as 4.5 and 9 km/h, respectively, and each participant performed a 30-s practice session to ensure familiarity with these speeds. After the practice session, the participant was asked to walk and run for 1 min on a treadmill (Xiaomi, Inc., Beijing, China) at the predefined speed (Figure 4A, middle and right panels).
Functional movement tests
Single-leg squat
Each participant performed five repetitions of the SLS, with both the left and right legs. The participant began in a standing position with the toes of the weight-bearing leg pointing forward, hands on the waist, and nonweight-bearing leg flexed at the knee (at 90°). The participant was then instructed to lift the heel while performing the SLS, without losing their balance (Figure 4B, right panel). In the event that a participant did not follow the instructions or the nonweight-bearing leg contacted the ground, the trial was considered unsuccessful and the participant was asked to perform it again.
Side lunge
Each participant performed five side lunges on both the right and left sides. Both start and end positions for the side lunge comprised standing upright with both feet together and hands on the waist. From the starting position, the participant lunged to the side and then pushed back to the starting position. The stride length was the length that allowed both feet to point forward with the knee of the front leg flexed at ∼90° while remaining over the foot, with the back leg oriented in a straight position (Figure 4B, middle panel). If the participant lost their balance, they were asked to perform the side lunge again.
Lunge
Each participant performed five lunges with both the right and left legs. Both start and end positions comprised standing upright with the toes pointing forward and hands on the waist. The stride length during the lunge was the length that allowed 90° knee flexion for both legs (Figure 4B, left). All participants were able to complete the lunges without loss of balance.
Data collection
A high-resolution IMU (BNO080; Ceva Technologies, Rockville, MD, USA) was used for head angle measurements. The IMU sensor was embedded into a left-sided wireless earbud (QCY-T1C; Dongguan Hele Electronics, Dongguan, China) (see Figure 1). The acceleration data were transferred to a self-developed mobile app via Bluetooth at 100 Hz. This app computed the mediolateral head angle in real time, using methods established in previous studies.41,42 Each sample carried signed 16-bit acceleration outputs for all three axes x, y, and z. These acceleration outputs were scaled to equate to a proportional value of Earth's gravity (Gpx, Gpy, and Gpz). The full-scale IMU sensor value was equivalent to the maximum singed 16-bit integer value at 8 G.
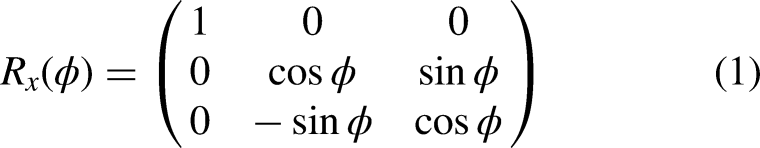
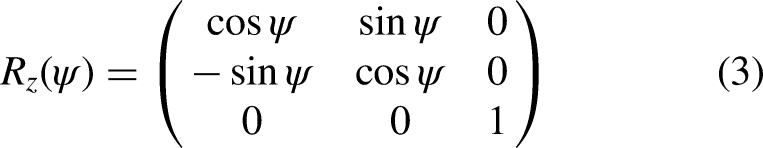
The IMU's orientation can be delineated using its roll (ϕ), pitch (θ), and yaw (ψ). The corresponding matrices for roll, pitch, and yaw are as follows (equations 1–3):


For calibration of offsets, an initial 1-s measurement was taken. The average offsets recorded in the sagittal and frontal angles during this time were utilized for offset removal. During this 1-s calibration period, the subject was instructed to stay still, while 100 data samples were gathered and evaluated for calibration accuracy. Calibration was considered successful only if the difference between the maximum and minimum values of both ϕ and θ was less than 0.5°. If this condition was not met, the testing process restarted from the calibration stage. Each participant wore the wireless earbud while performing the RMs and clinical tests (Figure 5). Frontal plane head angle data were collected at 100 Hz.

Example mediolateral head angle data obtained during RMs (A) and FMTs (B). (A) Each participant performed RMs, including walking, cycling, and running, for 1
Feature extraction
Two features were extracted from mediolateral head angle data recorded during the FMTs and RMs: the SI and Amp. During the FMTs, participants performed SLS, lunge, and side lunge exercises (five repetitions of each) with both the right and left legs. When performing the SLS and lunge, the head was tilted to the same side as the weight-bearing leg side; it was tilted to the opposite side during the side lunge. The maximum head angles on the right and left sides were determined for each trial. The mean Amp was calculated by summing the maximum right and left head angles during cycling (five trials) (Figure 6):


Mediolateral head angle during walking. Each participant walked for 1
where leftmax, leftmin, and leftmean represent the maximum, minimum, and mean values of five maximum left head angles, respectively; rightmax, rightmin, and rightmean indicate the maximum, minimum, and mean values of five maximum right head angles, respectively.
The SI during the FMTs reflected the difference between the left and the right maximum head angles (Figure 6):


Mediolateral head angle during SLS. Each participant performed five repetitions of the SLS exercise at their preferred speed. Angles above and below 0° represent left and right head tilt directions, respectively. The left (upper circles) and right (lower circles) peak angles for each SLS repetition were used to calculate the SI and Amp of the head angle in the frontal plane. A SI value of 0° indicates perfectly symmetrical mediolateral head motion. The mean SI and Amp for the five SLS repetitions were calculated, and the maximum and minimum SI and Amp were extracted. Amp: amplitude; SLS: single-leg squat; SI: symmetry index.
where left i and right i represent the maximum left and right values for the ith cycling trials, respectively, and n is the total number of trials.
The SI during RMs was also calculated from the maximum right and left head angles obtained over a 1-min period for each cycling trial (Figure 7):


Feature set
For both the FMTs (SLS, lunge, and side lunge) and RMs (cycling, running, and walking), the maximum, minimum, and mean Amp and SI values were used to derive three feature sets (Table 1):
- A full feature set including all Ampmax, Ampmin, Ampmean, SImax, SImin, and SImean values from the FMTs and RMs, as well as the maximum cycling speed (37 features). - A feature set including the Ampmax, Ampmin, Ampmean, SImax, SImin, and SImean values only from the FMTs (18 features). - A feature set including the maximum cycling speed and Ampmax, Ampmin, Ampmean, SImax, SImin, and SImean values only from the RMs (19 features).
Feature sets used for model training.

FMTs: functional movement tests; IMU: inertial measurement unit; RMs: rhythmic movements.
Two-class classifiers: training and validation
Two-class classifiers were trained to determine core stability status. Using MATLAB R2022a software (MathWorks, Natick, MA, USA), six models were generated: SVM, decision tree, discriminant analysis, logistic regression, naïve Bayes, k-nearest neighbor, and NN models. The SVM and NN models exhibited the best classification performance, and we only report the results for these classifiers below.
Before model training, oversampling was conducted to balance the number of samples in the poor and good core stability groups, as the good core stability group initially had more samples. Specifically, we implemented random oversampling, a technique that works by duplicating examples from the minority class in the training data set. In this method, samples from the minority class (in our case, the poor core stability group) are selected at random and added to the training data set, increasing its size and thus balancing the class distribution.
Achieving balancing the class distribution can enhance the performance of the machine learning model, 43 particularly in our case where the data imbalance was significant. It's important to note that this method may increase the likelihood of overfitting since it duplicates the minority class events. However, to mitigate this potential issue, we repeated the procedure 10 times, which helped ensure a more diverse set of minority class examples in the training data set, thus reducing the probability of overfitting.
SVM models search the optimal hyperplane at the point where the margin between two classes of data is maximal. According to Ganyun et al. (2005), SVM models are appropriate for small data sets. 44 Our SVM model was implemented in MATLAB with the “fitcsvm” function. We employed a Gaussian (also known as radial basis function (RBF)) kernel function due to its flexibility in handling nonlinear classification problems. The RBF kernel introduces nonlinearity without needing to increase the computational cost excessively. The kernel scale parameter was set to 1.1, controlling the sensitivity of the Gaussian kernel and indirectly influencing the decision boundary.
The NN model was trained using MATLAB's “fitcnet” function. The model consisted of an input layer, three hidden layers, and an output layer. The input layer was designed to accommodate the dimensionality of our feature set. Each hidden layer contained 10 neurons, with the Rectified Linear Unit (ReLU) activation function applied to their outputs. This nonlinear activation function introduces nonlinearity into our model, helping it learn from the complex relationships in our data. The output layer of the NN was designed to classify each sample into one of the two classes: “good” and “poor.” Although this is a binary classification task, MATLAB's “fitcnet” function defaults to the softmax activation function for the output layer, regardless of the number of classes. This is because softmax is a more general function that is used for multiclass classification problems, and it simplifies to the sigmoid function in the case of binary classification. To optimize the weights of the NN, the “fitcnet” function uses an iterative training process with a maximum iteration limit of 1000. This function automatically manages the batch size and the number of epochs for training, based on the size of the training data.
Leave-one-participant-out cross-validation was used to evaluate the accuracies of all models. This validation method is appropriate for small sample sizes, 39 as in our study. The model was trained using the full data set after exclusion of one participant's data; the trained model then labeled the data of the excluded participant based on the input.
Performance evaluation
Model performance was evaluated by comparison of predicted and actual labels. Accuracy, sensitivity, specificity, and precision values, as well as the F1-score and G-index, were calculated as follows:


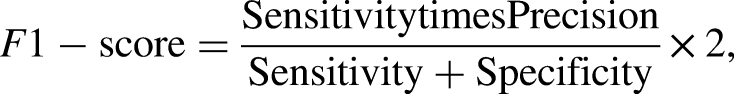

where TP is true-positive (number of participants correctly included in good core stability group), TN is true-negative (number of participants correctly included in poor core stability group), FP is false-positive (number of participants incorrectly included in good core stability group), and FN is false-negative (number of participants incorrectly included in poor core stability group).
The SVM and NN binary classifier models were run 10 times, and the results are reported as means and standard deviations.
Results
Demographic data
There were no significant differences in age, height, weight, body mass index, or visual analog scale pain scores between the good core stability and poor core stability groups (Table 2).
Demographics of good core stability and poor core stability groups.

BMI: body mass index, VAS: visual analog scale.
Classification accuracy
The results of leave-one-participant-out cross-validation are reported in Table 3. Compared with the NN model (73.7 ± 3.6%), the SVM model showed higher classification accuracy (86.6 ± 1.7%) in the RM feature set (Table 3). The SVM model also showed better specificity, precision, F1-score, and G-index values for all feature sets; however, the NN model had higher sensitivity (Table 3). The SI and Amp of mediolateral head motion during the SLS were extracted from the FMT data set; the SI and Amp of mediolateral head motion during cycling, walking, and running were extracted from the RM data set. The SVM and NN models both exhibited better performance when trained on the RM feature set, compared with the FMT and full feature sets.
Accuracy, sensitivity, specificity, precision, F1-score, and G-index values of neural network and support vector machine models used to classify participants according to core stability status.

FMTs: functional movement tests; RMs: rhythmic movements; NN: neural network; SVM: support vector machine.
Discussion
This study was conducted to develop machine learning models that could classify young people without musculoskeletal disorders according to core stability status, as determined using the SCST. Among the 77 participants, 49 and 28 were classified into good core stability and poor core stability groups, respectively. There were no significant demographic differences between the groups, which minimized the risk of confounding bias. The SI and Amp of mediolateral head motion extracted during the FMTs and RMs were used to train SVM and NN models. Model classification accuracy was similar across all three data sets (full, FMT, and RM), and the SVM model showed superior performance compared with the NN model.
In this study, we achieved high classification accuracy (∼85%) with the SVM model, even without using variables such as jerking movements, acceleration, or velocity that previous studies have used.37–39,45 The novelty in our approach was the use of mediolateral head motion during RMs, as a proxy for trunk motion and thus, core stability. It implies that head motion during RMs, as measured by our system, is reflective of the preprogrammed, feedforward contractions of the core muscles that provide postural stability necessary for distal extremity movements.29,34 These contractions have been previously found to be closely related to core stability, particularly during the movement of distal extremities.
We examined the classification performance of SVM and NN models using different feature sets to identify individuals with good or poor core stability. Interestingly, we found that all feature sets produced similar accuracy levels in both models. These results suggest that the chosen features may not have a significant impact on the classification performance of the models and that a simpler feature set may be sufficient for accurate classification of core stability status. However, it is important to consider that the nature of the tasks during which the features are measured may influence the involuntary reactive trunk motion and, thus, the accuracy of core stability assessment. For example, the use of different FTMs or exercises could result in different levels of trunk motion, affecting the classification accuracy. Further investigation is needed to determine the most appropriate feature set and task for accurate classification of core stability status.
The SVM model achieved a G-index close to 0.25, which is typically considered indicative of a well-optimized model. 46 It also exhibited very high specificity and precision but relatively lower sensitivity, resulting in a higher number of false negatives. This means that a significant number of individuals with good core stability were misclassified as having poor core stability. However, the high specificity and precision suggest that those identified as having poor core stability are very likely to actually have poor core stability. Therefore, the SVM model could be useful in identifying individuals with poor core stability but may need to be combined with other measures to accurately identify those with good core stability. In contrast, the NN model showed a more balanced number of false positives and false negatives, indicating that it may be better at accurately identifying individuals with good core stability. However, the lower specificity and precision suggest that individuals identified as having poor core stability may not necessarily have poor core stability. Therefore, the NN model could be useful in identifying individuals with good core stability. Overall, these findings suggest that both models have their strengths and weaknesses and that combining them could result in a more accurate classification of core stability status.
While studies specifically aimed at classifying core stability status are relatively few, there have been efforts to develop machine learning models based on signals from IMUs or other body-worn sensors for clinical objectives. For instance, one model, trained using four reliable accelerometer-derived features, classified participants according to their susceptibility to falls with an accuracy of 74.4%. 38 Another model, trained with data acquired using a pressure platform and inertial sensor placed on the lower back, achieved ∼73% when classifying patients according to fall history. 37 Another sensor-based machine learning model categorized nonspecific low back pain patients into high- and low-risk groups with 75% accuracy. 39
Our study, to our knowledge, is among the first to use machine learning to classify individuals based on core stability status, achieving a classification accuracy of ∼85% using mediolateral head motion during RMs as the primary feature. This highlights the potential of our novel approach in leveraging head motion as a representative of core stability, despite the lack of inclusion of certain variables used in previous research. However, in the absence of directly comparable studies, further research is required to validate our approach.
It is worth noting that our approach offers advantages in terms of simplicity and user-friendliness, with our wireless earbud IMU sensor being less intrusive and easier to use than multiple sensors placed on the body. Previous models generally used greater than or equal to two IMU or body-worn sensors placed on the lower extremities or lower lumbar spine.39,45 To obtain accurate body kinematic data, the effect of clothes should be minimized; thus, participants are typically instructed to attach the sensors to bare skin or to wear tight clothing. In contrast, when measuring head motion via the IMU sensor embedded in our wireless earbud, there is no need to consider the effect of clothing. Moreover, the involvement of a highly trained operator for head motion measurement is unnecessary when using our earbud.
Automated assessment of core stability can help prevent low back pain. In previous studies, low back pain patients tended to have poor core stability.4,28,47,48 The assessment of core stability during daily activities (e.g. walking, running, and cycling) may facilitate prevention of low back pain in at-risk individuals.
In this study, we made the decision not to perform feature scaling prior to our cross-validation process. This decision was based on our objective to avoid potential data leakage, which can lead to overoptimistic estimates of model performance. Additionally, given the nature of our data and the robustness of the machine learning models used, we found that our models performed well even without feature scaling. This suggests that our models were not overly sensitive to the range of feature values, providing further assurance of their robustness. However, we acknowledge that the decision to scale features or not may depend on the specific characteristics of the data set and the machine learning model used. Future research should take these factors into consideration when designing their methodology.
Despite the promising results, our study has several limitations. One of the main limitations relates to the sample size. As noted above, the performance of our NN model was inferior to that of the SVM model, which we attribute, at least in part, to our sample size. According to Alwosheel et al. (2018), the minimum sample size necessary for artificial NN models is 50-fold greater than the number of weights 49 ; however, in the present study, the number of samples was considerably below this threshold. The small sample size may have limited the accuracy of our NN model. Another potential limitation is our reliance on the SCST to determine core stability status. The SCST is often used to evaluate the ability to control the lumbopelvic segment50,51; however, core stability is also determined by muscular capacity in the lumbopelvic-hip complex.2,52–54 We acknowledge that the SCST cannot evaluate all factors that influence core stability, particularly the endurance and strength of the lumbopelvic-hip complex. In future work, we aim to address these limitations by increasing the number of samples and developing a new and more comprehensive test for assessing core stability.
Conclusion
The present study investigated the capacity of an IMU sensor embedded within a wireless earbud to determine core stability status. Our SVM machine model classified participants into good core stability and poor core stability groups with an accuracy of >85%. The SVM model was trained and validated using features extracted from mediolateral head angle during RMs such as cycling, running, and walking, where this angle partly reflects reactive trunk motion. The present findings may facilitate the development of automated core stability assessment systems that allow users to easily determine their core stability status during activities such as cycling, running, and walking. Such systems could help to prevent core stability-related low back pain in at-risk individuals through the incorporation of core stability exercises into regular exercise programs prior to the onset of low back pain.
Footnotes
Acknowledgements
We thank, above all, our study participants for their time, dedication, and enthusiasm.
Contributorship
SJ, S-HK and K-NP: authoring of first draft of the manuscript, study design, manuscript editing, supervision, and project administration. SJ and K-NP: conceptualization, methodology, and writing. All authors read and approved the final manuscript.
Declaration of conflicting interests
The author(s) declared no potential conflicts of interest with respect to the research, authorship, and/or publication of this article.
Funding
The author(s) disclosed receipt of the following financial support for the research, authorship, and/or publication of this article: This work was supported by the National Research Foundation of Korea (NRF), (grant number No. 2020R1A2C2102729).
Ethical approval
The ethics committee of the Jeonju University approved this study (number: jjIRB-220728-HR-2022-0302).
Guarantor
Kyue-Nam, Park.