
Abstract
Objective
Past work has shown that smartphone use has negative effects on well-being. Yet, most evidence relies on self-reported measures of smartphone use and comes from Western democracies. We examined the relationship between both self-reported and actual smartphone use and well-being in Pakistan, a country that is under-researched in the Global South. Additionally, we investigated the moderating effect of the fear of missing out (FoMO).
Methods
We conducted an online survey among 427 Pakistani citizens. Participants reported their smartphone use and well-being (i.e., levels of depression, loneliness, and life satisfaction). At the end of the survey, participants were asked to upload screenshots of their respective ‘Screen Time’ (for iOS) or ‘Digital Well-being’ (for Android) apps, which we used to measure their actual smartphone use.
Results
We found a moderate association between self-reported and actual smartphone use (r = .36); on average, participants underreported their daily smartphone use by 11 min. Actual smartphone use was negatively associated with well-being, while self-reported use showed no statistically significant association. FoMO was positively associated with actual smartphone use but not with self-reported use. Finally, FoMO moderated the relationship between self-reported use and well-being.
Conclusion
Our findings show that the relationship between smartphone use and well-being depends on how smartphone use is measured and is moderated by FoMO. Moreover, we find that mobile data donation is viable in Pakistan, which should encourage future research to use it as a complement to self-reported media use more often.
Introduction
Smartphones have become a ubiquitous and essential aspect of contemporary life, facilitating everything from communication to daily task management. Today, smartphones are prevalent in economically advanced countries located in the northern hemisphere, collectively referred to as the Global North 1 and are increasingly being adopted in countries in Asia, Africa, and Latin America, known as the Global South.2,3
Although smartphones are widely and increasingly used, concerns about the impact of smartphone use on well-being are prevalent in public discourse. A significant body of scholarship has investigated the direct and indirect associations between smartphone use and well-being, suggesting that excessive smartphone use is associated with negative health outcomes.4,5 For example, smartphone use among Lebanese students has been found to lower sleep quality, 6 while in India, it has been associated with higher levels of anxiety. 7 Similarly, higher smartphone use is associated with sedentary behaviours among young people, 8 while FoMO is associated with higher smartphone use and lower well-being.9,10
However, when examining the literature on the effects of digital technology on well-being as a whole, recent meta-analyses reveal inconsistencies in the findings across studies,11,12 making it difficult to draw conclusive causal claims regarding the negative impact of smartphone use on well-being. The issue of causality is particularly tricky because while some forms of digital technology use are associated with negative outcomes such as depression, 13 these negative outcomes are in turn associated with higher use of these digital technologies, 14 and sometimes reciprocally influence each other. 15
Moreover, most of the published studies on smartphone use and well-being have relied on self-reported (retrospective) estimates of digital technology use. As we will see in the literature review below, reliance on self-report data could be particularly problematic given that error in estimating smartphone use is associated with variables taken to be potential outcomes of smartphone use.16,17
Aside from relying heavily on self-reported estimates, most academic research on the use of digital technology (including smartphones) and well-being has primarily focused on the Global North, 18 whereas the Global South is largely under-researched – with burgeoning exceptions investigating the disparities between self-reported and objective smartphone use, as well as its association with well-being.19–23 This may be particularly problematic given the differences in media use and digital technology use between the Global North and the Global South. For example, despite having a lower rate of internet penetration, the usage of YouTube and Facebook is much higher in Pakistan than in the United Kingdom. 24 Moreover, the use of private messaging apps such as WhatsApp is higher in the Global South than in the Global North. 25
Our study has four distinct goals: (a) to compare the accuracy of self-reported and actual smartphone use, (b) to examine the constructs associated with error in estimating smartphone use and with well-being, (c) to assess how different types of social media uses and FoMO moderate the association between smartphone use and well-being, and (d) to investigate the Pakistani people's willingness to donate their mobile data.
In the section below, we briefly review the literature on smartphone use and well-being in different contexts including Pakistan, offer an overview of the current debate on the measurement of smartphone use, and introduce our research questions.
Review of the literature
In the past, abundant research has linked the use of digital technologies, including the use of smartphones and social media, and psychosocial well-being. However, Sewall et al. 16 noted that despite the abundance of research, we are still far from knowing whether and how adopting digital technologies affects well-being. Scholars have developed various constructs to measure well-being, but our focus is on three commonly used variables – depression, life satisfaction, and loneliness – of well-being. Despite being considered as distinct concepts, depression, loneliness, and life satisfaction share conceptual similarities 16 and have also been found to be associated with various psychosocial factors.26–28
Past studies found negative effects of smartphone use on well-being4,5,29–32, while others reported a positive but small and short-lived correlation between smartphone use and well-being. 33 The impact of general smartphone use on well-being seems to not always be negative and may depend on the specific applications used. As Orben et al., 34 relying on large-scale representative panel data, found that the effects of digital technologies (in this case social media) are ‘nuanced, small at best (…) and contingent on analytic methods’.
According to an extensive systematic literature review, the inconsistencies in research related to well-being may be attributed to reliance on self-reported use of smartphones, which raises concerns about the validity of such findings. 35 Although self-reported smartphone use is the easiest way to measure smartphone use as it only requires people's subjective assessment on how much they use it, this approach suffers from various biases, such as errors due to erratic usage, multitasking on mobile devices, and social conformity. 36 To address this limitation, researchers are increasingly relying on novel techniques such as tracking data and data donations to obtain more accurate estimates of smartphone use. In this study, we adopt a data donation approach that involves users voluntarily sharing the data collected through their respective smartphone operating systems, such as iOS Screen Time or Android's Digital Well-being. 37 This approach allows for a more precise estimation of individual device use.
So far, the studies relying on these techniques found that people either under-report or over-report their smartphone use, and the correlation between self-reported smartphone use and behavioural data rarely exceeds r = .50.17,35–42 Here, it is important to point out that this poor convergent validity should not be taken as a reason to totally dismiss self-reported data – which has comparable predictive validity to behavioural data 43 – but instead as a reason to use both self-reported and behavioural data when possible. Indeed, behavioural data are (likely) more representative of actual usage, but they also have a few limitations: the apps sometimes crash, people may leave their smartphone on while doing something else, relatives or friends may also use it, etc. 43
Regarding Pakistan, it is worth mentioning that it is the fifth most populated country in the world with more than 220 million people with a median age of 23 years. 44 The smartphone penetration in the country has gone from 10% in 2014 to 51% by 2020, 45 and among these smartphone users, 77% are between the age of 21 and 30 years. 46 Consequently, the increase in smartphone adoption has spurred scholars to investigate its effects on well-being. However, much like the studies in other contexts, the literature on the relationship between smartphone use and well-being in Pakistan offers mixed findings. For example, Schwaiger and Tahir 47 found that students who frequently use their smartphones suffer from a psychological condition called nomophobia, i.e. anxiety about not having access to one's mobile phone. Similarly, Iqbal et al. 48 revealed that increased use of smartphone among children negatively impacts their sleep time and quality. Regarding physical health, Daniyal et al. 49 found that higher smartphone use was associated with worst physical health. Finally, Abbasi et al. 50 found that using smartphones for enjoyment and emotional bonding was positively associated with subjective well-being.
Although the studies on this topic from Pakistan have offered inconsistent findings, one thing remains consistent: they all relied on self-reported measures of smartphone and digital technology use. Therefore, to the best of our knowledge, our present study is the first to compare self-reported use with actual use of smartphones in Pakistan. Given this lack of research, we formulated the following pre-registered research questions :
RQ1: Is self-reported smartphone use correlated with actual smartphone use? RQ2: What is the relationship between self-reported smartphone use with well-being? RQ3: What is the relationship between actual smartphone use with well-being?
In addition, relying solely on self-reports can be problematic because some studies found that some measures of well-being, such as depression, predict an overestimation of smartphone use.
16
That is, people who are more depressed report using their smartphone more, meaning that the association between depression and smartphone use could just be a methodological artifact. However, few studies have investigated whether well-being predicts the discrepancy between self-reported and actual smartphone use.16,22 Besides various measures of well-being, there are other individual factors that have been found to be associated with discrepancies in estimating mobile phone use. These factors include age
22
and gender,
39
as well as television use
51
and internet use.
38
Thus, in the present study, we use both individual factors as well as different well-being measures to scrutinise people's errors in estimating their smartphone use by asking the following research question:
RQ4: What explains the discrepancy between self-reported smartphone use and actual smartphone use?
Measuring the average effect of smartphone use on well-being overlooks variations in smartphone use. Certain use may be more detrimental or beneficial than others. For instance, passive use such as browsing or ‘doomscrolling’ could be detrimental, while more active use such as posting, talking with friends, or interacting with them in a video game may be beneficial. However, meta-analytical evidence suggests that active and passive use have similar effects on well-being, and in both cases, the effects are small at best. 12
Nonetheless, it does not rule out the possibility that more fine-grained differences in smartphone use have distinct effects on well-being. For instance, a large part of smartphone use is dedicated to social media, and people use it for a variety of things, such as for recreational or professional use, which tend to have a positive effect on the users’ well-being.
52
Hence, we argue that different types of social media use can interact with smartphone use and well-being. Therefore, we ask the following question:
RQ5: Is the relationship between smartphone use with well-being moderated by the type of social media use?
Besides different types of social media use, we investigated whether interpersonal differences moderate the relationship between smartphone use on well-being. One such difference is FoMO, defined as ‘a pervasive apprehension that others might be having rewarding experiences from which one is absent’. 53 FoMO captures the desire to stay consistently connected, and the ubiquitous presence of smartphones has made it easier for people to satisfy such needs, consequently suggesting an association between FoMO and smartphone use.
Accordingly, previous research has shown that FoMO is not only associated with smartphone use but also with negative outcomes such as stress, depression, and problematic smartphone use.40,54,55 Additionally, recent studies have shown that FoMo was associated with both higher smartphone and lower well-being.9,10 Overall, the direct (and indirect) relationships between FoMO, well-being, and smartphone use have been investigated in the past, but these studies have often relied on self-reported smartphone use and, as per available knowledge, we are the first to investigate such associations based on actual data in Pakistan. Therefore, we ask the following question:
RQ6: Is the relationship between (self-reported and actual) smartphone usage and well-being moderated by FoMO?
Methods
Design and procedure
We conducted an online quantitative survey among Pakistani using Qualtrics between 20 November and 2 December 2021. Owing to the challenges of obtaining a representative sample in Pakistan through public opinion research companies, 44 we distributed the survey on various social media networks (including Facebook and Twitter) as well as on professional networks. To obtain data that are as representative of the general younger population of Pakistan as possible, we continued data collection until the desired quotas for gender, age, and education were met.
However, it is important to highlight that the study's goal necessitates smartphone ownership, which is limited to only 31% (over 90% of which are Android and 6% are iPhones) of the total population.56,57 Additionally, the survey was conducted in English, which is a common practice and the preferred choice by the participants, 58 and filled out by the respondents residing in urban centres. Consequently, it represents affluent English-speaking youth with Internet access and smartphones, and not the national population, because it is not possible to reach other groups in a representative way using an online survey. Therefore, the interpretation of results should consider these important attributes of the data.
All respondents provided their informed consent before filling out the survey. The study was approved by the first author's Institutional Review Board (Ref: 0988/Ethic/01/S3H/013/MC).
Upon providing the informed consent, the participants were routed to Qualtrics survey where they provided their estimates of smartphone use over the last 24 h along with their opinion on a range of psychosocial well-being questions. At the end of the survey, the participants were provided with a detailed visual description of how to upload their latest screen time data from the Screen Time application (for iPhone users) and Digital Well-being app (for Android users). The respondents were not forced to provide such information and were free to end the survey at any time.
Participants
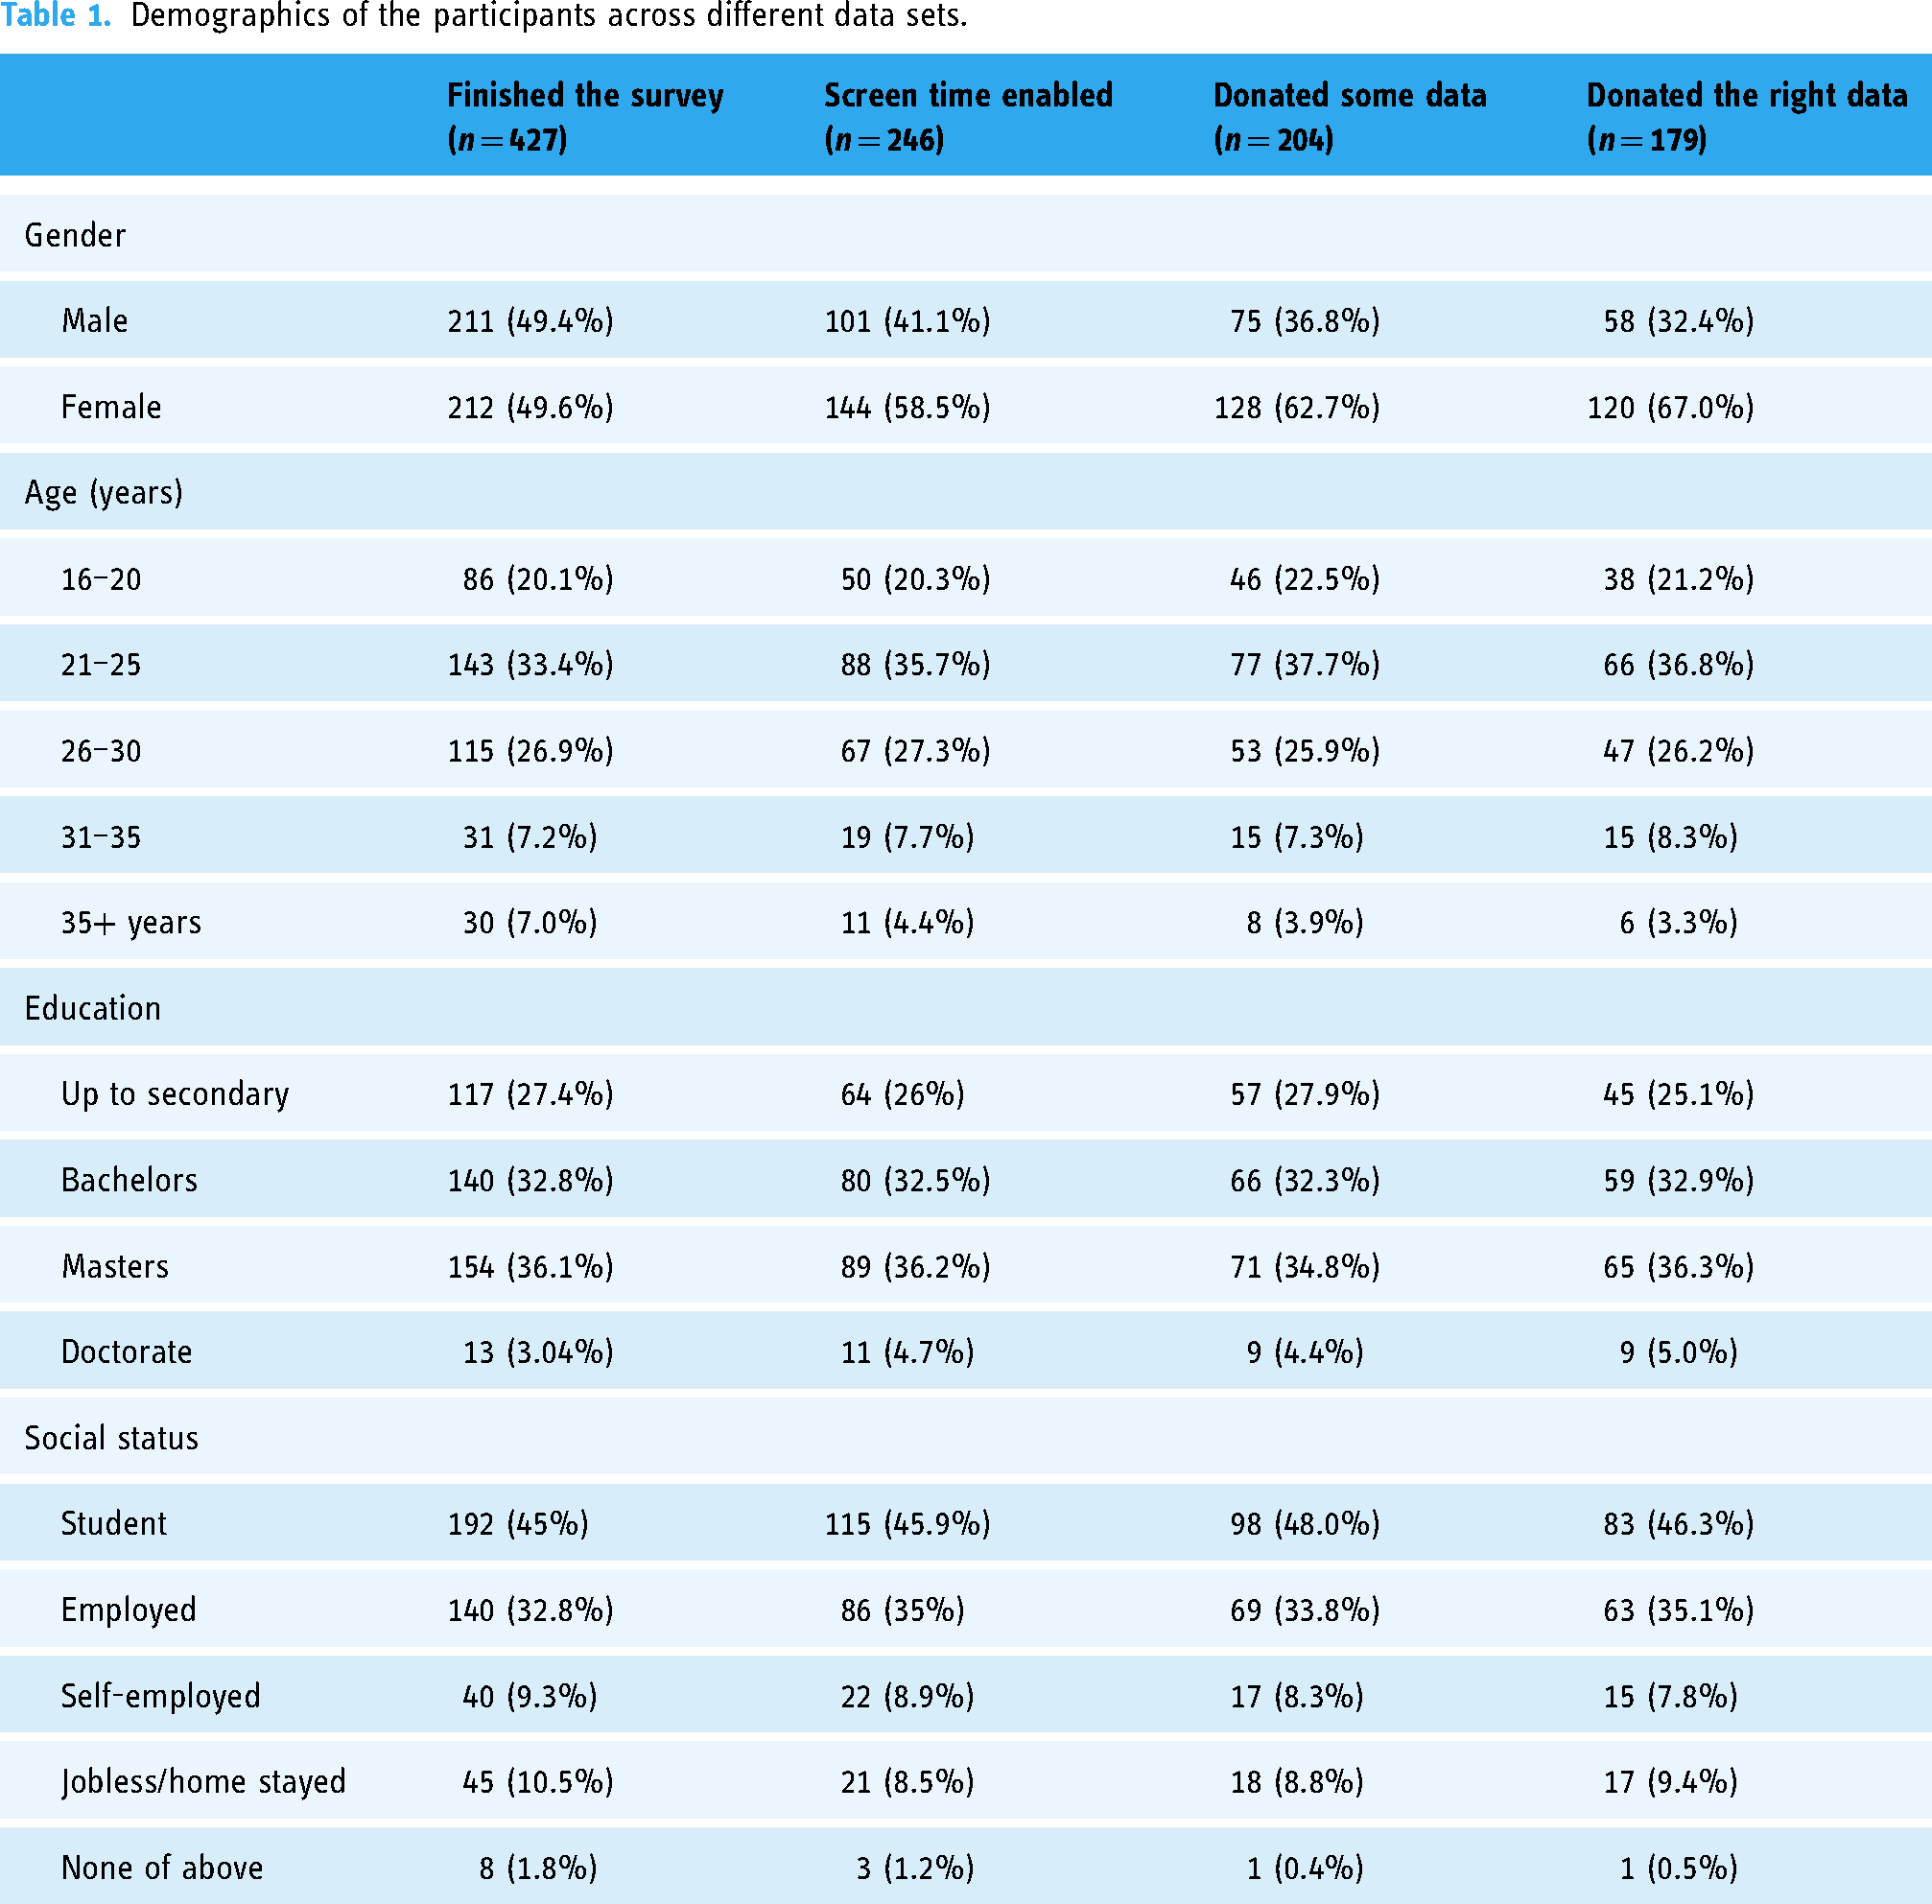
A total of 714 individuals clicked the survey link, but not all of them completed the survey. After removing the incomplete responses and the participants who reported unrealistically high daily smartphone usage (18 h or more), we reached a sample size of 427 participants. Next, given the study's focus on understanding the differences between self-reported and actual smartphone use, we excluded 181 participants who reported not having activated the ‘Screen Time’ feature on iPhone or the ‘Well-being’ feature on Android, as they would not have been able to provide the required screenshots. Accordingly, 246 respondents indicated having enabled the option on their smartphones, out of which only 12.93% (N = 33) did not share the requested screenshots, 3.6% (N = 9) uploaded irrelevant screenshots (e.g. random scenic photographs), and 25 participants donated data but not the ones requested (e.g. providing a screenshot of battery usage or their network data usage). Hence, we removed these 67 participants, which yielded our final sample of 179 respondents that we used for our final analyses. In Table 1, we report the demographics of the participants who (a) finished the survey; (b) finished the survey and had screen time on; (c) finished the survey, had screen time on, and donated some data; (d) finished the survey, had screen time on, and donated the right data.
Demographics of the participants across different data sets.
A sensitivity analysis using G*Power version 3.1.9.3 59 indicates that for a linear multiple regression (two-tailed, α = .05, 1-ß = .8), our sample of 179 participants allowed us to reliably detect effect sizes of f2 = .044, which corresponds to a small effect size.
Independent variables
Self-reported smartphone use. To measure self-reported smartphone use, we followed Sewall and colleagues. 16 The participants were presented with the question ‘Over the past 7 days, including today, about how much time per day (on average) did you spend using your smart mobile phone? Count all uses except listening to audio (e.g. music, podcasts) in the background’, and were asked to enter their responses in an open text field with the total number of hours (values constrained at 0 and 24). On average, the participants reported their daily smartphone usage of 5.76 h (SD = 2.83), i.e. 345 min/day.
Logged smartphone use. At the end of the survey, participants were asked to provide the screenshots of their Screen Time and Digital Well-being applications. Participants were given detailed visual instructions to provide us with the right screenshots. Upon receiving the requested screenshots (see Figure 1 for examples), we manually logged the data in a spreadsheet. The average smartphone usage based on logged data was 5.95 h/day (SD = 2.45), i.e. 357 min/day.

Example of submitted screenshots. The picture on the right was submitted by Android user and the left one is from iPhone user.
Moderating variables
FoMO. To assess FoMO, we used a revised version of the scale developed by Przybylski et al. 53 The participants rated their level of agreement (ranging from ‘totally disagree’ (1) to ‘totally agree’ (5)) with six statements (e.g. ‘fear your friends have more rewarding experience than me’ or ‘get anxious when you don’t know what your friends are up to’). The responses across the six statements were averaged to compute a scale to measure FoMO (α = .80, M = 3.21, SD = .95).
Reasons for using social media. We measured why the respondents used social media by asking how strongly they agreed (from ‘totally disagree’ (1) to ‘totally agree’ (5)) with eight statements. Among them, five statements were taken from Shin and Lim 60 : I use social media to ‘learn new things’ (M = 4.16, SD = .81), ‘have fun’ (M = 4.16, SD = .85), ‘get along with friends’ (M = 4.06, SD = 1.13), ‘pick myself up when I am down’ (M = 3.79, SD = 1.24), and ‘relive boredom’ (M = 4.41, SD = .88). Also, we included three novel statements: I use social media to ‘professional networking’ (M = 3.28, SD = 1.37), ‘earn living’ (M = 2.74, SD = 1.43), and ‘get news and information about current affairs’ (M = 4.40, SD = .78).
Dependent variable
The dependent variable of the present study is psychosocial well-being, which is a combined scale of three interlinked measures, i.e. depression, loneliness, and life satisfaction. To measure depression, we used the Center for Epidemiologic Studies Depression scale. 61 Participants were presented with the statements, e.g. ‘I was happy’ (reverse-coded), ‘My sleep was restless’, or ‘I was bothered by things that usually don’t bother me’ and asked how often they experience each of them (from ‘rarely or none of the time’ (1) to ‘all the time’ (3)). The scale was computed by averaging responses across the 10 items (items 5 and 8 were reverse-coded; α = .81, M = 2.20, SD = .39).
We used the 8-item Loneliness Scale 62 that including items, such as ‘I feel isolated from others’, ‘People are around me but not with me’, and ‘I feel left out’. The respondents rated how often they have felt or experienced each characteristic (from ‘never’ (1) to ‘always’ (4)). The scale was computed by averaging responses across the eight items (items 3 and 6 were reverse-coded; α = .77, M = 2.61, SD = .55).
We adopted the scale to measure life satisfaction 63 that includes items like ‘The conditions of my life are excellent’, ‘I am satisfied with my life’, or ‘So far I have gotten the important things I want in life’. The respondents indicated their degree of agreement with the statements (from ‘strongly disagree’ (1) to ‘strongly agree’ (5)). The scale was computed by averaging responses across different items (α = .81, M = 3.32, SD = .89).
While some previous research has treated life satisfaction, loneliness, and depression as distinct constructs, others have also argued that they conceptually overlap 16 and that they are similarly associated with a variety of psychosocial factors.26–28 Therefore, we pre-registered to combine these three concepts in the statistical analyses. This decision was further supported by the high internal consistency of our well-being scale (α = .73), the correlations between the constructs (ranging from r = 0.49 to r = 0.69), and an exploratory factor analysis (see Figure 1 in the supplementary information).
Accordingly, we combined the loneliness, depression, and life satisfaction scales into a single well-being scale. We reversed-coded the items (loneliness and depression) so that they all indicated well-being (and not ill-being). The scale was computed by averaging responses across the three scales (M = 2.71, SD = 0.52), with values ranging from 1 to 4 where higher values mean higher well-being.
Analysis
Our main goal was to understand the relationship between self-reported and actual smartphone usage and the well-being of Pakistani people. The first step of our analytical strategy was to calculate the difference between the self-reported and logged smartphone use. Following Ohme et al., 37 we subtracted the logged use from self-reported smartphone use to find out the error of estimation. Next, we examined which (if any) of our independent variables were associated with the error in estimating smartphone use. Then, we investigated whether self-reported smartphone use and logged used are associated with well-being. Finally, we investigated whether the type of social media use and FoMO mediate the relationship between smartphone use and well-being.
We used R programming language 64 and Tidyverse package 65 for data management and different statistical analyses. Throughout the result section, we used multiple linear regressions (in SI we report the results of the full models). We follow the analysis plan reported in the pre-registration: https://osf.io/hmfcy/?view_only=f2cf01a35e6a4fd2b79416004d03dede.
Results
RQ1: Is self-reported smartphone use correlated with actual smartphone use?
Yes, we found a correlation of r = 0.36 (p < 0.001) between self-reported smartphone use and logged screen time data. In other words, there is a moderate correlation between smartphone use in the past seven days as measured by their screen time app and the participants’ estimation of their smartphone use.
Participants underestimated their smartphone use by 11 min (M = 0.19, SD = 2.99) – the difference between self-reported smartphone (M = 5.76, SD = 2.83) and actual smartphone use (M = 5.95, SD = 2.45) is not statistically significant t(356) = −0.679, p = 0.497.
RQ2: What is the relationship between self-reported smartphone use with well-being?
A linear regression showed that – while controlling for age, gender, and education – self-reported smartphone use is not significantly associated with well-being (β = − .06, p = 0.40).
RQ3: What is the relationship between actual smartphone use with well-being?
A linear regression showed that – while controlling for age, gender, and education – actual smartphone use was negatively associated with well-being (β = − .17, p = 0.019). The strength of the relationship between actual smartphone use and well-being remains unchanged (β = − .17, p = 0.029) when including self-reported smartphone use in the model (adjusted R2 = .088, p < 0.001). Besides actual smartphone use, age is also positively associated with well-being (β = .25, p = 0.02).
RQ4: What explains the discrepancy between self-reported smartphone use and actual smartphone use?
Most psychosocial and demographic variables included in this survey do not significantly predict the difference between self-reported smartphone use and actual smartphone use. The only exception is that the respondents who use social media more for professional networking tend to underestimate their smartphone usage (β = − .30, p = 0.008).
RQ5: Is the relationship between smartphone use with well-being moderated by the type of social media use?
Regarding actual smartphone use, we found no significant interactions with type of social media use (adjusted R2 = .153, p < 0.001). In other words, the type of social media use does not appear to moderate the relationship between actual smartphone use and well-being reported above.
As for self-reported smartphone use, we found that using social media to kill boredom negatively moderates the relationship between use and well-being (β = −.36, p = 0.028). Smartphone use had a stronger negative effect on well-being among the participants who use social to kill boredom. The strength of this relationship is not affected by the addition of actual smartphone use in the model (β = − .41, p = 0.028). The other types of social media use did not significantly moderate the relationship between self-reported smartphone use and well-being.
RQ6: Is the relationship between smartphone use and well-being moderated by FoMO?
First, we looked at the how different independent variables, including types of smartphone use measures and FoMO, were associated with well-being without assessing the interaction effects (Table 2 - Model 1). Second, we examined whether the relationship between self-reported smartphone use and well-being was moderated by FoMO (Model 2). Third, we added both self-reported and actual smartphone use measures in the same model (Model 3). The results indicate that FoMO does not moderate the relationship between actual smartphone use and well-being (see Model 3). Regarding self-reported use, Table 2 shows that FoMO moderates the relationship between self-reported smartphone use and well-being (β = .38, p = 0.028; Model 2), and that this interaction effect strengthens (β = .43 p = 0.015) when adding actual smartphone used in the model (see Model 3).
Linear regression analysis (OLS) with well-being as outcome variable.

Note: Scores are unstandardized regression coefficients, with standard errors in parentheses. *p < 0.05, **p < 0.01, ***p < 0.001, +p < 0.10.
The interaction plot in Figure 2 (on the left) shows a positive relationship between smartphone use and well-being among the participants high in FoMO, and a negative relationship between smartphone use and well-being among the participants low in FoMO. The Johnson–Neyman plot in Figure 2 (on the right) represents the result of a Johnson–Neyman test 66 that allows us to see at which exact point(s) the interaction between FoMO and self-reported smartphone usage becomes (in)significant. We see that the interaction is statistically significant among the participants low in FoMo (negative effect on well-being) and high in FoMo (positive effect on well-being).

Interaction effect (based on Model 3 in Table 2).
Discussion
This pre-registered data donation study had four distinct goals: (a) to compare the accuracy of self-reported and actual smartphone use, (b) to examine the constructs associated with error in estimating smartphone use and with well-being, (c) to assess how different types of social media uses and FoMO moderate the association between smartphone use and well-being, and (d) to investigate the Pakistani people's willingness to donate their mobile data.
Our results indicate that self-reported smartphone use and actual smartphone use are moderately associated with each other. In line with Sewall et al., 16 the participants were relatively accurate in estimating their daily actual smartphone use. However, unlike Sewall et al. 16 who asked the respondents to copy-paste the statistics from the Screen Time app, we obtained the actual user data through their donated screenshots, i.e. actual smartphone use. The studies following this approach (i.e. tracking or data donation) have rather found that people significantly under- or over-report their smartphone usage. 36 The finding that Pakistanis underestimated their smartphone use by only 11 min should temper some long-standing concerns about the inaccuracy of self-reported measures. 67
Answering the call to compare variations between self-reported and actual smartphone use, 67 we investigated how each measure of smartphone use was associated with well-being in Pakistan. We found that self-reported use was not significantly associated with well-being (r = −.07, p = 0.34), while actual smartphone use was negatively associated with well-being (r = −.15, p = 0.03). These findings contrast with previous studies finding significant associations between subjective use and well-being and no relationship between actual use and well-being.16,40 However, as we mention in the limitations, the negative correlation is likely too small to matter for individuals’ well-being.
Regarding to the moderating effect of FoMO on the relationship between well-being and smartphone use, we found that self-reported smartphone use was not significantly associated with FoMO (r = .05, p = 0.47), but FoMO moderated the relationship between self-reported smartphone use and well-being (β = 0.83, p = 0.015). The opposite was true for actual smartphone use, i.e. FoMO was significantly associated with actual use (r = .19, p = 0.008), but it did not moderate the relationship between actual smartphone use and well-being (β = −0.39, p = 0.224).
Our findings are consistent with prior research conducted both in the Global North and South,16,22,23,35,37 which suggests that self-reported smartphone use and actual usage are separate constructs. There are several possible explanations for it. The ubiquity of smartphones in our contemporary lives has made it difficult for people to discern conscious and unconscious (e.g. checking notifications) smartphone usage. 23 Similarly, previous research has indicated that unlike actual smartphone use, self-reported measures are prone to recall and social desirability biases,16,36,67 thereby establishing them as distinct constructs.
The current study has limitations. First, the effects we find are small, likely too small to matter for people's lived experiences. Most media effects, such as social media or TV, have effects that are on average too small to be perceived by the users. 68 Second, our findings are correlational. Decreased well-being could increase smartphone use, and confounding variables not measured in the present study could lead to both a decrease in well-being and an increase in smartphone use. Third, we measured between-participant differences, which are known to be larger than within-participant differences when it comes to media effects and less likely to reflect causal relationships.68,69 Fourth, our sample size is relatively small – especially to detect interaction effects – and not representative of the general population – which is almost unavoidable for data donation studies.
Conclusion
Our study shows that using mobile data donations in countries like Pakistan is a viable option to examine the effects of digital technologies. Our findings are in line with previous research on the moderate correlation between self-reported and actual data, but unlike past work, the average error, i.e. 11 min, is small. Future work should further investigate the moderating role of FoMO and the reasons why people use their smartphones. Finally, we encourage future research to use tracking or donated data more often as a complement to self-reported media use.
Supplemental Material
sj-docx-1-dhj-10.1177_20552076231186075 - Supplemental material for Smartphone use and well-being in Pakistan: Comparing the effect of self-reported and actual smartphone use
Supplemental material, sj-docx-1-dhj-10.1177_20552076231186075 for Smartphone use and well-being in Pakistan: Comparing the effect of self-reported and actual smartphone use by Waqas Ejaz, Sacha Altay and Ghazala Naeem in DIGITAL HEALTH
Footnotes
Acknowledgements
The authors acknowledge the support of our peers.
Contributorship
All authors were involved in various phases of the study.
Declaration of conflicting interests
The author(s) declared no potential conflicts of interest with respect to the research, authorship, and/or publication of this article.
Ethical approval
All participants were informed about the nature and scope of the study. Moreover, only those participants who provided us with their consent were progressed to complete the survey. Finally, the study, prior to data collection, obtained the Institutional Ethical Approval from the respective department at National University of Science and Technology (NUST), Pakistan.
Funding
The author(s) received no financial support for the research, authorship, and/or publication of this article.
Guarantor
WE
Supplemental material
Supplemental material for this article is available online.
References
Supplementary Material
Please find the following supplemental material available below.
For Open Access articles published under a Creative Commons License, all supplemental material carries the same license as the article it is associated with.
For non-Open Access articles published, all supplemental material carries a non-exclusive license, and permission requests for re-use of supplemental material or any part of supplemental material shall be sent directly to the copyright owner as specified in the copyright notice associated with the article.