
Abstract
Objectives
Workers’ compensation schemes provide funding for wage replacement and healthcare for injured and ill workers. In Australia, workers’ compensation schemes operate independently in different jurisdictions, making comparisons of health service use challenging. We sought to develop and deploy a new database of health service and income support data, harmonising data from multiple Australian workers’ compensation jurisdictions.
Methods
We worked with workers’ compensation authorities from six Australian jurisdictions to combine claims, healthcare, medicines and wage replacement data for a sample of compensated workers with claims for musculoskeletal conditions. We designed a structured relational database and developed a bespoke health services coding scheme to harmonise data across jurisdictions.
Results
The Multi-Jurisdiction Workers’ Compensation Database contains four data sets: claims, services, medicines and wage replacement. The claims data set contains 158,946 claims for low back pain (49.6%), limb fracture (23.8%) and non-specific limb conditions (26.7%). The services data set contains a total of 4.2 million cleaned and harmonised services including doctors (29.9%), physical therapists (56.3%), psychological therapists (2.8%), diagnostic procedures (5.5%) and examinations and assessments (5.6%). The medicines data set contains 524,380 medicine dispenses, with 208,504 (39.8%) dispenses for opioid analgesics.
Conclusions
The development of this database presents potential opportunities to gain a greater understanding of health service use in the Australian workers’ compensation sector, to measure the impact of policy change on health services and to provide a method for further data harmonisation. Future efforts could seek to conduct linkage with other data sources.
Keywords
Introduction
Work incapacity occurs when an illness, injury or other health condition reduces the ability of a worker to participate in employment. In some cases, this is referred to as work disability. 1 The scale and impact of work incapacity is evident from multiple international data sources.2–4 For example, there were approximately 2.8 million non-fatal workplace injuries and illnesses in the USA in 2019, equating to 2.8 cases per 100 full-time equivalent workers. 5 Work-related musculoskeletal disorders accounted for 239,345 time-loss years in Canada between 2004 and 2013. 6 The International Labour Organization estimates that there are 340 million occupational accidents and a further 160 million workers affected by industrial illness every year. 7 In Australia, the setting for this study, over half a million workers experienced a traumatic work-related injury in 2014, 8 while more than 780,000 received income support for a period of work incapacity during the 2015–2016 Australian financial year. 9 Recent estimates indicate that work injury costs approximately AUD$ 61.8 billion per annum or 4.1% of Australian gross domestic product. 9
In many nations, individuals experiencing an episode of work incapacity that is due to the circumstances of work can seek financial support from an income support system for the period of incapacity. These are known as cause-based systems, with financial benefits paid on the premise that work contributed to loss of earning capacity. 4 Caused-based systems are more commonly known as workers’ compensation systems and are in operation in nations including Australia, the USA, Canada, Hong Kong, Korea, Japan and Italy.4,9
Workers’ compensation systems typically fund healthcare, rehabilitation and other services in addition to income support.4,9 These funds are made available in order to enhance the functional capacity of incapacitated workers, to support recovery from injury and illness, to improve incapacitated workers’ ability to engage in paid employment and to provide long-term care for workers with permanent disability. Payments for healthcare and services constitute approximately one quarter of total workers’ compensation annual expenditure, or more than $2.38 billion in 2019–2020, among Australian workers’ compensation schemes. 10
Common data standards enable accurate comparisons that utilise multiple data sources. For example, comparisons of workers’ compensation claims in different Australian jurisdictions reporting on injury and illness, occupation and industry are routinely published, as national standards are available for all these variables.11–13 However, there are currently no data standards or accepted systems or indicators for monitoring healthcare service provision in Australian workers’ compensation schemes. While several schemes utilise the Australian public healthcare scheme item codes (i.e. the Medicare Benefits Schedule (MBS)), most also fund services not covered under this scheme, and therefore do not have an MBS item code. In such instances, workers’ compensation regulators rely on internally generated service item codes, making comparisons between jurisdictions challenging. Agreed standards for healthcare services data are critical for understanding the prevalence, nature, timing, continuity and quality of healthcare provision to incapacitated workers.
Evidence from other jurisdictions (e.g. USA) indicates that certain procedures, services and medicines may be harmful in some circumstances and may prolong disability. For example, for workers with low back pain, spinal surgery (e.g. decompression or fusion) is associated with prolonged disability duration, 14 diagnostic imaging often triggers a ‘cascade’ of additional and unnecessary treatments15–19 and certain medicines such as opioids lead to harmful side effects that outweigh any benefits.20–23 However, analyses of these health services in compensated workers have not been readily performed in Australia. There are also currently no data across jurisdictions to enable us to determine the extent to which these potentially low value services are being provided to workers.
Despite healthcare provision and income support being the two main tools available to Australian workers’ compensation schemes to support workers during their periods of incapacity, we currently have no data (beyond that available to individual insurers or regulators) to understand the prevalence, impact, continuity and quality of health services across jurisdictions. Existing standards of data collection in workers’ compensation have provided valuable understanding so far: the national data set for compensation-based statistics and the national return to work survey are both used for monitoring injury and illness trends and research. 24 However, this existing infrastructure still does not provide comprehensive information about health service use in compensated workers.
The objective of this study was to develop and deploy a new database of health service and income support data for research purposes, encompassing data from multiple Australian workers’ compensation jurisdictions. We believe that insights generated from such a database will support knowledge generation and policy and practice development. It will also enable an understanding of service and benefit delivery at a national level, and grant greater statistical power that allows for more analyses of more complex relationships between variables. In this paper we describe the methods and process used in the development of this new database.
Methods
Setting
There are 11 workers’ compensation schemes in Australia: one per state and territory, and three national.9,25 These schemes are regulated by government organisations, with claims variously managed and underwritten by government and private organisations. Workers’ compensation schemes provide coverage to approximately 93% of the Australian labour force.25,26 Further information on the structure and coverage of workers’ compensation in Australia is available elsewhere.9,25 These are cause-based systems, meaning that a worker is only eligible for payments for benefits and services from workers’ compensation if they are injured in the course of employment. 25 Income support benefits are typically paid for two to two-and-a-half years, depending on jurisdiction, before workers must provide evidence of significant incapacity preventing a return to work. 25 These benefits are typically paid in fortnightly instalments directly to the injured worker, and cover a percentage of the worker's pre-incapacity weekly wage up to a maximum cap. The percentage and the cap vary between the Australian jurisdictions.
Workers’ compensation schemes also fund any healthcare or rehabilitation services or medicines deemed reasonable and necessary for worker recovery in addition to income support.9,25 The availability of funding for healthcare often extends beyond the end of income support. Workers may still access healthcare outside the workers’ compensation scheme via other funding sources. The Australian government operates the MBS and Pharmaceutical Benefit Scheme (PBS): national health insurance systems with subsidised healthcare regulated and funded by the national government and operated through private and local government entities.27–29 Healthcare may also be funded by the worker from out-of-pocket expenses or private health insurance. Workers’ compensation healthcare funding provides full coverage of healthcare costs (i.e. avoiding gap payments), allows injured workers faster access to healthcare (i.e. avoiding wait times common in publicly funded non-emergency healthcare) and greater flexibility in choice of healthcare provider. In some Australian jurisdictions, workers or their employer are responsible for funding the initial healthcare costs in an episode of work incapacity (typically about the first ∼AUD$ 800) before the compensation scheme funds further expenditure. 30 Further detailed information about Australian workers’ compensation schemes is published elsewhere.9,25
Sample
We chose to focus on conditions that are common within Australian workers’ compensation systems to establish the first iteration of the database; specifically, low back pain, limb fracture and non-specific limb conditions. Low back pain is the leading cause of disability globally and occurs predominantly in people of working age.31,32 There are consistent and accepted treatment and management options for low back pain, 33 providing a potential for comparing actual service delivery with ‘best practice’. The two other conditions, limb fracture and non-specific limb conditions, were selected as comparator musculoskeletal conditions. Limb fractures have a traumatic mechanism, and the return of functional capacity usually progresses on a reasonably consistent trajectory, and non-specific limb conditions typically involve damage to similar types of structures as low back pain (i.e. soft tissue). Included conditions were defined using Type of Occurrence Classification System nature of injury codes (see Supplemental Appendix 1). Claims with these conditions occurring between 1 July 2010 and 30 June 2015 (i.e. five Australian financial years) were included. This sample selection criterion has been used in previously published studies. 34
Project development
We developed the project proposal in mid-2018. As a multi-disciplinary team including clinician specialists, allied health professionals and policy analysts, the proposal was developed with a wide array of input. We also invited feedback from industry experts and researchers with experience in similar projects conducted in Canada. 35 The proposal included a list of desired claim- and service-level variables that we determined necessary to complete our analyses.
Workers’ compensation authorities from five Australian states and the Commonwealth authority, representing more than 80% of the national labour force, were invited to participate: New South Wales, Victoria, Queensland, South Australia, Western Australia and Comcare (the Commonwealth authority). All invited data custodians agreed to participate, with data from all custodians except New South Wales included in the first iteration of the database. As this was the first iteration of the database requiring substantial methodological development, we chose to invite only the workers’ compensation authorities from larger states and territories. In the future versions of the database, we aim to include workers’ compensation authorities from all Australian states and territories.
Once data custodians agreed to participate, we met with data and information specialists from each organisation to discuss the data formats and availability of information. Most collected variables were common across jurisdictions; however, there was variation in how some variables were defined. For example, date variables were often identified differently between databases despite being analogous: the date that liability for a claim was accepted by an insurer could be identified as ‘date accepted’, ‘date determined’ or ‘liability commencement date’. In cases where data dictionaries were maintained, we worked with data custodians to select specific variables to match our requirements. In other cases, we asked data custodians to recommend which variable they thought was most suitable for our requirements.
Code used to develop this database was written in both R 3.5 and STATA, which were executed in Microsoft Visual Studio, RStudio and STATA 15.36–39 A number of R packages were required to complete the necessary steps referenced throughout this paper, including the following: dplyr, tidyr, readr, tibble, stringr, ggplot2, lubridate, naniar, knitr, broom and haven.40–50 A complete reference list of all R packages utilised in the database development is available in Supplemental Appendix 2.
Governance and ethics
We developed and entered data sharing agreements with each data custodian that (1) sought to ensure the privacy, confidentiality and security of the data; (2) specified the ways in which data would be received, stored, used, analysed and published; and (3) established protocols for the review and publication of study findings and the involvement of data custodians in the project. A standard review period was agreed upon between researchers and all data custodians. Researchers would provide any output material (e.g. papers, conference submissions or reports) to data custodians for a 20-business day review period prior to public dissemination. The review period allowed data custodians to comment on findings and analytic interpretation of the data but did not include the option to veto the publication of any findings. We received ethical approval from the Monash University Human Research Ethics Committee (Project ID 17267, November 2018).
Database structure, design and requirements
A worker with an accepted claim is unlikely to receive only a single service, medicine or wage replacement payment. The database was therefore designed with a one-to-many relationship: there are single records for each claim, and many records for each of the services, medicines and wage replacement payments they received. Each of the records, whether single or many per claim, was designated a unique claim identifier by each data custodian. Service, medicine and wage replacement records can therefore be linked to each claim to which they belong. New harmonised identifiers were applied in this database to avoid overlap between data custodians’ previously isolated individual databases (e.g. two jurisdictions might both have claim ID 1234). The new identifier was known as the multi-jurisdiction identifier (MJid). This relationship meant that the database consists of four data sets linked via the MJid: the claims data set (one record per claim), services data set (many records per claim), medicines data set (many records per claim) and wage replacement data set (many records per claim). The services, medicines and wage replacement data sets were compiled separately to one another as the variables were too dissimilar. The relationship between these data sets is demonstrated in an example in Figure 1.

Example of database structure.
Data transfer, storage and privacy controls
Data were transferred from each participating data custodian to the researchers via several secure file transfer protocol services for storage in the Monash University secure research environment. This environment is restricted and can only be accessed by authorised researchers. As per ethics approval, data were de-identified by data custodians prior to transfer. Once received and stored, the common unique identifier (i.e. MJid) was generated and applied to claims and services data sets. This identifier serves as the key to link each of the data sets within the database.
Cleaning and quality assurance
Data were first checked for internal consistency. This quality assurance step refers to whether the values in the data were accurately aligned with a given variable. Errors in internal consistency often occurred where data were stored in delimited flat files (e.g. comma-separated value files). For example, an error in value separation when parsing data into the R or STATA environment could result in an industry code being stored in an occupation variable. Count statistics were then generated to identify any unique service items. Any unique services were cross-referenced against a data set of names 51 and manually checked to ensure that no identifying information was erroneously stored within the services data set.
Conceptually common variables were formatted differently between data custodians. This was likely due to each data custodian's data input, storage and handling infrastructure, as well as the format in which the data was transferred to the research team. For example, where data custodians transferred data as flat files, date variables were often parsed as strings, but data transferred in database formats (e.g. SAS) meant date variables retained their date/time properties. Conversion was required to change dates stored as strings to date variables. 52
The array of service item codes used by each jurisdiction often included a mix of internally generated codes and MBS codes. While MBS codes are numeric only, some internally generated codes included letter prefixes. Depending on file formats, this often resulted in service item codes being stored as strings, and numeric codes frequently having leading zeroes. For example, MBS item 23 (professional attendance by a general practitioner) was frequently stored as ‘000023’ to account for internally generated service item codes. 53 A string trimming loop was implemented to remove leading zeroes from service item codes.
Approximately 5% of data were missing in the received data sets. This was typically confined to specific variables. Missing data were often defined in non-standard ways, such as ‘NA-’, ‘Null’ or ‘9999’. These instances were identified and converted to accurate standard missing values. 54 We did not make attempts to impute missing data in this first version of the database, instead leaving this decision to researchers conducting the analyses.
All variables were assessed for logical values. This was usually required for continuous variables where the range of the variable was in question. For example, it was unlikely that a worker would earn AUD$ 999,999 per week pre-injury, and that instead this represented missing or unknown pre-injury weekly earnings. The same logic checks were required for date variables. For example, a date of injury in decades into the future of the study period was unlikely to be a realistic data entry. Illogical values were converted to missings.
Data harmonisation
Data harmonisation involved the combining of variables from different data custodians in such a way that consistent and reliable meaning can be derived from a single new variable. For example, some data custodians recorded worker sex as ‘M’, ‘F’ and ‘U’, whereas others utilised ‘0’, ‘1’ and ‘9’. There were also frequent differences in date arrangement, with data custodians reporting in day-month-year, month-day-year or year-month-day. It was important to identify what each variable’s values represented and arrive at a harmonised version. In cases where data custodians used internally generated variables harmonisation, this was more challenging. For example, employer size was recorded as a continuous variable (i.e. number of employees) or as a categorical variable (e.g. ‘small’, ‘medium’ or ‘large’). In such cases, data dictionaries and information were assessed, and a number of possibilities were discussed with the research team and data custodians to arrive either at an assumption for that variable or a decision not to include it in the final database.
Services data were harmonised in tranches, based on priorities identified by the research team. General Practitioner services were prioritised as they are a key service in the Australian workers’ compensation process. 30 Diagnostic imaging, physical therapy services (e.g. physiotherapy, chiropractic and osteopathy) and psychological therapy services (e.g. psychology, counselling and rehabilitation counselling) are all common services that were also selected based on their relevance to best practice care for low back pain.
Harmonising each tranche of service data followed a standard methodology (see Figure 2). A list of unique services was extracted from each data custodian's services data set. These lists also included the total frequency of each service. A list included a service item code (where applicable) and a service item description (usually a short string of up to approximately 100 characters). A service item code was either a numeric MBS item or an internally generated alphanumeric string. An attempt was firstly made to attach the MBS to each list of unique services by the item code. Where services were matched to the MBS, the research team collectively decided upon eligible services based on MBS descriptions. For example, when examining the tranche of diagnostic imaging services, any service in MBS Category 5 – Diagnostic Imaging Services was considered eligible. The MBS was not exclusively used to identify an eligible service but did assist investigators where a data custodian used an MBS item number or description.

Services data harmonisation process.
A service definition was created by the investigator team for the service to be harmonised. Two investigators then independently screened each service item for eligibility. Disagreements were arbitrated by a third investigator. After a round of eligibility assessment had been completed, investigators then met to finalise how this eligible tranche of services should be categorised. For example, once general practice (GP) services had been identified, the investigator team then had to decide on definitions for GP services that were ‘patient interactions’ or ‘report writing/other’ (see Supplemental Appendix 3 for examples). Part of the harmonisation process was to develop a bespoke services coding scheme that could retain sufficient services detail from all data custodians. This is described in the following section. Two investigators independently reviewed eligible services and applied the services coding scheme. A third investigator again arbitrated disagreements.
Following screening for eligibility and the application of the services coding scheme, a final list of harmonised service items from all data custodians was available. The list of eligible health services was joined to the original service data sets by one or both of the service item code or description (whichever was available). The filtered and categorised data from each data custodian was then checked and refined to ensure that the same variables were available and commonly identified in each. For example, if service cost was not available in one data custodian's data set, the variable was added with all data as missing. These data sets were then appended to create the final harmonised services data set. This harmonisation methodology will continue to be used in harmonising the remainder of the database.
Medicines data were also prioritised for harmonisation. There is clear guidance for the use of opioids for low back pain: judicious use at low doses and for a short duration if a trial of non-steroidal anti-inflammatory medicines is contraindicated or unsuccessful.55–59 Like diagnostic imaging, this provided an evidence-based comparison for any findings. A similar harmonisation methodology to services was utilised. In this instance, unique lists of all medicines were created from the two data custodians who had medicines data (Victoria and South Australia). Investigators then assessed each medicine description to manually identify the appropriate Anatomical Therapeutic Chemical (ATC) code. 60 The remaining ATC structure (i.e. levels one through four) was attached to this data later. Based on the research objectives, opioids were also identified within the data. A new variable was generated to identify a medicine as either not an opioid or a strong or weak opioid. This opioid classification is available in Supplemental Appendix 5 and has been published elsewhere.61,62
Finally, wage replacement data were harmonised using relatively common variables. Data were provided from all data custodians in a similar format that included a wage replacement payment start date, payment end date and payment amount. These variables were appended to a single wage replacement data set. No modifications were made to overlapping periods or illogical time periods at this point.
Service item coding
In order to capture the totality of services funded by workers’ compensation schemes, it was necessary to develop a bespoke coding scheme that covered services with codes in the MBS, PBS and services not covered by those coding schemes.
This coding schema was designed to be applicable to all services potentially funded by workers’ compensation. In designing this schema, we sought to strike a balance between having services data detailed enough to not lose valuable insight during analysis, but not so detailed that harmonisation between data custodians was not possible. An example of this balance is demonstrated in Figure 3. With complete harmonisation, we could just identify a general practitioner service as a GP service, but this would result in information loss: in this instance, what the GP service involved. At the other end of scale, preserving a great deal of information about a GP service means that harmonisation is not possible. This is where we sought to strike a balance in harmonising data and preserving service information.
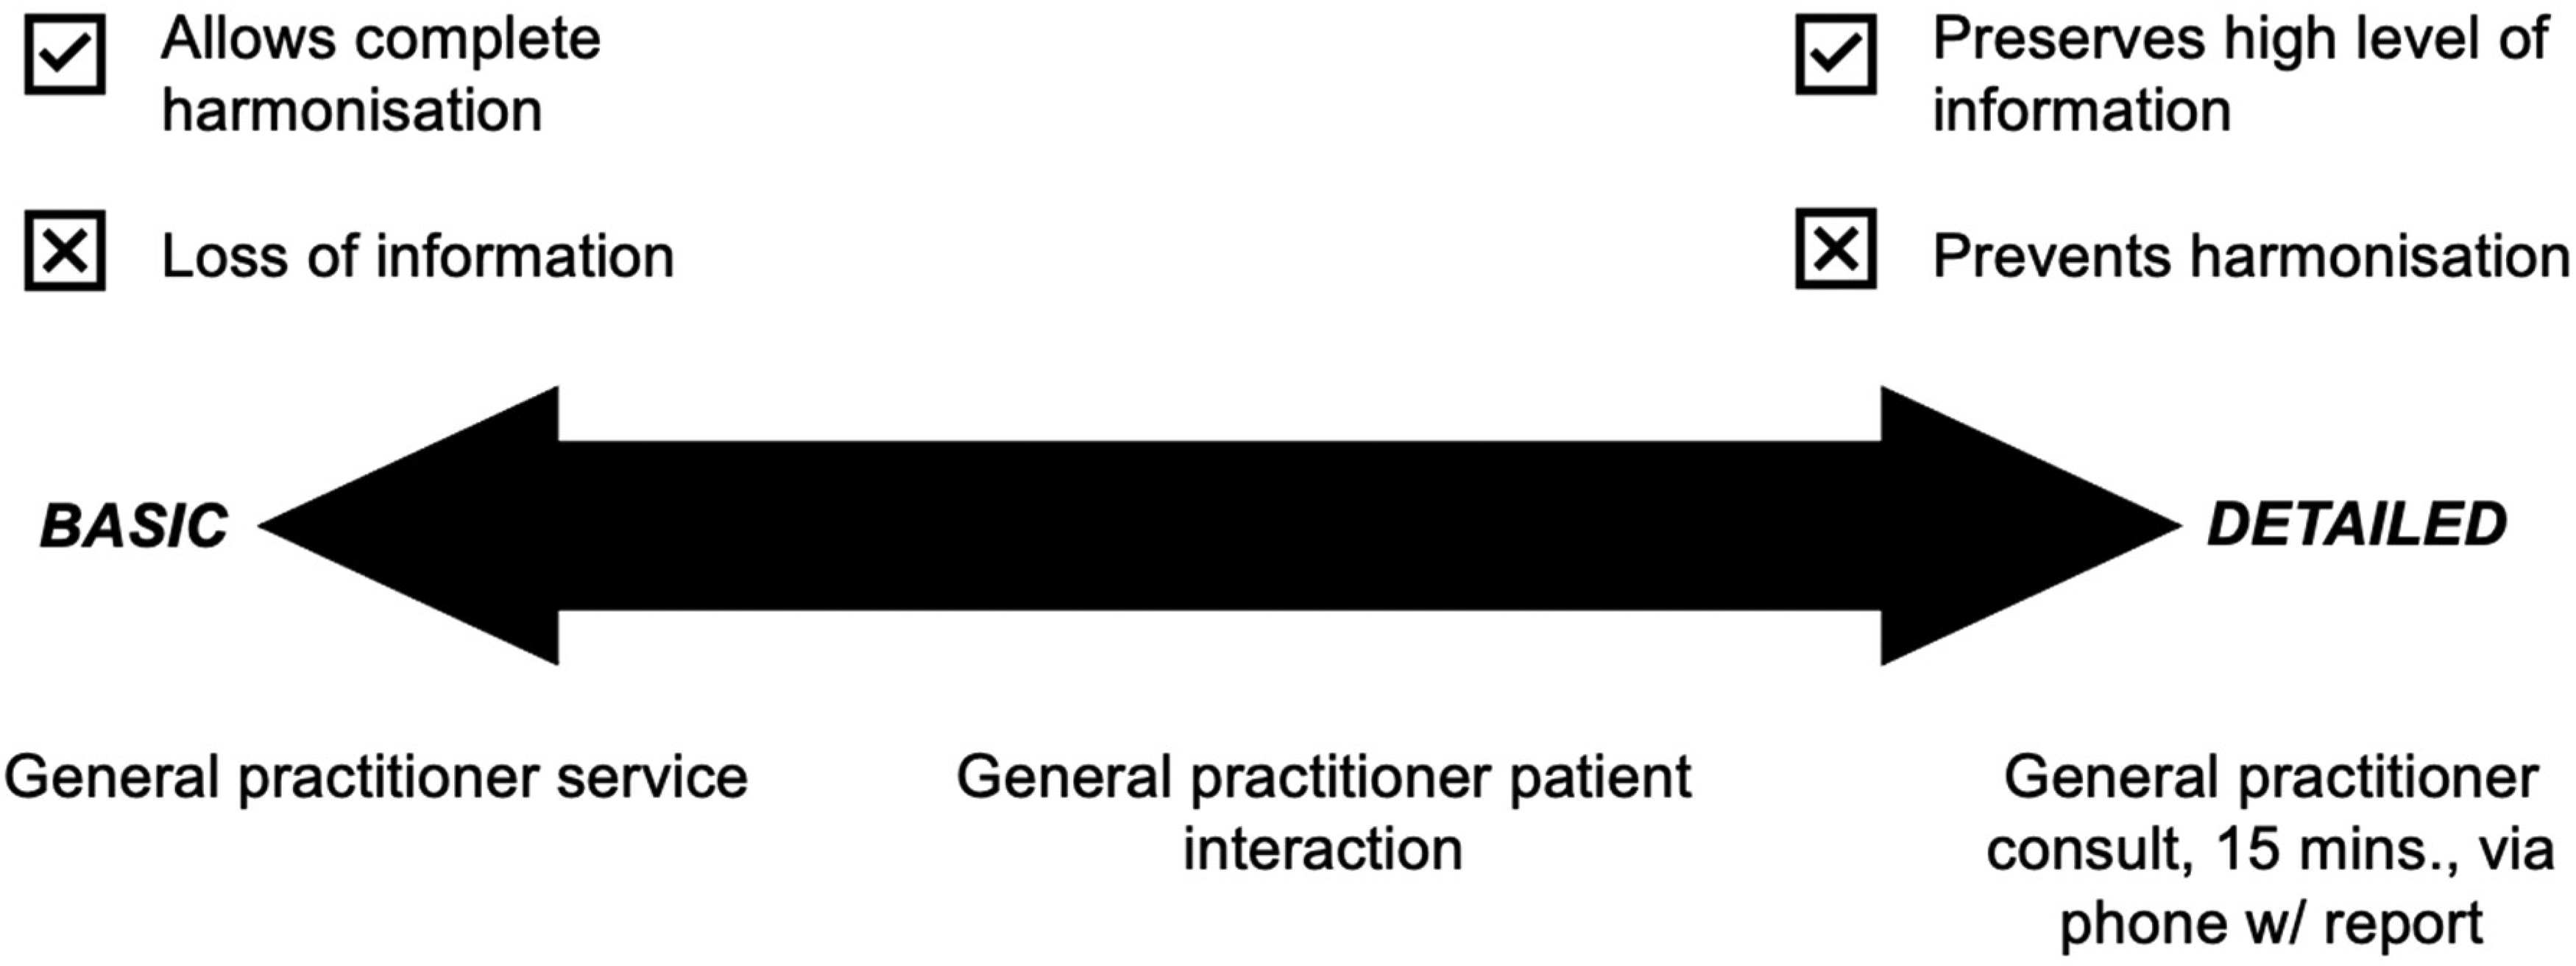
Example of balancing services data detail.
We developed the services coding schema iteratively. The first step was to plan an overall structure. This was conducted collaboratively, and changes and alternations were made through several group discussions with the entire research team. Once we had decided on a preliminary structure we proceeded to harmonise tranches of services data, as described in the previous section. Throughout this process, we continued discussions to strike a balance between services data that were too basic or too detailed. Modifications to a given section of the coding schema were made once the given tranche of services data had been filtered for eligibility. An operational definition of each service was decided upon by the research team prior to the final service item assignment and harmonisation. An example of one of these operational definitions is available in Supplemental Appendix 3.
Like the MBS, our coding schema contains four levels of categorisation: service category, group, subgroup and item. Each level has a code and a description. The code is hierarchical, in that levels above a service can be determined from the code. An example of how GP services fit within this schema is provided in Figure 4. The full structure of the coding schema is available in Supplemental Appendix 4.

Services coding schema for general practice (GP) services.
It was not necessary to develop a service coding schema for the medicines data set. The content and type of medicine, unlike a service description, is not open to interpretation. As described in the previous section, we therefore assigned all medicines to the ATC coding scheme based on primary chemical.
Other derived and calculated variables
Several additional variables were derived through either mapping to existing standards or calculated from other variables. Australian Statistical Geography Standard and Socioeconomic Indexes for Areas data were linked to the claims data set via worker residential postcode.63,64 This practice has been performed before in several other research papers65,66 and provides important covariates for analysis including the Accessibility/Remoteness Index of Australia and Index of Relative Socioeconomic Advantage and Disadvantage.
Wage replacement aggregation
As described in the previous section, wage replacement data were harmonised in the wage replacement data set. Total cumulative wage replacement duration was derived from individual wage replacement payments and linked to the claims data set via the unique identifier. Like services and medicines data, wage replacement payments were stored as many records per claim, with one record per payment period per worker. The difference in days between the start and end dates of a payment period for each worker was calculated. To standardise payment period duration between data custodians, business weeks (i.e. 5 days) were standardised to calendar weeks (i.e. 7 days). Overlapping periods were removed or merged to ensure that individual days were not double counted. The sum of paid days for each worker was then calculated and divided by seven (i.e. a calendar week). This provided the variable wage replacement duration, measured in paid calendar weeks.
Results
Database structure and volume
The Multi-Jurisdiction Workers’ Compensation Database is a structured relational database comprised of four data sets: the claims data set (one record per worker), services data set (multiple records per worker), medicines data set (multiple records per worker for two jurisdictions only) and wage replacement data set (multiple records per worker).
In this first iteration of the database, we have included a total of 158,946 claims: 78,796 (49.6%) for low back pain, 37,753 (23.8%) for limb fracture and 42,397 (26.7%) for non-specific limb conditions (Figure 5). The majority of claims (63.6%, N = 101,086) involve wage replacement payments for periods of work incapacity (i.e. time loss).

Number of claims in the Multi-Jurisdiction Workers' Compensation Database (claims data set) by claimed condition and claim type.
The services data set contains a total of 4.2 million services (see Figure 6). Services from doctors (29.9%) and physiotherapists (56.3%) were the most common in the data.

Number of services in the Multi-Jurisdiction Workers' Compensation Database (services data set) by service group and subgroup.
The medicines data set (see Figure 7) contained medicines from two of the five included jurisdictions: Victoria and South Australia. This data set includes a total of 524,380 medicines, 39.8% (N = 208,504) of which are opioid analgesics.

Number of medicines and number of opioids in the Multi-Jurisdiction Workers' Compensation Database (medicines data set) by opioid strength.
Basic insights
In this section, we demonstrate three examples of basic insights made possible by this new Multi-Jurisdiction Workers’ Compensation Database. This brief analysis is conducted using a sub-sample of the complete database. There are a number of notable policy differences between workers’ compensation schemes in Australia that should be considered when making inter-jurisdictional comparisons or conducting analyses. The background to these differences can be extensive and is documented elsewhere. 67 For this reason, the following figures represent a sample including claims for any condition (i.e. low back pain, limb fracture and non-specific limb conditions) from Victoria, Queensland, South Australia, Western Australia and Comcare lodged between 01 July 2011 and 30 June 2015. Services data for these claims have been filtered to 30 days prior to 730 days after the claim acceptance date. The 30 days prior accommodates the possibility of services being retrospectively funded after a claim was accepted. A follow-up period of 730 days, or two years, is based on the typical period for which healthcare services are funded by these workers’ compensation schemes.
Figure 8 presents the prevalence of service categories among the sample of claims. This is likely reflective of the conditions in the sample, with physical therapy services (77%) and diagnostic imaging services both highly prevalent (59%) relative to psychological therapy services (7%).

Prevalence of services.
Figure 9 highlights the median number of services per claim in those claims that had that service. It is important to consider this figure in the context of the previous: while diagnostic procedures were relatively prevalent (59%), the median number of services in those that claims that received them is relatively low. In contrast, the small number of claims that received psychological therapy services received a median number of services similar to that of doctors.

Median (interquartile range (IQR)) number of services in those who had them.
Finally, Figure 10 demonstrates the timing of services relative to claim acceptance. This plot shows the relative density (i.e. frequency) of services in the 30 days prior to and 730 days after claim acceptance. Trends are immediately apparent, with the majority of diagnostic procedures occurring early in a claim likely driven by the acute severity of limb fractures in this sample.
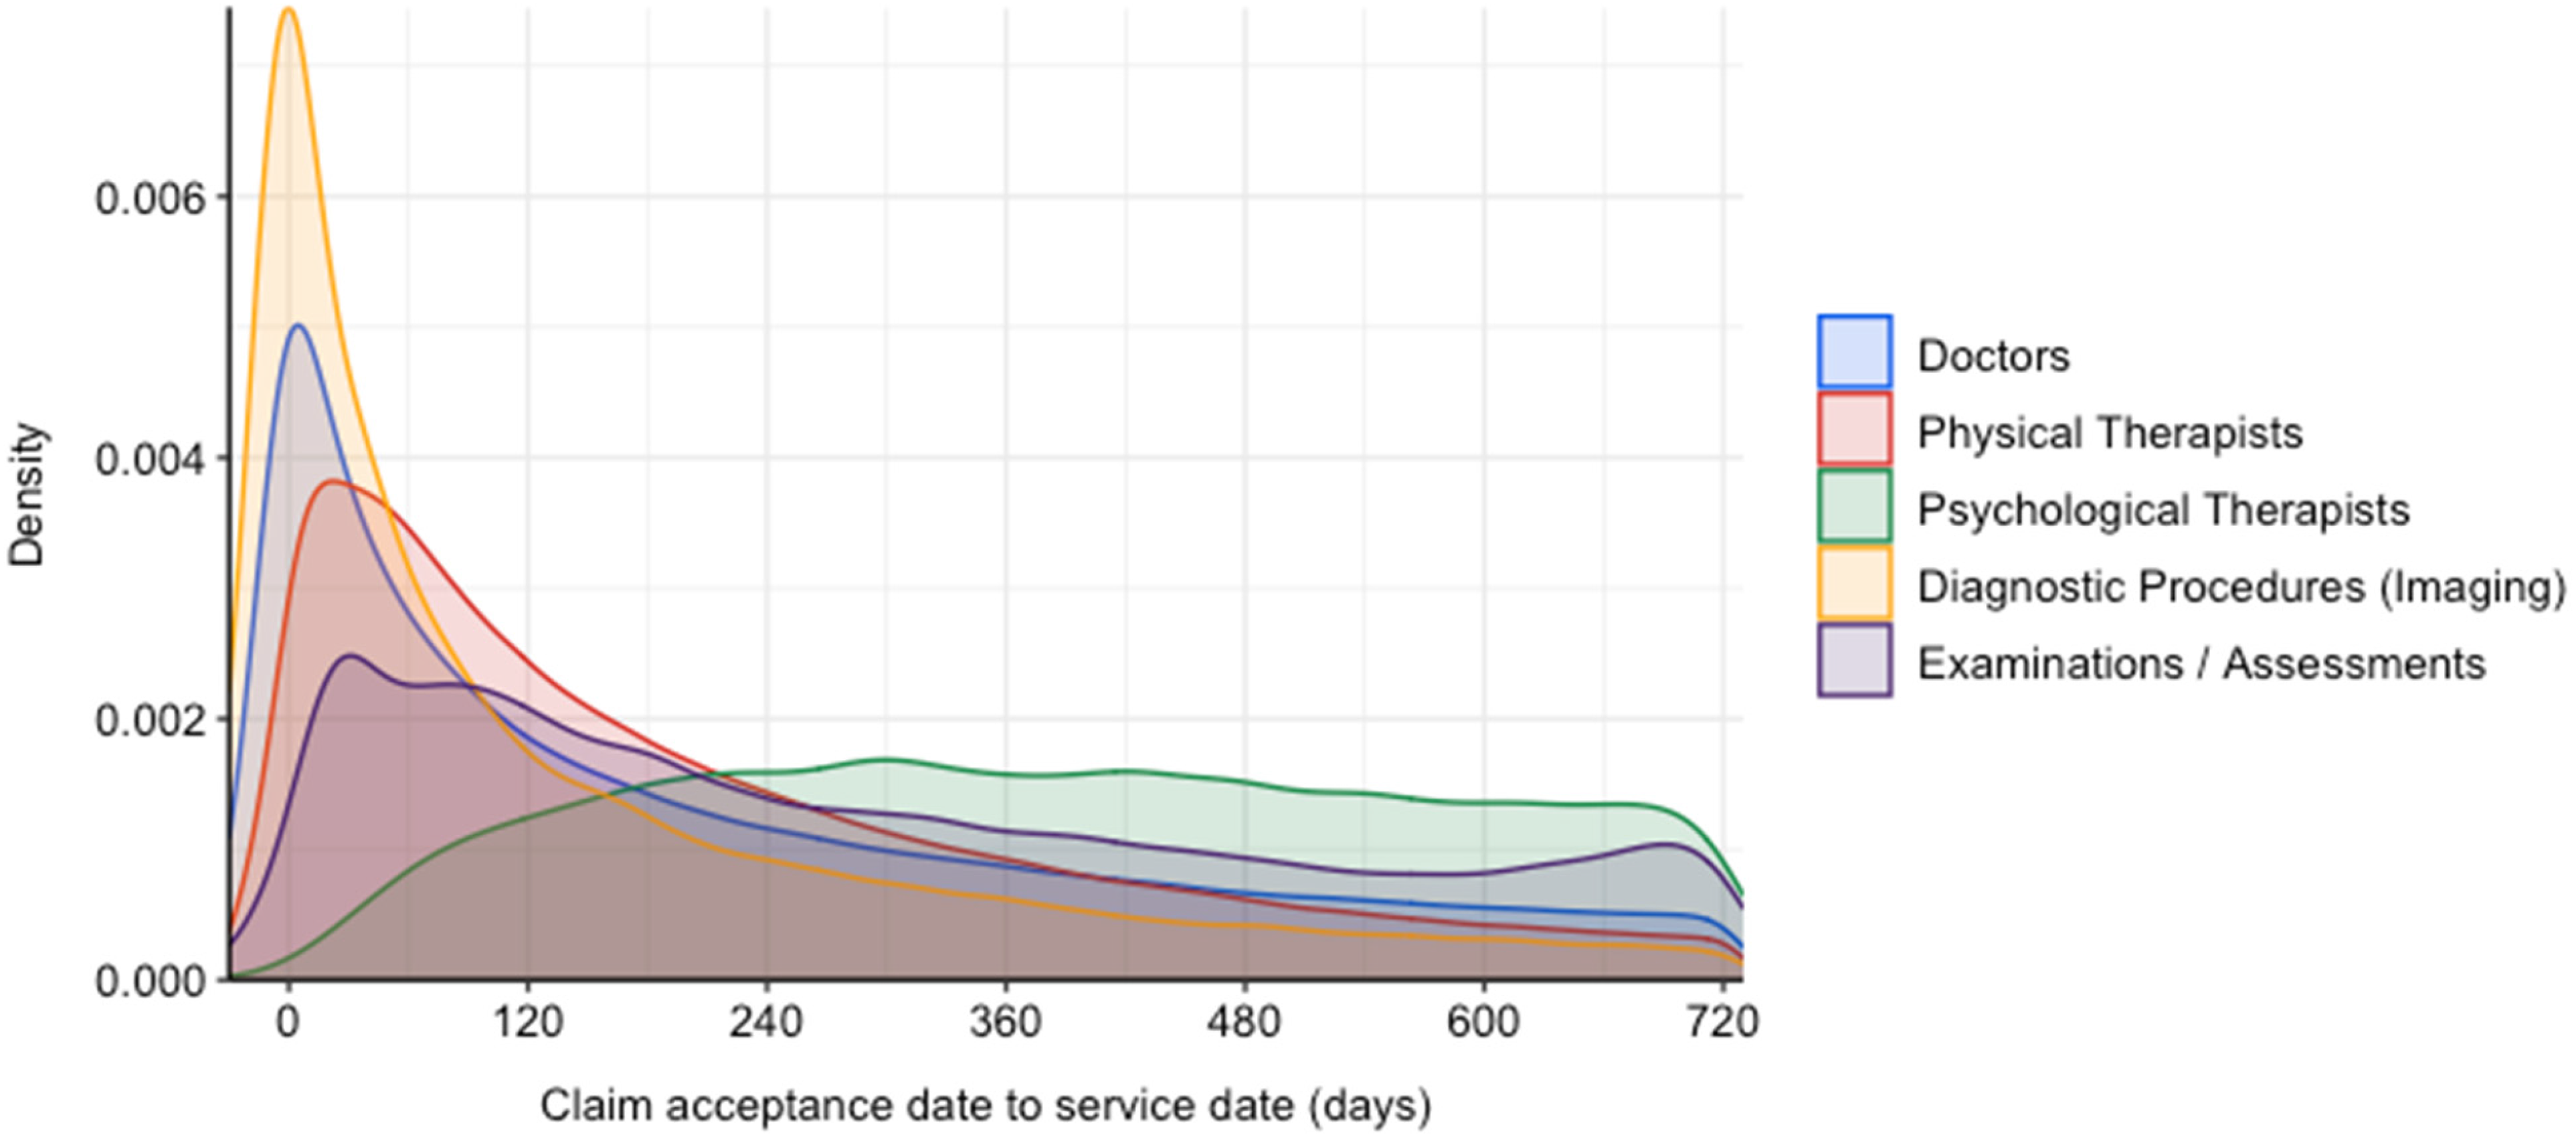
Timing of services relative to claim acceptance date.
Published analyses
The database has already been utilised in four published academic studies. In our first study, we explored the prevalence of diagnostic spinal imaging and its association with wage replacement duration. 68 We then used group-based trajectory modelling to identify patterns of opioid dispensing, and the association between these patterns and wage replacement duration. 69 We also assessed the variation in general practitioner services between jurisdictions in an exploratory analysis. 70 Finally, we examined the continuity of care provided by general practitioners and how this was associated with wage replacement duration. 71
Discussion
This project sought to harmonise claim- and service-level data across multiple Australian workers’ compensation jurisdictions. Previous efforts to utilise service-level data in the workers’ compensation sector have been specific to single jurisdictions. For example, the Compensation Research Database combined data from the Victorian workers’ compensation and Transport Accident Compensation Schemes into a single research database. 72 This database has since been utilised in a multitude of research projects but has only provided insight in a single Australian jurisdiction. In this paper we have described a process for collection, coding and harmonisation of data from multiple Australian jurisdictions. To date, all claims data and general practitioner, physical therapy, and psychological therapy services, diagnostic procedures and medical assessments have been harmonised across five workers’ compensation jurisdictions. Further, medicines data have been harmonised across the two available jurisdictions. The development of this database presents a number of future opportunities and benefits for workers’ compensation stakeholders including regulators, insurers, healthcare providers, researchers and workers.
The first potential application for the database is to gain a greater understanding of health service use in the Australian workers’ compensation sector. This potential has been demonstrated in our recent studies of imaging, opioid analgesics and GP service prevalence and patterns in compensated workers with low back pain.68–70,73 Future research would be able to analyse the use of different services, and the combination of services. Clustering methods, such as latent class analysis, have previously been used in more specific samples to measure types of service users.74,75 These same methods could be applied in future research using the database.
Administrative data has previously been used in quasi-experimental studies measuring the impact of policy changes such as benefit eligibility on incapacity duration.76–78 The database provides a new resource to measure the impact of policy interventions and reforms both inside and outside workers’ compensation systems on health service use. For example, the Australian Government ‘up-scheduled’ the commonly used opioid analgesic codeine from an over the counter to prescription-only medicine in February 2018. 79 Based on the findings of opioid dispensing research already conducted using this database, 69 such a policy change may have a substantial impact on opioid dispensing for compensated workers. This is the kind of policy reform that could be better understood using the new database.
This database presents a significant new resource for both research and workers’ compensation and healthcare stakeholders. The large-scale coverage of compensated Australian workers and their services data is a new development in the research and compensation sectors. The current version of the database has already been utilised in numerous studies and will continue to be expanded into additional research of compensated musculoskeletal disorder claims in the future. The methods refined in developing the database can also be applied to future efforts to harmonise workers’ compensation administrative data, including the expansion of the Multi-Jurisdiction Workers’ Compensation Database itself.
It is also important to note several limitations of the database. As a by-product of scheme regulation, administrative data only includes what a scheme was intended to capture. For example, information about a worker's claimed injury or illness is typically only described by the four Type of Occurrence Classification System variables – injury nature, location, mechanism and agency. While research benefits from this information being both standardised and structured, there is a lack of important information that would benefit any analyses, such as secondary symptoms or conditions and psychosocial factors. The database also only contains data about services funded by the included workers’ compensation systems. If a service was not deemed ‘reasonable and necessary’ by an insurer or claims manager, then it would not have been funded, and thus not captured in the administrative data. Other processes, such as data linkage, would be required to extend coverage to other healthcare schemes like the MBS. Some jurisdictions, due to policy limits, only pay for healthcare and income support up to certain limits, or after certain thresholds have been met. This means that data do not necessarily contain all healthcare services sought by a worker during a period of work incapacity. In particular, this limits insights into service use in short-term claims and the early phase of medium- to longer-term claims. Finally, research using this database will be retrospective. During the lag between the time an event occurs, data are captured, and then available for research may limit the currency of any research findings.
Next steps
There are a number of future steps to be undertaken with currently available data. First, we will complete the cleaning and harmonisation of the remaining services data, including services such as surgery, exercise physiology and other home modification and social services. Second, we will conduct further analyses including both newly cleaned services and combinations of services. Third, we aim to expand the database to include both additional claimed conditions (e.g. compensable mental health conditions) and a longer time series. Finally, we aim to expand access to future versions of the database. Consistent with information sharing agreements entered into with data custodians, researchers can currently access the data included in the database by either working directly our research team as collaborators or approaching single jurisdictions independently to request the raw data. In the future, we will seek to make de-identified data available through independently managed data request processes such as those that we have established previously with individual states. 72
The construction of this database has also meant the development of knowledge that may lead to standardised coding and collection of healthcare services data in the future. This would enable more straightforward data aggregation and simpler comparisons: a process that is currently challenging with the ‘siloed’ and disaggregated nature of healthcare services data in the workers’ compensation sector in Australia.
In the future, it may also be possible to attempt linkage of data to other relevant data sets (e.g. Medicare). This would dramatically expand the scope of data and its value but would require the use of identifiable data for either deterministic or probabilistic linkage. While challenging, this is achievable: linkage between workers’ compensation data and other data sources has been achieved in at least one Australian jurisdiction by our research team. 80
Supplemental Material
sj-docx-1-dhj-10.1177_20552076231176695 - Supplemental material for Development and initial application of a harmonised multi-jurisdiction work injury compensation database
Supplemental material, sj-docx-1-dhj-10.1177_20552076231176695 for Development and initial application of a harmonised multi-jurisdiction work injury compensation database by Michael Di Donato, Luke R. Sheehan, Shannon Gray, Ross Iles, Caryn van Vreden and Alex Collie in DIGITAL HEALTH
Footnotes
Acknowledgements
The following organisations supplied data for using the study: WorkSafe Victoria, WorkCover Queensland, Queensland Office of Industrial Relations, ReturnToWork South Australia, WorkCover Western Australia, and Comcare. The views expressed in this paper are those of the authors and are not necessarily the views of the data providers or study funders. The authors would like to thank the jurisdictional representatives and members of the COMPARE project advisory group for their support in gaining access to data and helpful input throughout the project so far. The authors would also like to acknowledge the invaluable assistance, advice and input of Dr Ting Xia, Professor Rachelle Buchbinder, Dr Yi-Lee Phang, Ms Dianne Beck and Dr Tyler Lane.
Availability of data and material
Data used in this paper are not available for distribution by the authors. The R analysis code used to analyse the data is available upon request.
Contributorship
MDD, LS, RI and AC conceived the database. All authors designed the database structure and services coding scheme. All authors contributed to the development of service operational definitions. MDD, LS, SG, RI and AC cleaned and harmonised the data. MDD, LS and AC conducted the preliminary analyses for this manuscript. MDD drafted the manuscript. All authors reviewed and commented on manuscript drafts. All authors approved the final version of the manuscript.
Declaration of Conflicting Interests
The authors declared no potential conflicts of interest with respect to the research, authorship and/or publication of this article.
Ethical approval
This study received ethics approval from the Monash University Human Research Ethics Committee (Project ID 17267, November 2018). Participant data were de-identified. Workers consent to use of data for research purposes when entering each of the workers’ compensation systems.
Funding
The authors disclosed receipt of the following financial support for the research, authorship, and/or publication of this article: MDD received a Research Training Program (RTP) Scholarship Stipend from the Australian Government during this project and is supported by a post-doctoral fellowship from the National Health and Medical Research Council Centre of Research Excellence on Low Back Pain (1171459). AC is supported by an Australian Research Council Discovery Project Grant (DP190102473) and an Australian Research Council Future Fellowship (FT190100218). SG is supported by an Australian Research Council Discovery Early Career Research Award (DE220100456). Funding for this project was provided by the Australian Research Council Discovery Project (DP10102473) and by Safe Work Australia.
Guarantor
MDD.
Supplemental Material
Supplemental material for this article is available online.
References
Supplementary Material
Please find the following supplemental material available below.
For Open Access articles published under a Creative Commons License, all supplemental material carries the same license as the article it is associated with.
For non-Open Access articles published, all supplemental material carries a non-exclusive license, and permission requests for re-use of supplemental material or any part of supplemental material shall be sent directly to the copyright owner as specified in the copyright notice associated with the article.