
Abstract
Objective
In contrast to the rising amount of financial investments for research and development in medical technology worldwide is the lack of usability and clinical readiness of the produced systems. We evaluated an augmented reality (AR) setup under development for preoperative perforator vessel mapping for elective autologous breast reconstruction.
Methods
In this grant-supported research pilot, we used magnetic resonance angiography data (MR-A) of the trunk to superimpose the scans on the corresponding patients with hands-free AR goggles to identify regions-of-interest for surgical planning. Perforator location was assessed using MR-A imaging (MR-A projection) and Doppler ultrasound data (3D distance) and confirmed intraoperatively in all cases. We evaluated usability (System Usability Scale, SUS), data transfer load and documented personnel hours for software development, correlation of image data, as well as processing duration to clinical readiness (time from MR-A to AR projections per scan).
Results
All perforator locations were confirmed intraoperatively, and we found a strong correlation between MR-A projection and 3D distance measurements (Spearman r = 0.894). The overall usability (SUS) was 67 ± 10 (=moderate to good). The presented setup for AR projections took 173 min to clinical readiness (=availability on AR device per patient).
Conclusion
In this pilot, we calculated development investments based on project-approved grant-funded personnel hours with a moderate to good usability outcome resulting from some limitations: assessment was based on one-time testing with no previous training, a time lag of AR visualizations on the body and difficulties in spatial AR orientation. The use of AR systems can provide new opportunities for future surgical planning, but has more potential for educational (e.g., patient information) or training purposes of medical under- and postgraduates (spatial recognition of imaging data associated with anatomical structures and operative planning). We expect future usability improvements with refined user interfaces, faster AR hardware and artificial intelligence-enhanced visualization techniques.
Keywords
Introduction
The hype for augmented reality (AR) has not only been limited to consumer technology but also found its way into the medical domain. AR – in contrast to virtual reality, where a user is immersed in a virtual world – permits an interactive and simultaneous presentation of virtual information in the real world. In a kitchen planning example, virtual reality immerses the user in a virtual environment to visualize the kitchen. By contrast, AR glasses allow to visualize virtual furniture with the user in the real kitchen observing their planned alignment.
Although AR technologies have been developed for surgical planning in different disciplines1–3 and used especially in the field of neurosurgery, 4 their widespread application for surface markings in surgical interventions on soft tissues remains so far limited.5,6 The advantages of AR for surgical planning include hands-free application, simultaneous multi-modal presentation of patient-specific data, and a focused site-centered workflow.
Healthcare and information technology have something in common, both industries are primarily centered on a target group: patients in the former or end-users in the latter. By contrast, the end-users of medical technology are predominantly clinicians, usually involved late in the development process, 7 where a product is closer to market readiness. 8 Given that predicted spending for research and development in medical technology was estimated to reach 34.3 billion USD in 2021, 9 the consideration of end-users only in late stages of development carries significant risks. Scientific data to support this hypothesis is difficult to find in the medical literature, since this type of data either concerns startups not making it into the market or involves access to internal entrepreneurial documents of products shelved during the end-product stage.
An important parameter for technology assessment is usability, which contains, among others, features of effectiveness, efficiency, memorability and applicability.10–13 Polls by use of questionnaires have become the most popular form for usability assessments since they are less expensive than qualitative evaluations such as interviews, reproducible for follow-up purposes and provide diagnostic information about usability issues.14–16 In business models, early usability considerations have a proven benefit for reducing time spent on development 17 and its associated costs. 18
The primary aim of this pilot study was to assess the usability of an AR project using magnetic resonance imaging and three-dimensional surface scanning on the human body during workflow and user interface development for planning of autologous abdominal-based reconstructive surgery. Secondary outcome parameters were the workload expressed in personal hours, data transfer load and time-to-clinical readiness.
Methods
This pilot study was grant supported by the Austrian Research Society FFG (grant number: 867536 / eCall: 16967188) and approved by the institutional ethical board of the Medical University of Graz (vote #: 31-360 ex 18/19). It was conducted at the Division of Plastic, Aesthetic and Reconstructive Surgery, Department of Surgery at the Medical University of Graz between November 2018 and April 2021.
The clinical use case was the surgical planning stage of a free abdominal-tissue-based free deep inferior epigastric artery perforator flap (DIEAP flap), which is a routine procedure for autologous breast reconstruction. 19 Imaging modalities included magnetic resonance imaging and angiography (MRI and MR-A) for perforator visualization, three-dimensional surface scanning of the trunk for soft-tissue deformity algorithm calculation, and Doppler ultrasound exams for verification of AR-based markings. The anatomical region of interest in this study concerned the soft tissue overlaying the abdominal wall, where changes in position occur depending on the patient's posture. To calculate this deformation more accurately, an algorithm was developed, which has been published previously. 20 For AR visualization, we used the Magic Leap Version 1 (Magic Leap Inc., Florida, USA), which has a head-mounted display to project holograms to the headset wirelessly. Anatomical landmarks were required to manually align the deformed MRI/MR-A with the patient's trunk. The anatomic landmarks included the xiphoid process, umbilicus and both anterior superior iliac spinae. The additional overlay landmarks were the oil-based fiducials (the fiducials were visible on MRI/MR-A images, on the 3D-surface scan and of course on the patients’ body). The fiducials on the patient's skin were kept during the whole workflow and were used for alignment/calibration.
Patients
Ten patients who were scheduled for elective autologous breast reconstruction using a DIEP flap were assessed for inclusion. The criteria for patient selection were as follows: patients in their first operative treatment after mastectomy; patients with a secondary operative reconstruction; and, patients must be able to provide written informed consent.
Workflow
The pilot study workflow involved the following six steps: (1) image acquisition (MRI and MR-A, 3D-scan, Doppler ultrasound), (2) image preparation, (3) patient detection and AR visualization, (4) usability evaluation, (5) Doppler ultrasound verification of perforator location and (6) evaluation of secondary parameters (size of data transmitted and personnel costs in software development and time-to-clinical readiness) (Figure 1) [Scan the QR-Code in Figure A1 to watch a demonstration video online].

Flow chart showing patients workflow.
Usability
Usability was assessed by two consultant surgeons and one resident by the System Usability Scale (SUS). The SUS is widely used and accounts for 43% of post-study questionnaires in the literature. 21 The 10-question paper-pencil questionnaire is based on a 5-point Likert scale (1 = strongly disagree; 5 = strongly agree). The calculated combination yields an overall usability score ranging from 0–100%. 22 A modified score ranking by Bangor et al. was used to interpret the overall usefulness of each patient. 23
Verification of perforator location
For objective measurements, we provided the following three lengths in Millimeters (mm) (Table A5). The 3D distance defined the distance of the ultrasound marking on the skin to its perforating vessel location on the abdominal wall. The MR-A projection defined the perpendicular distance of the MRI/MR-A, algorithm, 3D-surface scan-defined location on the skin to its perforating vessel location on the abdominal wall. The 2D distance was the distance of the two previously mentioned points on the skin. The 3D distance was defined as control.
For objective evaluation of the obtained data, we compared the length of the MR-A projection (obtained from the MRI/MR-A data) and the 3D distance (assessed by ultrasound) (GE healthcare, Logiq E10 series, Chicago, IL, USA) in mm. The 2D distance of less than 40 mm, which described the distance between the defined perforator locations by MRI/MR-A and ultrasound, on the highly movable abdominal skin, was defined as clinically acceptable. All perforator locations were also verified intraoperatively.
Size of data transmitted
Diagnostic imaging requires a great amount of memory in hospital IT-systems. The project challenged to decompose large DICOM file size data into small image files, AR glasses ready. DICOM is one of several medical image file formats. It is used to standardize images generated by image acquisition modalities. 24 To downsize DICOM to transferable file size, we used segmentation, registration and deformation processing. In every step, the image got processed, and file size data was collected. We have already published a paper that addresses the specific processing methods in detail. 20
Statistical analysis
Data was analyzed with the statistical software SPSS (version 28; IBM Corp., Armonk, NY, USA). We reported parametric data using means ± standard deviation (SD) and non-parametric data using median (IQR, 25–75 percentiles), where appropriate. The correlation between MR-A projection and 3D distance was assessed by the Spearman coefficient.
Results
Patients
Following informed consent MRI and MR-A, data was obtained from 10 patients scheduled for elective autologous breast reconstruction using an abdominal-based fat and skin flap for free tissue transfer (DIEAP flap). The mean age of the finally included patients was 46.6 years (median: 49.5 years; range: 33–53 years), and the mean body mass index was 28.4 (median: 28.7; range: 19.5–35.3). All data were collected preoperatively.
Augmented reality visualization and perforator evaluation
In the AR software app, the alignment of the processed data to the actual patient's body was performed manually for each patient. This calibration step involved the overlaying of the anatomical landmarks and fiducials before proceeding to the ultrasound verification. The user interface allowed to align and manipulate the hologram manually on top of the patient's trunk (Figure A3), as well as to manipulate the MRI's appearance by virtually changing its settings (Figure A4).
We found a strong correlation between the MR-A projection and the 3D distance measurements (Spearman r = 0.894) (Figure A2). All but one 2D distance measurement were within the limits of the defined offset (Table A1).
Usability
In the seven evaluated patients, the total mean score for the SUS was 67 (SD 10). Using one classification system, 23 the AR setup in development qualified as a ‘moderate to good’ system (Figure 2). The total score per question is represented in Table 1. Three patients served as participants in the proof-of-concept evaluation of the steps in the workflow, which was required by ethical board standards. The data of these three patients was not used for the usability analysis.

Quantitative and qualitative representation of the overall usability.
System usability scale (SUS): Total score min = 0, max = 100.

Personnel deployment
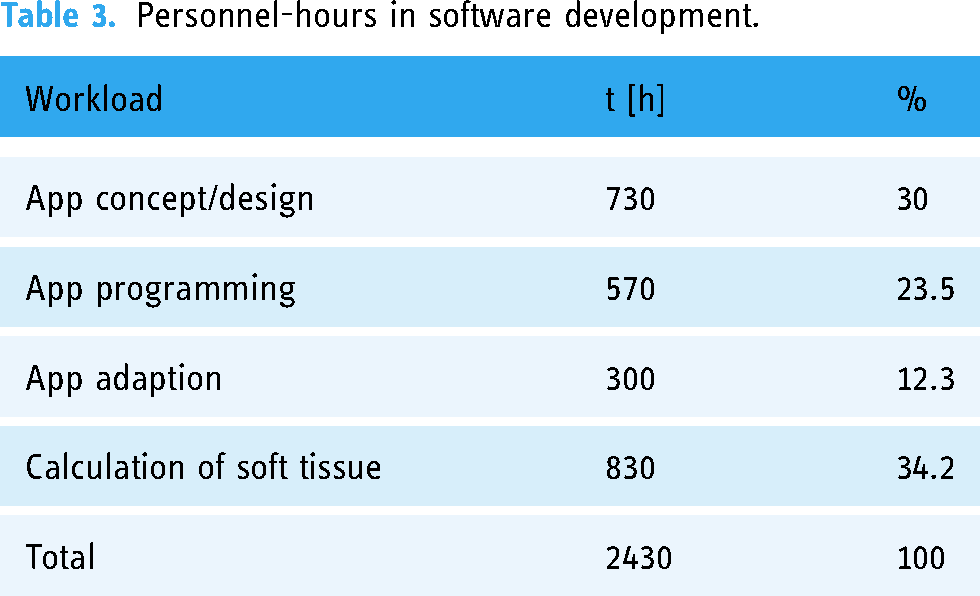
Table 2 lists, in chronological order, image acquisition, image processing, patient detection and visualization, including implementation time and personnel, required for each. The total implementation time was 173 min. Five modalities in the extent of 85 min in all three categorized work steps required the presence and activities of a consultant plastic surgeon (CS) (Doppler ultrasound, anonymization process, superimposition of the hologram on the patient), as well as a radiologist (preparation for MRI/MR-A, data transfer for anonymization); 45 min were required for the MR-A by two radiology technicians. The preparation of the RGB-D camera, as well as the subsequent RGB-D scan took 25 min (research assistant/scientific personnel SP). Image processing, as well as detection and visualization, required 81 min by one software engineer (Table 2). Personnel hours in software development reached a total of 2430 h, dividing 65.8% in app development and 34.2% in soft tissue calculation (Table 3).
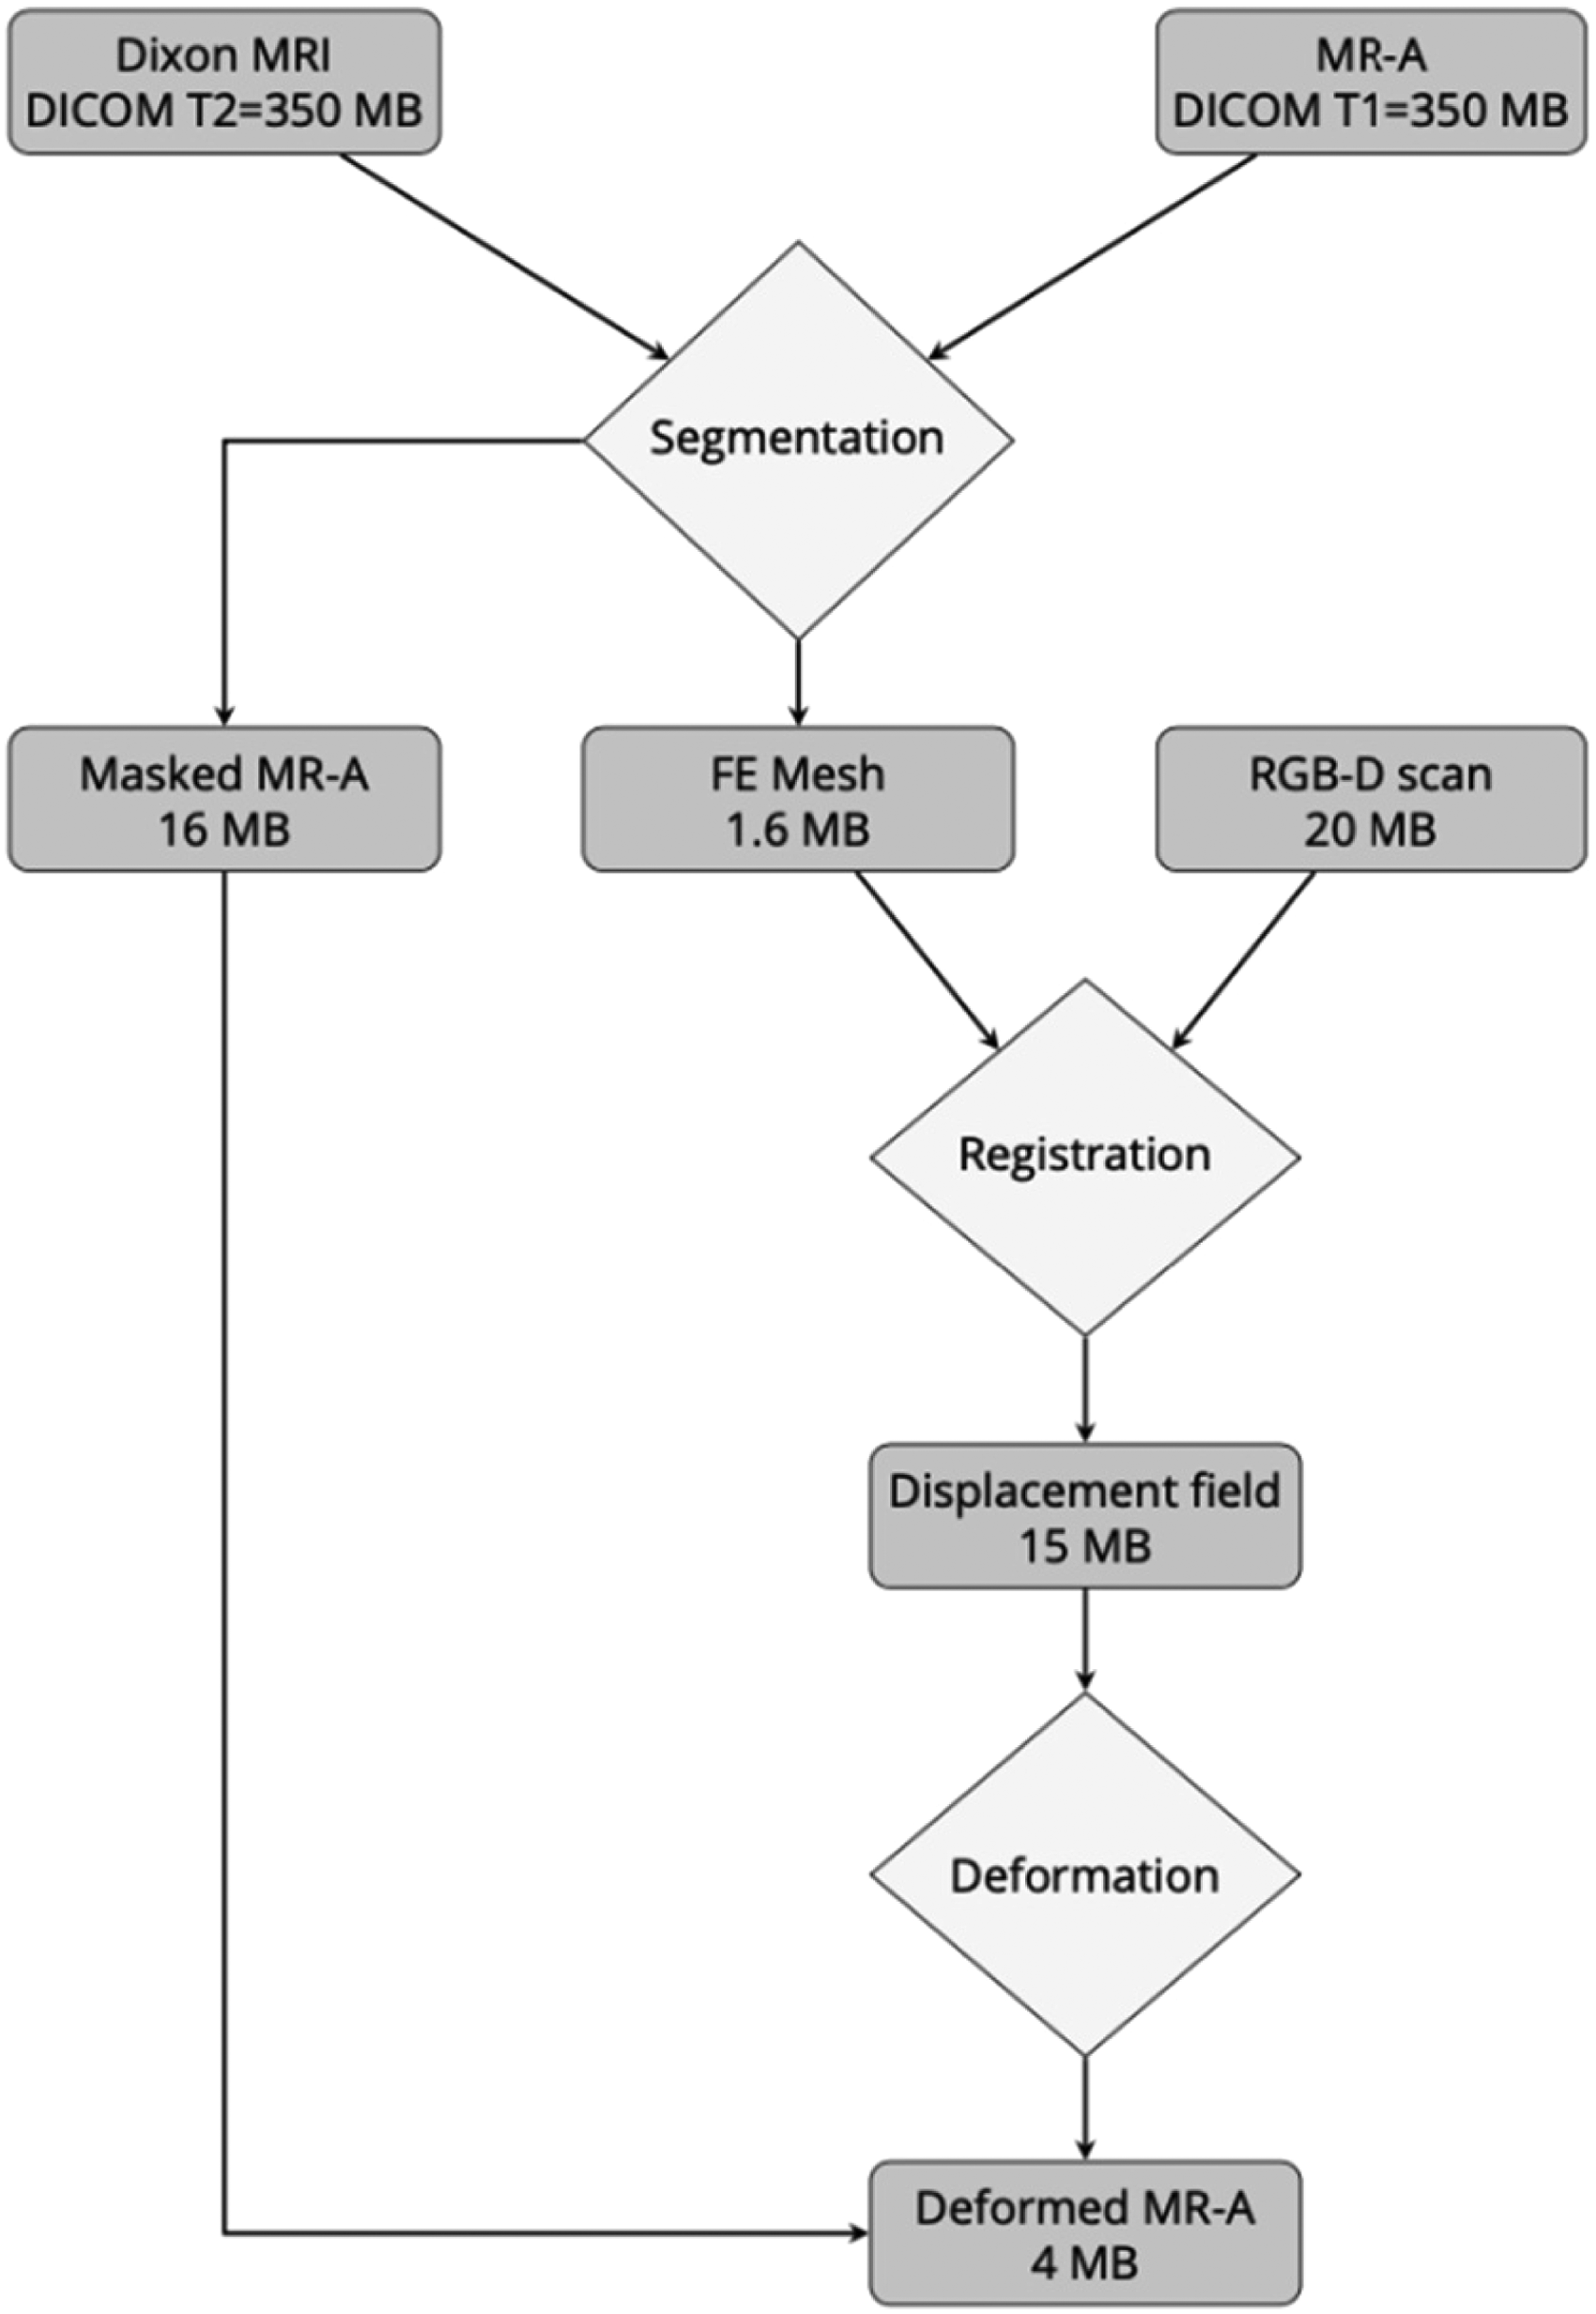
Transmitted data sizes in image preparation (see Table 2). Magnetic resonance imaging data (Dixon MRI DICOM T2) plus magnetic resonance angiography data (MR-A DICOM T1) data required a storage capacity of 350 + 350 = 700 MB. After segmentation, MRI and MR-A resulted in 1.6 MB of FE mesh images and 16 MB of masked MR-A images, respectively; 20 MB of the surface RGB-D scan images in combination with FE mesh images were saved to a 15-MB displacement field data file. Displacement field data and masked MR-A images operated as input variables for the deformation process. Deformed MR-A resulted in a final size of 4 MB ready for upload to the augmented reality (AR) system.
Worksteps itemized in three categories.

CS: consultant plastic surgeon; SP: scientific personnel; RT: radiology technician; SE: software engineer.
Personnel-hours in software development.
Discussion
The SUS of this AR-goggle-based clinical setup to superimpose MR-A data on patients for preoperative planning was rated as ‘moderate to good’ by experienced clinicians after a total of 2430 documented personnel hours for software development.
The spatial orientation and superimposition was perceived as an asset for clinical personnel. The markings by readily applied conventional methods (e.g., Doppler probe, Doppler/duplex ultrasonography and distance from umbilicus based on CT-A/MR-A data) are sufficient to the experienced surgeon, and they considered the AR system as ‘nice, but not necessary tool for clinical practice’. Ideally, the current AR technologies can already be used for teaching purposes to improve spatial knowledge and to learn key steps during surgery for medical undergraduates or surgical residents in training either on patients or phantom models.25,26 Furthermore, three-dimensional holograms in AR can be used to preoperatively enhance patient education by supporting visualizing medical content. 27
Depending on a study's purpose, there are 24 standardized usability assessment tools with different validity and reliability schemes available. 10 Sauro and Lewis, both pioneering experts in the field of user experience, classified the focus of usability tools in the post-study (like the SUS) and post-task questionnaires. Alternatives suitable for our study setup were the Questionnaire for User Interaction Satisfaction, 28 the Software Usability Measurement Inventory 29 and the Post-Study System Usability Questionnaire.16,30 Still additional alternatives exist, 31 but the SUS is nonetheless the fastest to apply during one evaluation session (less than 1–2 min), an easy-to-understand instrument for assessing a wide range of types of technology, and last but not least one of the oldest and most commonly published usability scores. 32
Other authors with similar clinical endpoints examined hardware usability.33,34 To our knowledge, ours is the first report on AR glasses on a patient cohort while simultaneously performing a usability assessment.
The development process required significant input from clinical experts (= the potential future users), and interdisciplinary communication was key. Taking into account clinical scheduling practices, and multiple steps in a non-automated workflow from different locations, it is easy to fathom forgetting the end user along the way, causing a negative impact on user satisfaction. 35 Personnel hours in software development formed the greatest block of investment costs, in which one third was dedicated to the soft tissue alignment algorithm.
The amount of time invested in the concept and design process exceeded the duration for programming the AR-application by 6.5%. Therefore, the core of every project in software development depends primarily on its correct functioning, not its actual design, 36 which is usually oblivious to the end user.
But personnel costs for creating-, processing- and visualizing patient images were at the lower end in the project plan, and bear lessons for future endeavors.
As we traced the image preparation process, data files revealed AR upload file sizes as low as 4 MB (Figure 3). For this reason, we assume that current hardware specifications are limiting clinical use cases. In our opinion, the presented setup if automated (e.g., by linking different application programming interfaces) under a single server infrastructure and with faster AR-hardware can facilitate spatial perception for preoperative surgical markings. We believe that this will in turn positively affect future usability evaluations.
Augmented reality setups provide new modalities, notably on a visual level, which differ significantly from the status quo or state-of-the-art in the healthcare sector. To assess the potential of AR for future implementation in the operating theatre, we addressed the usability features in this pilot and kept the visual distractors in the AR environment to a minimum by providing only the necessary features for alignment and visualization in the preoperative setting. Based on the feedback and experience we made future technical improvements notably hardware, support by artificial intelligence and especially graphical acceleration can overcome some of the usability restraints, which we observed. Overall, the presented AR setup was assessed in a pilot study and was from a usability point of view at this stage no candidate to surrogate conventional methods for the experienced surgeons. Future follow-up studies will most likely rely on improved hardware and can be assessed for better surgical planning.
Limitations
The presented setup involved human interaction (no automation, no application programming interface used for data exchange among collaborators) in four different locations with a net workload of 173 min until clinical readiness on the AR system, and the evaluation considers therefore a pre-automation/implementation scenario.
The commonly encountered usability issues were spatial orientation for function keys in the AR system (not for the MR-A images on the patient), handling of the system functions (the system supplied manual remote was better to apply the function keys than trying within the AR environment by use of fingers), and the lagging/fluency of MRI/MR-A images.
Conclusions
The better integrated and less complicated to use future AR systems, not only just for tech-savvy clinical youngsters but also for experienced clinicians, the higher the potential for such technology to make it into the medical device market. Understanding the current limits of the technology and its high value for educational purposes in a training context (spatial recognition and simulated execution of operations) can help developers to turn well-placed AR projects into game changer. We believe that the presented usability assessments and interdisciplinary cooperation can serve as useful guidance for future development.
Footnotes
Acknowledgements
The authors would like to thank all those who have actively collaborated in this study.
Contributorship
DBL, LPK, MFB and BM researched literature and conceived the study. MFB and BM were involved in protocol development, gaining ethical approval, patient recruitment and data analysis. RW, ACT, BS, RH, MG, GR and DBL were involved in patient examination and execution of study methods. MFB wrote the first draft of the manuscript. All authors reviewed and edited the manuscript and approved the final version of the manuscript.
Declaration of conflicting interests
The author(s) declared no potential conflicts of interest with respect to the research, authorship, and/or publication of this article.
Ethical approval
This study was approved by the institutional ethical board of the Medical University of Graz (vote\#: 31-360 ex 18/19).
Funding
The author(s) disclosed receipt of the following financial support for the research, authorship, and/or publication of this article: This study was grant supported by the Austrian Research Society FFG (grant number: 867536 / eCall: 16967188).
Guarantor
DBL.
Appendix
Perforator measurements.

| Patient | Perforator 1 | Perforator 2 | Perforator 3 | Perforator 4 | ||||||||
|---|---|---|---|---|---|---|---|---|---|---|---|---|
| MR-A |
3D |
2D |
MR-A |
3D |
2D |
MR-A |
3D |
2D |
MR-A |
3D |
2D |
|
| P01 | 23.76 | 25.41 | 9.03 | 18.33 | 25.74 | 18.07 | ||||||
| P02 | 42.77 | 53.11 | 31.49 | 39.82 | 56.30 | 39.80 | 46.09 | 46.63 | 7.08 | |||
| P03 | 42.94 | 47.85 | 21.11 | 35.49 | 37.49 | 12.09 | ||||||
| P04 | 15.06 | 15.27 | 2.54 | 22.66 | 23.31 | 5.45 | 20.25 | 21.76 | 7.97 | 13.09 | 15.38 | 8.08 |
| P05 | 20.92 | 22.05 | 6.98 | 32.48 | 33.95 | 9.89 | 24.78 | 53.28 | 47.16 | |||
| P06 | 21.18 | 36.35 | 29.54 | 25.37 | 31.32 | 18.36 | ||||||
| P07 | 15.57 | 22.94 | 16.85 | 21.31 | 23.74 | 10.45 | ||||||
| P08 | 60.89 | 64.05 | 19.84 | |||||||||
| P09 | 24.21 | 41.99 | 34.31 | 15.46 | 19.42 | 11.76 | 15.44 | 18.02 | 9.29 | |||
| P10 | 23.56 | 38.87 | 30.91 | 40.11 | 43.28 | 16.26 | 45.21 | 48.76 | 18.26 | |||