
Abstract
Background
Multiple Sclerosis (MS) is a chronic and progressive neurological autoimmune disease currently affecting 250,000 individuals in Germany. Patients suffering from the disease can be severely impaired in their day-to-day activities. BRISA is a digital app specifically designed to help MS patients monitor their disease by regularly tracking symptoms. Lengthy and time-consuming questionnaires for patient-reported outcomes (PRO) are the standard method to assess the patients’ current condition. Here, we examine whether simplified versions of these questionnaires can provide comparable information regarding individual symptom presentations in BRISA users.
Methods
828 users were included in the analysis. Patients who provided onboarding information and answered at least one questionnaire and the corresponding simplified smiley symptoms assessment were included. Correlation of questionnaire and symptom scores was calculated using Pearson's correlation.
Results
Our analysis cohort predominantly consisted of female, 26–55-year-olds. Relapsing-remitting MS (RRMS) was the most common MS type recorded. Most patients were diagnosed 2–5 years ago. Questionnaires regarding fatigue and vision impairment were among the most answered, those regarding bowel movement and sexual satisfaction received fewest responses. Overall, the scores from questionnaires and symptoms correlated positively. Scoring correlation could also be shown across the subgroups divided by gender, age groups, type of MS, and time since diagnosis of the disease.
Conclusion
Scores recorded from traditional PRO questionnaires can be reflected more easily as a trend in a simplified scale using smileys. Nevertheless, traditional questionnaires are needed to also maintain a more objective assessment. In conclusion, the patient will benefit most from an adaptive combination of regular traditional PRO questionnaire assessments and simplified symptom recording.
Introduction
Multiple sclerosis (MS) is a progressive and chronic neurological autoimmune disease of the central nervous system. 1 It is one of the most common neurological diseases worldwide with approximately 2.8 million people diagnosed in 2020, corresponding to an average of 35.9 per 100,000. 2 Approximately over 250,000 individuals with an MS diagnosis are currently living in Germany, 3 with an incidence rate of 19 in western Germany vs. 15 in eastern Germany. 4 The frequency of MS varies by geographical region throughout the world, increasing with distance from the equator in both hemispheres. 5
MS patients usually show a very individual course with diverse symptoms and manifestations. The disease is divided into different subtypes such as the relapsing-remitting MS (RRMS), primary progressive MS (PPMS) and secondary progressive MS (SPMS). 6 Relapsing patients experience new or recurrent neurological dysfunctions, 7 whereas progressive patients develop different neurological symptoms in a more continuous way. 8 Relapses, as well as progression, can both include a variety of clinical presentations including but not limited to fatigue, impaired motor function, spasticity, generalized pain, gait disturbance, speech problems, and cognitive impairment.9,10 If these symptoms do not partially or fully resolve, but even progress over time, patients often suffer from increasing limitations in coping with everyday tasks, 11 which not only hinders them in terms of their independence, but also often represents a psychological burden. 12
Although treatment opportunities have been improving in recent years, 10 MS is considered to be an incurable disease. 9 To date, MS patients in Germany normally visit their physicians approximately two to three times a year, leading to long periods between physical assessments. 13 As MS is highly individualistic - and with global cases of MS on the rise - understanding the course of pathogenesis of this condition and closing the gap in the patient care sector is essential for offering MS patients the opportunity to experience a better quality of life. 14 Digital companion apps might be considered an option for many patients. 15 The collection of real-life data on a longitudinal basis is becoming increasingly important to the overall understanding of this condition, namely in terms of its progression and pathophysiology.9,16 Monitoring symptoms could be crucial to detect relapses and identify progression. Ziemssen et al. have already shown the importance of a physician-completed tool to support physician-patient interaction in assessing signs of disease progression to SPMS and uncovered the need for supporting tools. 17 The possibility of close symptom monitoring by patients themselves could make a crucial contribution to knowledge about and identification of signs of disease progression.
BRISA is a digital health companion app developed for users in Germany diagnosed with MS. The aim of this app is to offer guidance, support, and advice to those with this condition, helping patients to better understand their diagnosis and individual disease progression. In our previous publication, we were able to demonstrate that the demographics of BRISA users are representative of the German MS patients and that specific symptoms are tracked together more often than others. 18 BRISA users are regularly asked to fill in short questionnaires every two weeks and smiley-based symptom scores daily to monitor their symptoms as well as to determine their change and possibly progression.
Validated and regularly used patient-reported outcome (PRO) questionnaires are a proven method for collecting information about disease progression, quality of life, and real-world data related to a specific indication.19,20 Length and complexity make surveys intended to regularly track symptoms tedious to complete for app users and thus affect the quantity and reliability of the generated data. 21 Simplified and user-friendly versions of these questionnaires could still be useful to extract valuable information regarding individual disease progression. In the case of BRISA, users are regularly provided with a catalogue of several MS-related symptoms, which they can evaluate in terms of their severity using a smiley-face-based rating system. The purpose of this analysis was to generate insights derived from the validated PRO questionnaires and symptom scores and to determine whether or a not a correlation exists between the simplified symptom scores and the well-established PRO questionnaire scores of BRISA users.
Methods
Data source
BRISA is a smartphone application available for Android and iOS devices intended to support MS patients in their day-to-day lives by offering guidance and advice in a variety of areas. It is a free application that can be downloaded from the German App Store by anyone who owns a mobile device with Android or iOS software. Patients can track and monitor their symptoms over time by regularly answering questions related to the severity of their symptoms and completing standardized questionnaires.
Inclusion criteria of study cohort
This retrospective, descriptive analysis consists of data from BRISA users who registered between August 6, 2021 and April 6, 2022 and provided their consent for use of their demographic and health-related data for scientific purposes. Patients were grouped and analysed according to their MS type, age group, and time since MS diagnosis. Detailed distribution of user data points is listed in Supplemental Table 1.
Overview demographic characteristics of study cohort.

The inclusion criteria were as follows:
Age 18–80 years Gender reported MS type reported Year of diagnosis reported Consent for health data usage for scientific purposes Answered at least one questionnaire completely. In case a questionnaire was answered multiple times, the earliest response was considered for each user. Answered at least one corresponding symptom within the specific recall period. In case a symptom was answered more than once, the response closest to when the corresponding questionnaire was answered was considered. In all cases, the symptoms should be answered before or on the same day as that of their corresponding questionnaires.
Data collection
After registration, users are asked the fill in their demographic data (such as year of birth, year of diagnosis, and gender) and health data (such as MS-type and symptoms of concern). The information is collected via a chatbot, a software application that initiates a human-like text conversation. Users could choose to track any (one or more) of 19 symptoms that are of interest to them, including “depression”, “bladder disorders”, “bowel disorders”, “leg-foot-lifting disorders”, “fatigue”, “visual disturbances”, “pain”, “cognitive disorders”, “concentration disorders”, “forgetfulness” and “sexual dysfunction”. As shown in Figure. 1, symptoms were rated using five different smileys ranging from “very sad” to “very happy”. These smileys were assigned a score of 0–4, with “very sad” being given a score of 0 and “very happy” a score of 4. The corresponding response, question and time stamp were recorded.

Smiley-face based rating system used in BRISA app.
In the “detail-check”, users are asked to fill standardized medical questionnaires every 2 weeks. The questionnaires implemented in BRISA and used for analysis were:
Beck Depression Inventory - Fast Screen (BDI-FS) Bladder Control Scale (BLCS) Bowel Control Scale (BWCS) Patient-determined Disease Steps (PDDS) Modified Fatigue Impact Scale – 5-Item Version (MFIS-5) Impact of Visual Impairment Scale (IVIS) MOS Pain Effects Scale (PES) Perceived Deficits Questionnaire – 5-Item Version (PDQ-5) Sexual Satisfaction Scale (SSS)
Except the “Beck Depression Inventory” and “Patient-determined Disease Steps”
22
all questionnaires used for this study are taken from the Multiple Sclerosis Quality of Life Inventory.
23
For a more detailed description of the used questionnaires check supplement methods.
All data were stored and processed in a General Data Protection Regulation (GDPR)-compliant manner. Using a customized ingestion API, data was anonymized and ingested into a secure Data Lake infrastructure. This data was further structured and inserted into pre-structured tables in a PostgreSQL-Database. A reporting and data integration dashboard solution (Permea Dashboard) was used to access and visualize the data from the precalculated tables.
Data processing and analysis
Data processing and analysis were performed using Python (version 3.9) on the Permea Data Platform. The data under investigation were loaded from the pre-calculated tables and further processed based on individual study criteria (see sections 2.4.1 and 2.4.2). Demographic data were analyzed and used as a basis for the analysis of correlations. The correlation between questionnaire score and symptom score was analysed for the total users as well as for the subgroups gender, age, MS type, and time since first MS diagnosis. To analyse the correlation between symptom and PRO scores, the symptoms examined were assigned to the questionnaires to create Questionnaire symptom pairs (QSP)-as follows:
BDI-FS → depression BLCS → bladder disorders BWCS → bowel disorders PDDS → leg-foot-lifting disorders MFIS-5 → fatigue IVIS → vision PES → pain PDQ-5 → cognition disorders, concentration disorders, forgetfulness SSS → sexual dysfunction
Although there are sub-scores available within the PDQ-5 questionnaire, the four subscales tend to correlate highly with one another, which limits their usefulness to some extent.
24
Therefore, in the case of the PDQ-5 questionnaire, the average of the scores of the assigned symptoms was used.
Additionally, we assessed the response rate across the nine QSPs.
Statistical methodology
Statistical analysis was performed using Python (version 3.9). All survey inventories except BLCS yielded satisfactory Cronbach alpha values, therefore, BLCS was not considered during further data analysis. Descriptive statistics was mainly used to characterize BRISA users. The correlations between questionnaire scores and symptom scores were determined using Pearson correlation. A correlation coefficient of 0.3−0.5 was considered as a moderate correlation, 0.5 and higher was a strong correlation. 25
Results
Demographic characteristics of users and response rates of study cohort
In total, we analysed 1557 QSPs from 828 users resulting in an average of about two QSPs per user. As seen in Table 1, 696 (84.1%) users were female, and 132 users (15.9%) were male. The mean age of our study cohort was 39.7 (±10.6) years and 87.6% users reported being diagnosed with RRMS. Furthermore, the mean time since diagnosis was 7.2 (±6.5) years.
To gain further insights into the response rate of questionnaires and symptoms, we analysed the amount of answered QSP, and additionally divided into sub-categories regarding gender, age group, time since diagnosis and MS type. As seen in Figure 2, most answers were registered for the IVIS QSP (23.7%). Lowest response rates were seen for SSS (3.9%) and BDI-FS (4.7%). As shown in Supplemental Table 2, the response rates were also consistent across the sub-categories. Our analysis also showed that all users in our cohort answered the questionnaire and respective symptoms on the same day.

Response rates for QSP. Data was collected from a total of 828 users who answered one or more questionnaire-symptom pairs (total answered QSP = 1557).
Correlation between questionnaire and symptom scores
To evaluate whether the scores given in the questionnaires correlate with the smiley score given in the symptom assessment, we performed the correlation analysis for each QSP in the sub-groups of age, time since diagnosis and MS-type.
In the age group 26–35 years we observed a moderate correlation for the QSP BDI-FS, PDQ-5, and SSS, whereas the strongest correlation was observed for the QSP BWCS, MFIS-5, and IVIS (Figure 3). In the age group 36–45 years the correlation distribution was similar, though compared to the younger users, PES showed a moderate correlation. Overall, the strongest correlations for each QSP were observed in the age group 46–55. Here, especially for BDI-FS and SSS the symptom scores correlated strongly with the scores from the smiley-based scoring system. The QSP scores only correlated for MFIS-5 and IVIS in the age groups 18–25 and over 56 (Figure 4).

Heatmap correlation analysis for QSP in sub-group ‘age-groups’. Data was collected from all users who answered at least one questionnaire with its respective symptom and divided into subgroups according to age. *p ≤ .05, **p ≤ ..01, ***p ≤ .001, ****p ≤ .0001.
Heatmap correlation analysis for QSP MFIS-5 and IVIS across all sub-groups. Data was collected from all users who answered at least one questionnaire with its respective symptom from MFIS-5 and IVIS and divided into subgroups. *p ≤ .05, **p ≤ ..01, ***p ≤ .001, ****p ≤ .0001.
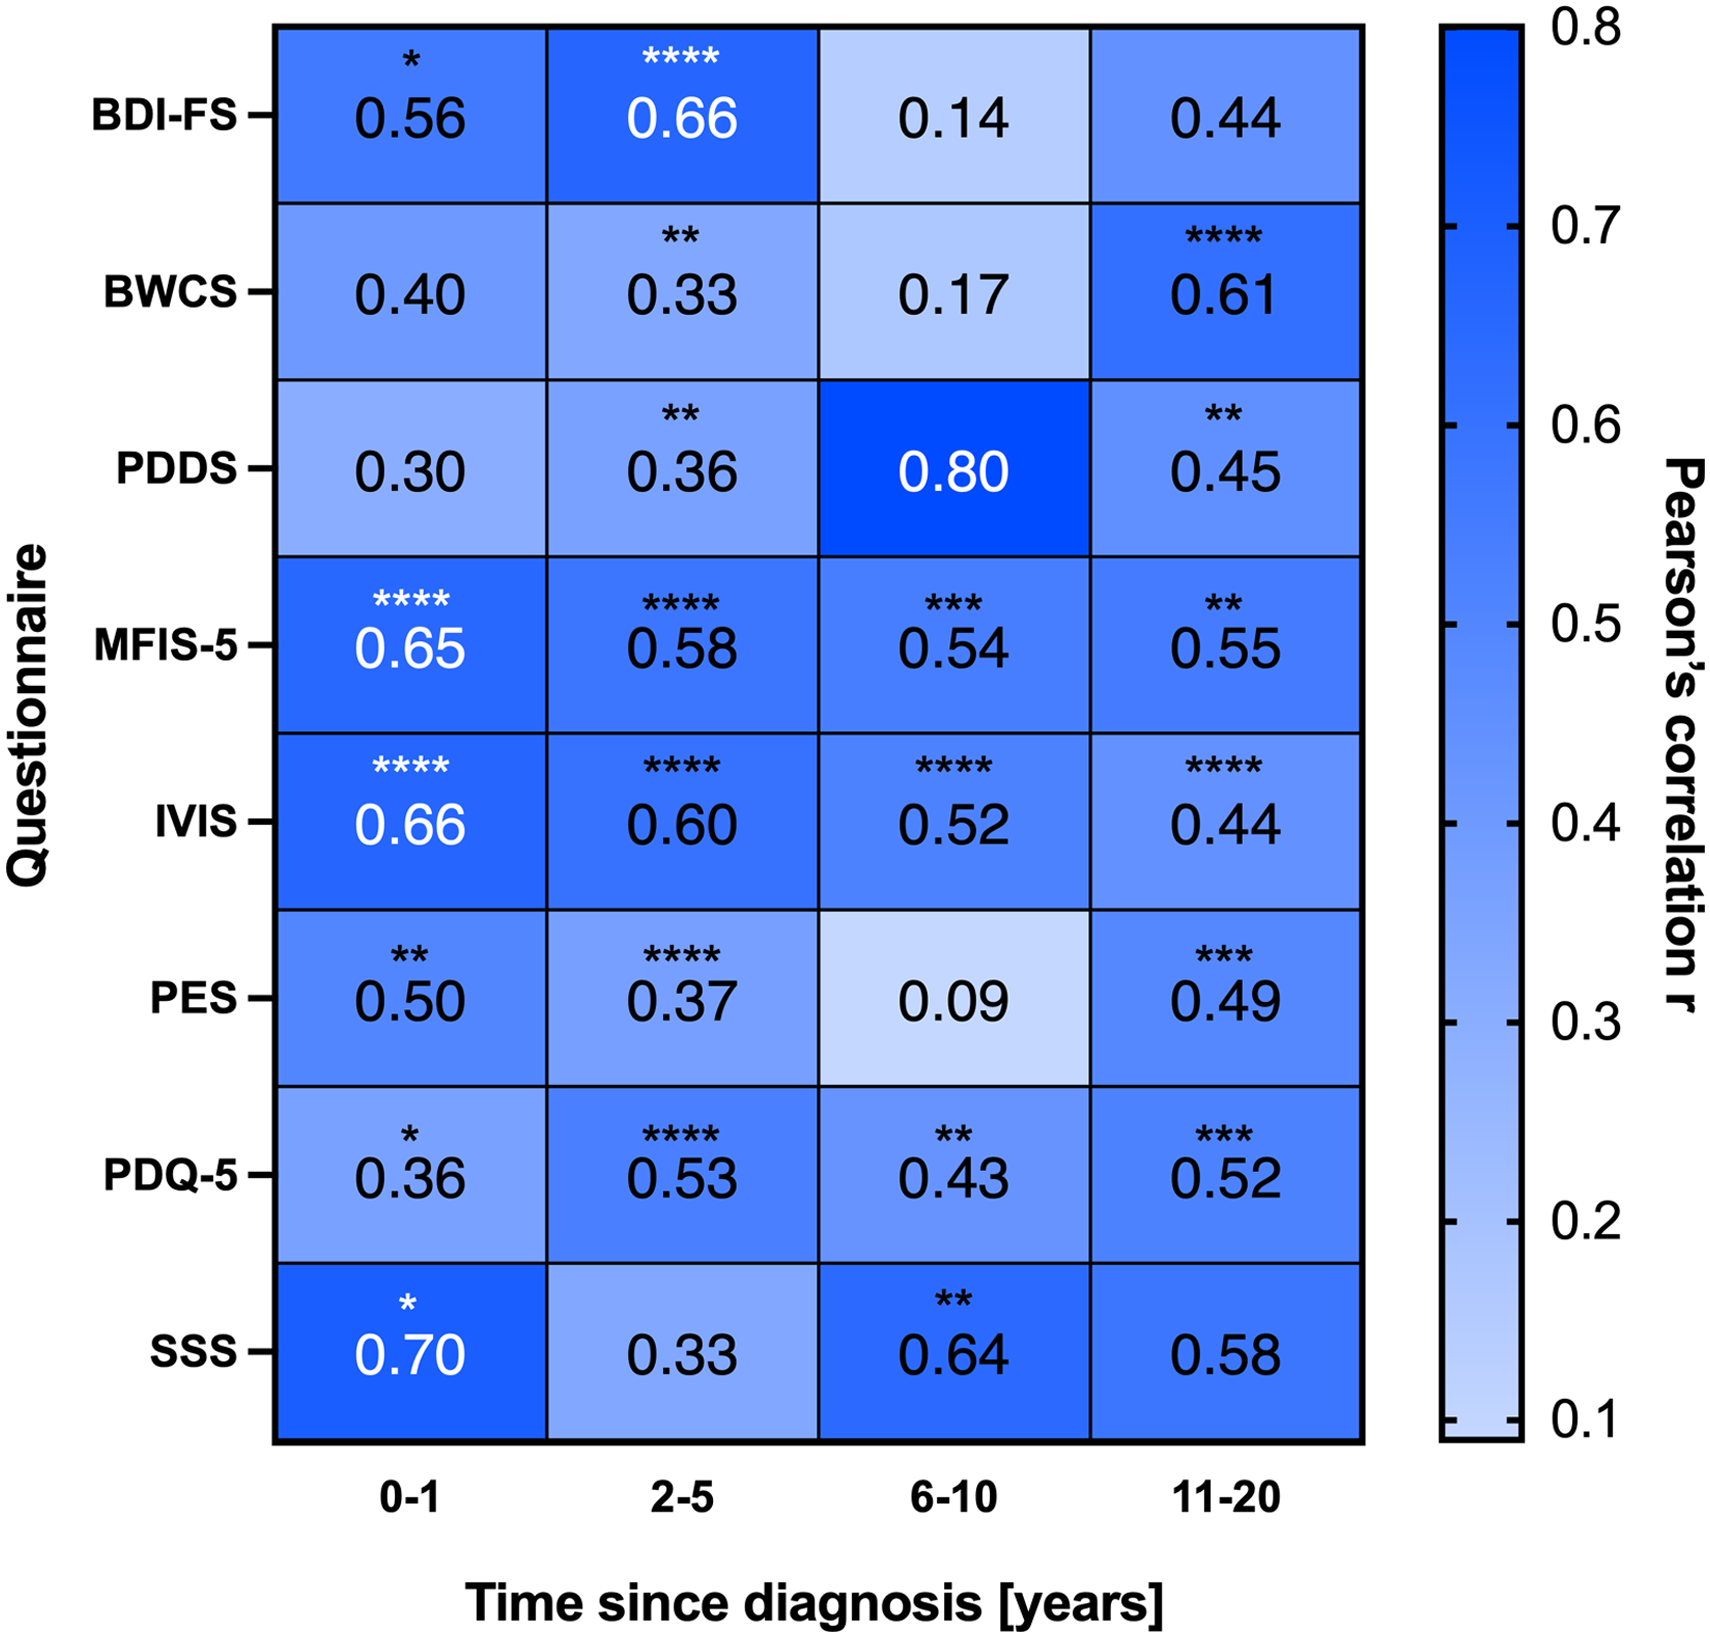
Next, we calculated the correlation of the scores given in the QSP based on the subcategory time since diagnosis (Figure 5). For recently diagnosed users the QSP PDQ-5 showed a moderate correlation, whereas BDI-FS, MFIS-5, IVIS, PES, and SSS showed a strong correlation. The most robust correlation for the QSP was observed in the group of users diagnosed 2–5 years ago. Here, all QSP showed a moderate (BWCS, PDDS, PES,) to high (BDI-FS, MFIS-5, IVIS, PDQ-5) correlation value. The groups of users diagnosed 6–10 years ago had a moderate correlation for PDQ-5 and strong correlation for the QSP MFIS-5, IVIS, and SSS. In the group diagnosed longest with MS PDDS, IVIS, and PES resulted in moderate correlation and BWCS, MFIS-5, and PDQ-5 in strong correlation values.

Heatmap correlation analysis for QSP in sub-group ‘time since diagnosis’. Data was collected from all users who answered at least one questionnaire with its respective symptom and divided into subgroups according to time since diagnosis. *p ≤ .05, **p ≤ ..01, ***p ≤ .001, ****p ≤ .0001.
As seen in Figure 4 and Supplemental Figure 1, users diagnosed with PPMS had a moderate correlation of QSP scores in MFIS-5, and strong correlation scores in IVIS and PDQ-5. Users diagnosed with RRMS had moderate correlation of scores in the QPS BDI-FS, BWCS, PDDS, PES, and SSS. In the QSP MFIS-5 and IVIS, the correlation was strong. No correlation could be observed in the group of users diagnosed with SPMS.
When analysing the correlation values across all subcategories, it becomes apparent that the QSP MFIS-5 and IVIS show strong correlation values. Specifically, both QSP have high correlation values in both male and female users, as well as all age groups and time since diagnosis categories (Figure 4).
Discussion
In our previous study, 18 we reported the heterogeneity of demographic and health-related characteristics of MS patients using the BRISA app in Germany. Due to the vast spectrum of disease symptoms, the generation of real-world data is essential for understanding the pathogenesis of the disease and its impact on the patients’ daily life. Patients are often required to complete multiple well-established, but lengthy questionnaires to assess their disease status and to regularly track their progress, which is time consuming and requires a good understanding of the German language. Although patient-reported questionnaires are a proven method of collecting symptom and disease progression data for a particular indication, this process can be tedious. These points raise the question whether the established method of analysing a patients’ condition is practical for daily use, or whether the patients could benefit from a simplified questionnaire version based on smiley scores.
The aim of this analysis was to investigate the correlation between the results of traditional and established patient questionnaires and the symptom rating using smileys within the BRISA app, a digital health companion for patients diagnosed with MS.
To study the correlation in subgroups according to gender, age groups, MS-type, and time since diagnosis of disease, we first had to evaluate the demographic data and the response rates of the BRISA users. Our cohort was comparable to the user characteristics we previously reported in ‘Demographic patterns of MS patients using BRISA – an MS specific app in Germany’. 18
According to the MS registry Germany, the average age at diagnosis in an MS treatment centre is 35.8 years, but 16.9% report that their disease began at the age of 20–24, 18.4% at the age of 25−29, and 16.3% at the age of 30−34. 26 The discrepancy between reported age at disease onset and actual diagnosis could, therefore, also influence the number of users in the fringe groups (18−25 and >55). Since it can be assumed that there is also a certain period of time from first diagnosis to using a digital health companion, it is plausible that the group of 18–25-year-olds represents a lower proportion of our cohort. In addition, studies on the dependence on mobile technology show that especially younger, rather than older users have a significantly higher affinity. 27 This could further explain the low rate of >55-year-old users in the cohort. Since the German MS registry reports 71.0% female and 29.0% male MS patients, 26 our study cohort is largely representative of the MS population in Germany.
When evaluating the overall response rates to questionnaire and symptoms the distribution within the subgroups regarding gender, age distribution, MS-type, and time since diagnosis is comparable with the distribution of user's demographics. Interestingly, across all subgroups, topics like BDI-FS and SSS seem to be the least answered questionnaire and symptom pairs. This could be due to the fact that topics regarding depression could be considered sensitive topics, as are questions about sexual satisfaction. Furthermore, symptoms like vision impairment and fatigue are among the most common symptoms in MS patients,28–30 leading to high number in response rates.
After analysing the demographic data and the response rates in our study cohort, we can clearly observe that patients of different age groups and with different lengths of illness use the app to track their symptoms and get help and guidance for their daily activities.
One key feature of the BRISA app is that users have the opportunity to track their typical MS related symptoms31–36 in the symptom diary with a click of a button, thereby allowing users to quickly and easily evaluate the severity of a symptom by means of smileys. To date, it is unclear to what extent the evaluation by smileys correlates with the classic questionnaire scores, whether a smiley scoring system can reliably reflect the course of the disease. To address this question, we analysed the correlation of smiley scores and questionnaire scores across a set of standardized questionnaires.
Our study demonstrates that there is a positive correlation for all questionnaire and symptom pairs. The results show that it is possible to reproduce a symptom trend by means of an easily understandable representation (e.g., smileys), even if the questionnaire-symptom pairs do not correlate fully with each other. This might be due to the way the questionnaire is asked. In the surveys used, the users are asked about their average condition in relation to the last 2 weeks before the questionnaire, but within the symptom diary a daily query is made. By asking the user to the assess their condition as an average of 14 days may not fully accurately represent how the user feels on the day the symptom form is completed. In addition, an assessment based on facial expressions (happy face to sad face) is more subjective in nature than a direct questioning on e.g., clearly defined walking distances, which could explain a discrepancy regarding the more clearly formulated questionnaires.
In more detail, the age group 46−55 reported the scores with the highest consistency between the traditional scoring systems and the smiley-based scoring system. Interestingly, Weis et al. reported that the rating of emoji seems to be dependent on age, which could also contribute to the different correlation values in the different age groups. 37 It is also plausible that older patients have lived with the disease longer. Patients in the age group of 46 to 55 years have therefore perhaps been confronted with the disease long enough to be able to assess and evaluate their symptoms but have also not suffered so long that they have become too accustomed to them.
To gain a better understanding of how the duration of the disease influences the correlation between the QSP in our study, we divided the users into groups based on their time since diagnosis. Our analysis showed that the users of the app were evenly distributed across all groups of time since diagnosis, except the users who were diagnosed 21–30 years ago, which represented the smallest group with 7.9% of all users. This may be because patients suffering from a chronic disease over long periods of time might be reluctant to tracking the symptoms daily and have already been managing their disease in an alternative way.
Specifically, the users diagnosed 2–5 years ago proved to have the most robust correlation. Especially patients diagnosed with MS less than a year ago may find it difficult to correctly assess their symptoms, while those who have been dealing with the disease for longer may have become so accustomed to the limitations associated with it that they no longer notice potential changes in symptoms. Users diagnosed 2–5 years ago might already have sufficient experience and knowledge about their condition to better evaluate their symptoms but are also motivated to actively track and improve their condition. This is also represented in the amount of users that registered for the app, where 41.0% of all users were diagnosed 2–5 years ago.
However, one must keep in mind that in MS it often takes years between the onset of the first symptoms and the actual diagnosis, 38 so that the time since diagnosis does not always refer to the actual onset of the disease.
When looking at the distribution of BRISA users regarding MS-type, only 8.8% and 4.6% reported being diagnosed with PPMS and SPMS, respectively. Additionally, patients suffering from SPMS or PPMS may be impacted more severely by the disease and therefore might be less inclined to use an application for symptom tracking. This low number of users in these subcategories could contribute to the fact that we don’t observe any correlation and poses a weakness of the study. These distributions largely correspond to the trend reported in current literature, where according to the German MS registry in 2021, 74.6% patients are diagnosed with RRMS, 15.5% with SPMS and 6.8% with PPMS. 13 However, the missing or lower correlation in the PPMS and SPMS subgroups could also be due to the different disease histories compared to RRMS. While the symptoms of RRMS usually go into remission, the symptoms of PPMS and SPMS are progressive. This could mean that the state of health can be depicted more clearly through the exact wording of the questionnaires, but this may not be adequately depicted when using smileys for assessment. Specifically, the user could objectively show reduced mobility, but since he is already accustomed to his condition his subjective evaluation might seem less negative, thereby differing from the result of the questionnaire. To address this question further studies with greater sample sizes are needed.
Noticeably, the QSP MFIS-5 and IVIS showed the most robust correlation across the subcategories. As mentioned previously fatigue and vision impairment are one of the most common symptoms MS patients suffer from. The strong correlation could on the one hand be due to high number of response rates, on the other hand vision impairment is a symptom that can very clearly and abstractly be categorized, whereas symptoms regarding emotional state or cognitive disorders may be more subjective. As fatigue is one of the most common symptoms suffered by MS patients, 39 the robust correlation of the MFIS-5 QSP could be due to the fact that patients are highly aware of fatigue as a symptom and become accustomed to reporting and rating its severity.
The mobile and health digital market has expanded rapidly over the last years. 40 Countless mobile medical apps have emerged aiming to help patients with chronic diseases manage their condition with functions like tracking symptoms, logging medications including their adverse effects or consultation and information acquisition functions. These apps have the potential to provide low-cost, around-the-clock access to high-quality, evidence-based health information to end users on a global scale. 41
Also, our results show that real-world data collection offers many advantages. The simple and time saving symptom assessment in the BRISA app allows patients to track their symptoms daily, providing a clearer picture of symptom progression and insights into any dependencies on environmental and behavioural factors. Another advantage could be the simplicity of the concept. Not only does the reduced time factor simplify the user experience and potentially increase compliance, but the universal comprehensibility of smileys reduces possible language and cognitive barriers. One must take into consideration that the interpretation of smileys is very subjective and can vary depending on personality, age or gender. As mentioned previously, MS patients in Germany on average only visit their physician two to three times a year. 13 Tracking symptoms and medication usage in an application therefore also poses an opportunity to document disease management during the periods between physician visits and additionally allows patients to share their disease journey with their treating physician in a more structured and documented way. Although the simplified scoring system can never replace the experience and knowledge of a specialist, it can support the patients themselves to gain a better understanding of the disease, but also provides the treating physician with more detailed and valuable information, thus supporting the assessment of the right treatment for his patient. For mobile health apps to fully contribute value to the health care delivery and disease management, all parties involved in the patients’ journey must collaborate.
Limitations
Our study did have some limitations. Firstly, the distribution between men and women was very different, which is why it is more difficult to assess the stability of the results, especially for men. For some categories i.e., MS subtypes, the response rate was relatively low therefore making a comparison between the disease types difficult. Since the recording period for the questionnaire (the last 2 weeks) and the symptom (current day) was different, the significance of the correlation is limited. Although we tested our datasets for internal consistency, as in all studies involving patient-reported data, the probability of a small percentage of false data inputs cannot be excluded.
Conclusion and outlook
We investigated the correlation between the outcome of established PROs of users with MS and the outcome of the symptom diary in BRISA, a digital health companion for users with MS. Our results showed that on average there is a positive correlation between the respective outcomes and that the assessment of symptoms using smileys can reproduce a trend. In conclusion we believe that tracking the symptoms on a daily basis with a health care app can hugely benefit the user in tracking their disease progression and supporting the disease management. However, detailed questionnaires are still required to assess the patients’ condition in a more objective and standardized way. In addition, further research is needed to validate our results for different subgroups, i.e., different MS phenotypes.
Supplemental Material
sj-docx-1-dhj-10.1177_20552076231173520 - Supplemental material for Correlation and differences of patient-reported outcomes vs. Likert-Rating of MS symptoms in a real-world cohort using a digital patient app
Supplemental material, sj-docx-1-dhj-10.1177_20552076231173520 for Correlation and differences of patient-reported outcomes vs. Likert-Rating of MS symptoms in a real-world cohort using a digital patient app by Steffeni Mountford, Maria Kahn, Preetha Balakrishnan, Elizabeth Jacyshyn-Owen, Markus Eberl, Benjamin Friedrich, Natalie Joschko and Tjalf Ziemssen in DIGITAL HEALTH
Footnotes
Acknowledgement
We would like to thank all BRISA users who gave consent to analyzing their data, thereby allowing us to gain valuable insights and contribute to the improvement of patient care.
Conflicting interests
SM, MK, PB, EJO, ME and BF are employees of Temedica GmbH. NJ is an employee of Roche Pharma AG, Grenzach-Wyhlen.TZ reports grants and personal fees from Biogen, Roche, Merck, TEVA, and Almirall; grants, personal fees and non-financial support from Genzyme and Novartis; and personal fees from Bayer, BAT, Celgene and Gilead.
Guarantor
BF
Contributorship
SM, MK and PB conducted data analysis, literature research and manuscript preparation. EOJ researched literature and prepared manuscript. BF, NJ, ME and TZ discussed to findings and shaped the manuscript. All authors reviewed and edited the manuscript and approved the final version of the manuscript.
Ethical approval
Not applicable
Funding
The author(s) received no financial support for the research, authorship, and/or publication of this article
Supplemental material
Supplemental material for this article is available online.
References
Supplementary Material
Please find the following supplemental material available below.
For Open Access articles published under a Creative Commons License, all supplemental material carries the same license as the article it is associated with.
For non-Open Access articles published, all supplemental material carries a non-exclusive license, and permission requests for re-use of supplemental material or any part of supplemental material shall be sent directly to the copyright owner as specified in the copyright notice associated with the article.