
Abstract
Multiple waves of COVID-19 have significantly impacted the emotional well-being of all, but many were subject to additional risks associated with forced regulations. The objective of this research was to assess the immediate emotional impact, expressed by Canadian Twitter users, and to estimate the linear relationship, with the vicissitudes of COVID caseloads, using ARIMA time-series regression. We developed two Artificial Intelligence-based algorithms to extract tweets using 18 semantic terms related to social confinement and locked down and then geocoded them to tag Canadian provinces. Tweets (n = 64,732) were classified as positive, negative, and neutral sentiments using a word-based Emotion Lexicon. Our results indicated: that Tweeters were expressing a higher daily percentage of negative sentiments representing, negative anticipation (30.1%), fear (28.1%), and anger (25.3%), than positive sentiments comprising positive anticipation (43.7%), trust (41.4%), and joy (14.9%), and neutral sentiments with mostly no emotions, when hash-tagged social confinement and locked down. In most provinces, negative sentiments took on average two to three days after caseloads increase to emerge, whereas positive sentiments took a slightly longer period of six to seven days to submerge. As daily caseloads increase, negative sentiment percentage increases in Manitoba (by 68% for 100 caseloads increase) and Atlantic Canada (by 89% with 100 caseloads increase) in wave 1(with 30% variations explained), while other provinces showed resilience. The opposite was noted in the positive sentiments. The daily percentage of emotional expression variations explained by daily caseloads in wave one were 30% for negative, 42% for neutral, and 2.1% for positive indicating that the emotional impact is multifactorial. These provincial-level impact differences with varying latency periods should be considered when planning geographically targeted, time-sensitive, confinement-related psychological health promotion efforts. Artificial Intelligence-based Geo-coded sentiment analysis of Twitter data opens possibilities for targeted rapid emotion sentiment detection opportunities.
Keywords
Introduction
Undoubtedly the COVID-19 pandemic has impacted the emotional well-being of all, despite their at-risk status for infectivity. Some had to struggle to adapt to social-environmental changes, to the so-called “new norm” and many were subject to forced solitary confinement. These social and physical confinements not only threatened physical health-related activities but encompassed emotional downturns for all. Mandatory public health guidelines-imposed restrictions, such as social isolation and business and entertainment closures further altered peoples’ lifestyles. These compounded factors stemming from social/physical confinement took a toll on everyone's emotional health.1,2 Yet there is limited research-based evidence stemming from social /physical confinement-related emotional health dynamics that illustrate latency/resumption and strength of the relational effect of caseloads dynamics. The adverse psychosocial impact of COVID-19 lockdowns is clearly noted in the literature including fear, anxiety, obsessive behavior, increased substance dependence, and depression. 3 There is an abundance of research-based evidence on the psychological impact on frontline healthcare workers and some other selected community groups, but little attention has been paid to uncovering general population-level emotional sentiments resulting from COVID-19-related lockdown and confinement. This is partly due to the inability to conduct population-based research data collection in a timely manner during a pandemic. Social media expressions provide a unique opportunity to uncover subpopulation-level emotional rapid assessment and to examine immediate emotional responses to feelings of isolation during the confinement period.
The aim of this article is to apply a machine learning (ML) approach to assess the dynamics (changes across time and geography) of emotional impact expressed in Canadian Twitter data, at the geography level, concentrating on a provincial-level analysis. Social media has been recognized as a viable platform for getting to know people's instant reactions during the COVID-19 outbreak. 4 Global literature supports the feasibility of social media data use, for subpopulation-level emotional response detection. Social media users represent a subset of the general population. A study conducted in Spain using opinions gathered from several social media platforms, including Twitter, provided initial evidence of the capability of capturing emotional sentiments expressed in social media during the pandemic period. 4 Even further, the global social media, Twitter/Weibo data analysis that retained quarantine and locked down hashtags, uncovered emotional dynamics change in relation to economic upturns and downturns. 5 Several other studies that have used Twitter data provided promising results in emotional sentiment detection related to the COVID pandemic. 6 Furthering this knowledge, global Twitter data sentiment classification daily percentages, distributed over three consecutive time intervals, have shown to be related to mortality time series data depicting higher positive emotion rates with low mortality, and surprisingly noted higher sadness daily Tweets when there was a drastic decrease in COVID deaths. 7 Authors recommended comprehensive research to find reasoning to explain those emotional dynamics. There are no studies that explored the long-term temporal association between confinement-related sentiment classification and COVID-19 morbidity data, and we argue morbidity dynamics may be more sensitive than mortality to further explain emotional dynamics. To further understand the confinement-related dynamics of emotional sentiment trends expressed in Twitter data, our study employed a 395-day long time series modeling approach to uncover the relationship between time-varying COVID caseload change on daily emotional sentiment fluctuations. The findings will provide directions for the prevention of government-regulated confinement-related negative emotions before reaching the mortality state.
Sentiment analysis has been recognized as a reliable method to track emotional reactions embedded in social media posts.6,8 Emotion sentiment detection using Twitter data involves the extraction and classification of emotions expressed in the text data. This type of analysis provides a unique opportunity for rapid emotional burst detection during times of unanticipated, unprecedented events occurrences such as pandemics and natural disasters, especially when traditional data collection takes a lengthy period and greater effort. Specifically, the spatial–temporal emotional sentiment analysis provides population-level emotional outcome data to inform public health officials to take necessary geographically targeted precautionary measures, and to act in a timely manner. Besides, Twitter data capture free-flowing natural expressions and minimize research bias in emotion expression detection from traditional survey data. A study in Southern Italy used 19 oncology professionals’ WhatsApp conversations, during a four-week period of pandemic spread and detected both positive and negative emotional sentiment variations over time in relation to the time-varying volume of COVID-related activities. 9 Though it is encouraging that they detected positive and negative time trends, albeit the period of weekly responses was short, there were no correlations established. Another emotion sentiment research investigation on US healthcare professionals used 53,063 Twitter expressions, over a pre-and post-pandemic two-year period, and noted the post-pandemic increase in sadness, decrease in joy, and noted fear as preceding the waves of the pandemic, which is considered as an anticipated negative outcome in our analysis. 10 We emphasize the importance of uncovering the emotional dynamics of the general population in relation to caseload dynamics across time and geography. These previous studies have demonstrated the capacity of sentiment analysis in detecting dynamics of emotional expression using social media data, during the pandemic among subgroups of healthcare professionals. Nevertheless, no study has captured the spatial–temporal variations in the association between confinement-related dynamics of negative and positive emotional sentiments in relation to dynamics of daily COVID caseloads in Canada.
Canada is one of the countries, where strict lockdown measures, such as social confinement and mandatory isolation regulations were imposed and enforced. Nevertheless, to date, there were no time series studies that examined the ecological level impact of public health measures on population-level emotional sentiment dynamics in this country. A study that covered 17 European and North American countries used a containment index that covered eight policies and strictness levels, namely, closing schools, closing workplaces, cancellation of public events, restrictions on gatherings, cancellation of public transportation, stay-at-home requirements, internal movement restrictions, and international travel restrictions.11,12 These measures were the same as the ones imposed by the Public Health Agency of Canada that we have captured using hashtags. 13 Based on these measures of COVID-19 government responses, a stringency index was developed, by these researchers, for regions of the world and Canada falls into the second highest in their ranking of the 0-100 scale, falling within the range of 60−80. 12 Researchers showed that there is a linearly increasing relationship between caseloads and stringency index, across different countries, wherein measures were stricken based on caseloads increase. 12 In Canada, strict public health measures were imposed and released at different time points by different provincial jurisdictions depending on the surge and recede of provincial-level caseloads, thus making the case for provincial-level analysis. According to media reports, the outburst of reactions to those restrictions was more prominent in some Canadian geographies than the others, when the social confinement was tightened after every caseload surge was noted, known as waves. The outburst of negative emotional reactions is a result of perceived risk. To our limited knowledge, there are no other studies that investigated the association between emotional sentiment dynamics and caseloads variation over time, neither effect sizes, nor latency of impact onset was available, within the context of stringency such as social/physical confinement and locked down, that varied by geography. By extracting Canadian Twitter data using confinement-related hashtags, our findings will help to contextualize the emotional sentimental dynamics impact of these stringency measures. The findings from Canada will uncover the emotional sentiments dynamics within the context of strict public health measures and facilitate timing and the extent of necessary countermeasures to be taken, to control subsequent negative emotional impacts and to promote timely positive impacts at the population level. While public health measures were essential tools to control the impact of the pandemic, very little is known about the prognostication, magnitude, direction, and latency of emotional impact on COVID caseload increase to those control measures.
The practical basis of this study stemmed from multiple research-based evidence sources. Twitter is known as a social media platform for freely communicating with strangers, and sharing emotional feelings, during the time of restricted social interactions, thus confirming the data quality used for this study. 14 Even further, when the Twitter community is observed over a lengthy period of time their emotional responses become stable and the dynamics of changes to events can be captured effectively by using a lengthy period of observations. 15 The theoretical basis for this study is situated within the phenomenon of social amplification of risk framework, wherein the information sharing in social media in response, to a perceived risk of an event, has further been related to the attenuation of the risk associated with public events. 16 Therein the framework provides how the risk events such as the pandemic interact with the communication process of psychological feelings exchange through news media and social networks.17,18 The expression of psychological feelings depicts inherent emotions, as Ekman argues, and he classifies them into six basic emotions. 19 In the present study, Lexicon-based sentiment analysis is used to study the dynamics of Tweeters’ emotional expressions related to confinement. In this process, natural flows of expressions, related to confinement, are captured and classified into emotional sentiments using well-recognized emotional Lexicons. It was shown that the words used to indirectly represent COVID-19-related emotional sentiments are captured by Lexicons fairly well and reached greater accuracy of 81% than those with direct representations. 20 The Bidirectional Encoder Representations from Transformers (BERT) model for sentiment classification uses a similar segment classification 21 that results in multiple emotions in the same expression, and we used BERT in conjunction with the emotional dominance theory to uncover the dominant sentiment. 22 The BERT Natural Language Processing model classification of COVID vaccine-related Tweets has received a maximum precision score. 21
Our study is unique in several aspects and contributes to advancing geographically targeted ML-based sentiment analysis to uncover emotional dynamics over time and provides statistical learning tools to examine the association with the temporality of risk event changes. In essence, this study presents an ML-based methodological framework that includes two Python-based algorithms for daily Twitter data extraction using 16 different, COVID-19 confinement-related semantics, geocoding, and emotional sentiment polarization using Natural Language Processing. It uses a large volume of daily Canadian Twitter expression count data (n = 64,372) in English and French, collected over a lengthy period of 396 days, covering the first three waves of the pandemic. Even further, extracting all Twitter geo locations covering an entire country, facilitated provincial-level analysis. Finally, we present statistical learning methods to examine temporal dynamics detection of sentiments in relation to COVID caseload variations. By considering the worldwide evidence of possibilities of linking Tweet-based emotion detection to COVID pandemic-related opinion mining, we expand the existing knowledge base specific to the stringent measure of confinement and fill the gaps in knowledge on exploring emotional sentiment time trends, resulting from COVID caseloads dynamics. Our study expands existing knowledge into AI-based emotion detection algorithms development, the latency of emotional reaction identification, and linear prognostic model-based estimation of the emotional sentiment variation effect in relation to COVID caseloads dynamics.
The main contribution of our work is listed below:
Mapping polarity, negative or positive, and neutral emotion topics using data extracted from daily tweets during the three waves of the pandemic, reflecting multiple terms of public health-imposed confinement and locked down related hashtags. Development of Artificial Intelligence (AI)-based algorithms to geocode tweets to tag Canadian provinces and to extract sentiments using the National Research Council of Canada (NRC) word-based Emotion Lexicon (NRCCEL).2,23 Illustrate the patterns of latency effect of emotional sentiments in relation to COVID case dynamics, within the context of quarantine and locked down and finally, Carry out emotion prognostication using time series modeling, uncovering the dynamic linear relationship between COVID caseloads dynamics, and resulting fluctuations in emotional moods as reflected in the Tweets hash-tagged to quarantine and locked down.
The findings of this study will help future geographically targeted, area-based public policy decision-making, and related emotional well-being measures enactment through an understanding of geo-temporal dynamics of emotional variations in relation to the vicissitudes of the pandemic caseloads.
Related work
Emotion detection from large textual corpora using AI approaches has been applied to online communication data analysis to tackle diverse health issues including fitness, cancer, diabetes, and mental health. Recently, much attention has been paid to COVID-related emotional sentiment classification using social media expressions. Short-term sentiment analysis of lockdown-related Twitter data had shown positive tweets outnumbering negative tweets. 24 Detecting sentiment dynamics in Tweets during COVID has received ML researchers’ attention in the past and the patterns exhibited were different. A study that scrutinized Tweeters’ sentiment dynamics in seven consecutive pandemic time intervals, found sentiment clusters of topics exhibiting variations of occurrence over time, and the lockdown was one prominent topic shown in the first interval, and no details of time-varying polarized sentiments were examined. 6 Another study on the prominent topics and related sentiment variations found the spread and growth of COVID cases as the second prominent topic (15.5% tweets) and the average sentiment score for this topic was negative and then switched to positive when prevention, treatment, and recovery were discussed. 25 A time series tweet data analyses study, similar to ours, was conducted in Ontario, Canada using a short record of daily tweets from March to October 2020. Using a daily positive-to-negative sentiment ratio as the outcome measure, they were unable to find a significant association with COVID case counts. 26 They used the Valence Aware Dictionary for Sentiment Reasoning (VADER) sentiment classifier for daily polarized sentiment calculation. Our study was motivated by their funding but expanded on using a longer record of Twitter data, confined to lockdown and emotional sentiment classification using NRCCEL which uses a large volume of English words, to classify each type of PLUTCHIK emotion.
Our study used two of the most popular emotional classification Lexicons in tandem, NRCCEL, 23 and VADER. 27 There is evidence coming, since the early twenties, on the development and application of emotional classifiers. Taking the advantage of Natural Language Processing, a large volume of social media opinions is mined to uncover people's emotions. A system that was developed to extract and analyze emoticons, from pictorial presentations of Chinese text related to health and fitness, classified emotions into seven pre-identified categories: happiness, sadness, fear, anger, disgust, surprise, and love. 28 Their system is based on a kinesics model, which divides emoticons into semantic areas and differs from the lexicon-based system that we propose. Lexicon-based graph models have been developed to extract sentiments from the most important words in a co-occurrence graph model (pictorial presentation) of the sentences extracted from the text. 29 The model was later expanded to use a support vector machine classifier to determine sentiment polarization for a given text corpus. Sentiment analysis moves beyond emotion detection in text corpora and includes polarization of extracted emotions into positive, negative, and neutral sentiments.
The most popular and validated lexicon used for COVID-related sentiment analysis is the NRCCEL, which we propose to leverage. 30 This lexicon was selected due to the reasons of giving scores to a broader scheme of eight different emotions joy, sadness, anger, fear, disgust, surprise, trust, and anticipation, depicted in the text corpora and most importantly fits into our aim of uncovering dynamics of variation of emotions. The NRCCEL Lexicon consists of 14,182 English words, the largest text corpora, and their association score of 0 or 1 indicates whether a word is associated with a specific emotion. The NRCCEL has been validated using manual coding and has shown to have 90% accuracy. 28 This approach is based on the components of two well-established and widely used theoretical frameworks: Ekman's theory of basic emotions 19 and Plutchik's emotion theory. 31 This Lexicon was chosen to categorize Twitter statements that do not explicitly express emotions and they are built into dictionaries to carry out ML-based sentiment analysis. Ekman, a 19th-century psychologist, pioneered the basic emotion theory and characterized human emotions into six families, and within each family, there are commonly shared characteristics. The Ekman framework comprises six basic emotions—joy, sadness, anger, fear, disgust, and surprise—while Plutchik emotion theory extends to include—trust and anticipation. Both frameworks have been applied extensively over the years in many health research domains—including a mental illness group, 32 an Australian COVID social media group, 33 Twitter expression classifications around the world, 34 and COVID-related vaccination topic modeling. 35 VADER is another widely used but simple rule-based model for sentiment classification and has been validated again in most of the other sentiment analysis models for social media text analysis but NRCCEL was not one of them. 27 VADER has the advantage of scoring each segment of the expression, as negative, positive, and zero (for neutral) to obtain a cumulative score to assign polarity as negative, positive, or neutral for the entire expression. Our approach to using NRCCEL linguistic valence classification is different in that each Twitter expression is assigned to one of the eight emotions of PLUTCHIK classification prior to polarity classification. Afterward, emotions are classified into negative, positive, and neutral. Researchers used other recursive classification-based approaches for COVID-related sentiment Tweet data analysis to show a pattern of negative sentiments proceeding with positive sentiments. 36 We used a bidirectional encoder representation 21 that results in multiple emotions in the same expression and then in conjunction with the emotional dominance theory 22 the prominent sentiment classification was assigned.
We propose an AI-based emotion detection approach. Recent studies have applied similar ML approaches such as Naïve based and logistic regression classifiers to process coronavirus-related Tweets like fear and other negative sentiments. 30 The results showed 91% classification accuracy for Naïve Bayes and 74% accuracy for Logistic regression. Both classification methods were shown to perform well for short-length Tweets but weaker performance for long Tweets used for COVID fear sentiment classifications. Nevertheless, their findings showed that public sentiments were more negative in areas with higher COVID-19 cases. 30 Our study of COVID confinement and locked down hash-tagged data comprised a mixture of short and long Tweets in lengths, thus requiring a better classification algorithm such as NRCCEL to be used. A research study that analyzed two Twitter data sets, one on worldwide data and the other India-specific, examined the impact of COVID on human life, during a short three-month period from 19 January to 12 April 2020. They used the mean of the polarity score from different Tweets as the daily measure to find the time trends. 37 Their sentiment classification based on ML and classification modeling using the BERT model was validated against the emotional classification in the GitHub repository and found to have 94% accuracy. 37 We propose to use the percentage of the polarity score for each of the negative, positive, and neutral types as the daily measure and to use extended versions of the BERT model.
For a country-wide emotional sentiment classification, using NRCCEL, Dubey (2020) analyzed Tweets from 12 different countries in April 2020: Australia, Belgium, China, France, Germany, India, Italy, Netherlands, Spain, Switzerland, the UK, and the USA. 38 Their analysis uncovered a worldwide trend of people expressing a mixture of sentiments, some showing hope and positivity about COVID-19 along with fear, sadness, and disgust. North American countries showed distrust and anger on a bigger scale. 38 The current research bare future promises. Indian researchers who identified moods expressed by the Indian nations, during the pandemic, used real-time Twitter posts. They further extended their findings by developing a web-based platform for viewing changes in emotional trends across India. Their system allows viewing of the moods of Indians on specific events happening in the country during COVID-19. 39 A study that examined cross-cultural polarity using sentiment analyses of COVID-19-related Tweets found differences in emotional reactions in neighboring countries, thus stressing the need to consider geo location in the sentiment analysis of social media text data. 40 A global Tweet study on the COVID lockdown that analyzed sentiments for a short duration of 23 days using VADER found a significant association between negative/positive Tweets and infections and deaths. 16 Another study explored COVID-19 lockdown and coping behavior using a mixed method, automated Lexicon-based and qualitative analysis, and found the majority were sharing positive opinions, some expressing negative sentiments, and others on the fence, changing their opinion based on the government decisions. 14 Both studies add credibility to Lexicon-based sentiment analysis of Tweets. Our study takes one step forward in temporal and spatial pattern recognition of dynamics of emotional sentiments in relation to COVID caseloads dynamics, in that we quantify the impact and estimate the latency.
Methods
To achieve the first two objectives (listed under contributions a and b) of the goal of empirically investigating provincial-level differences, we employed a hybrid approach consisting of an AI-based text mining of Twitter data depicted in Figure 1 and then a statistical learning method of ARIMA time series modeling approach to uncover patterns of temporal variations and associations with covid caseloads dynamics. The first phase involved collecting COVID confinement-related Tweets and associated metadata and then tagging the Tweets with geolocations. In the second phase, we preprocessed the geotagged Tweets using natural language processing (NLP) 41 techniques and then performed an analysis to identify different emotions expressed in the Tweets and then identified corresponding sentiment polarity. In the third phase, we calculated the daily percentage of counts of negative, positive, and neutral sentiments and carried out a time series analysis by province.

Methodological stages based on tweet text mining approaches.
Data collection
Permission was obtained from Twitter Inc. through their Academic Research Track to perform a full-archive Tweet search over a long period. Next, we developed a C# utility that mines historical tweets related to confinement caused by federal and provincial COVID-19 isolation public health policies from the Twitter database. We extracted tweets and associated metadata using the following confinement-related hashtags, keywords, and key phrases: #StayAtHome OR #quarantine OR #quarantined OR #lockdown OR #stayhome OR #quarantinelife OR #QuarantineAndChill OR #selfquarantine OR (((prolonged stay at home) OR isolation OR (locked in) OR (long stay) OR (social isolation) OR (prolonged stay) OR (social withdrawal) OR seclusion OR segregation OR (stuck inside) OR confinement) AND (coronavirus OR covid-19 OR covid19 OR SARS-CoV-2)). These comprehensive lists containing confinement-related semantics vocabulary terms were obtained using three dictionaries: Urban Dictionary, SNOMED-CT (Systematized Nomenclature of Medicine clinical terms), and Unified Medical Language System Mata thesaurus. 42 We collected a total of 8,832,129 tweets, covering 396 days, between 1 March 2020 and 31 March 2021. The metadata associated with the Tweets includes users/authors’ profile and places (such as cities and countries).
We obtained daily COVID-19 caseloads by province and territories from the Canadian COVID Data archive. 43 The two databases were merged using the date as the identifier to proceed with Time series modeling. R software was used for data management and time series ARIMA analysis.
Geo-Tagging of tweets
We developed a Collection of tweets Ʈ = {T1, T2,…,Tn} where 1 ≤ n ≤ 8,832,129. Each tweet Ti∈Ʈ is a tuple (I, F, Â, Ƿ), where I is the tweet's unique identifier, F is the full text of the tweet,  is the identifier of the tweet's author, and Ƿ is the identifier of the place where the tweet originates. A set of geo-places Ƥ = {P1, P2,…, Pm}. Each Pi∈Ƥ = (Ƿ, Ct, Co), where Ƿ is the place's unique identifier, Ct is the city, and Co is the country. A set of authors A = {A1, A2,…, Ak}. Each Ai∈A = (Â, L), where  is the author's unique identifier and L is a description of the author's location. A dictionary D = (C, V, R) containing Canadian cities (C) mapped to their provinces (V) and regions (R). We formulated the dictionary D using the geodata obtained from the Canadian government's open data portal.44,45

Tagging tweets with geo-location such as country, city, province, and region.
The algorithm first tags all tweets in T with the country using the
After executing the algorithm, 4,898,155 tweets were geo-tagged and distributed across 248 countries including Canada. There were 262,204 Canadian tweets, out of which 60,264 could not be mapped to any geolocation (i.e. city, province, or region) in Canada due to a combination of the following reasons: (i) location description provided by tweet authors contains incorrect or wrongly spelled city/province names, (ii) location description was not specified by authors, and (iii) tweets’ place of origin was not available. The algorithm is robust enough to detect abbreviated province names, having supplemented dictionary D with various abbreviations for Canadian provinces (such as “Alb,” “Alta,” and “AB” representing the Alberta province). Figure 3 shows the breakdown of Canadian tweets by province. The importance of ethical considerations related to geo-referenced tweets for mental health research have been emphasized by Fadda et al., 47 and we conducted detailed statistical analysis only on provinces with a large number of tweets and for that reason, all four Atlantic provinces were combined.
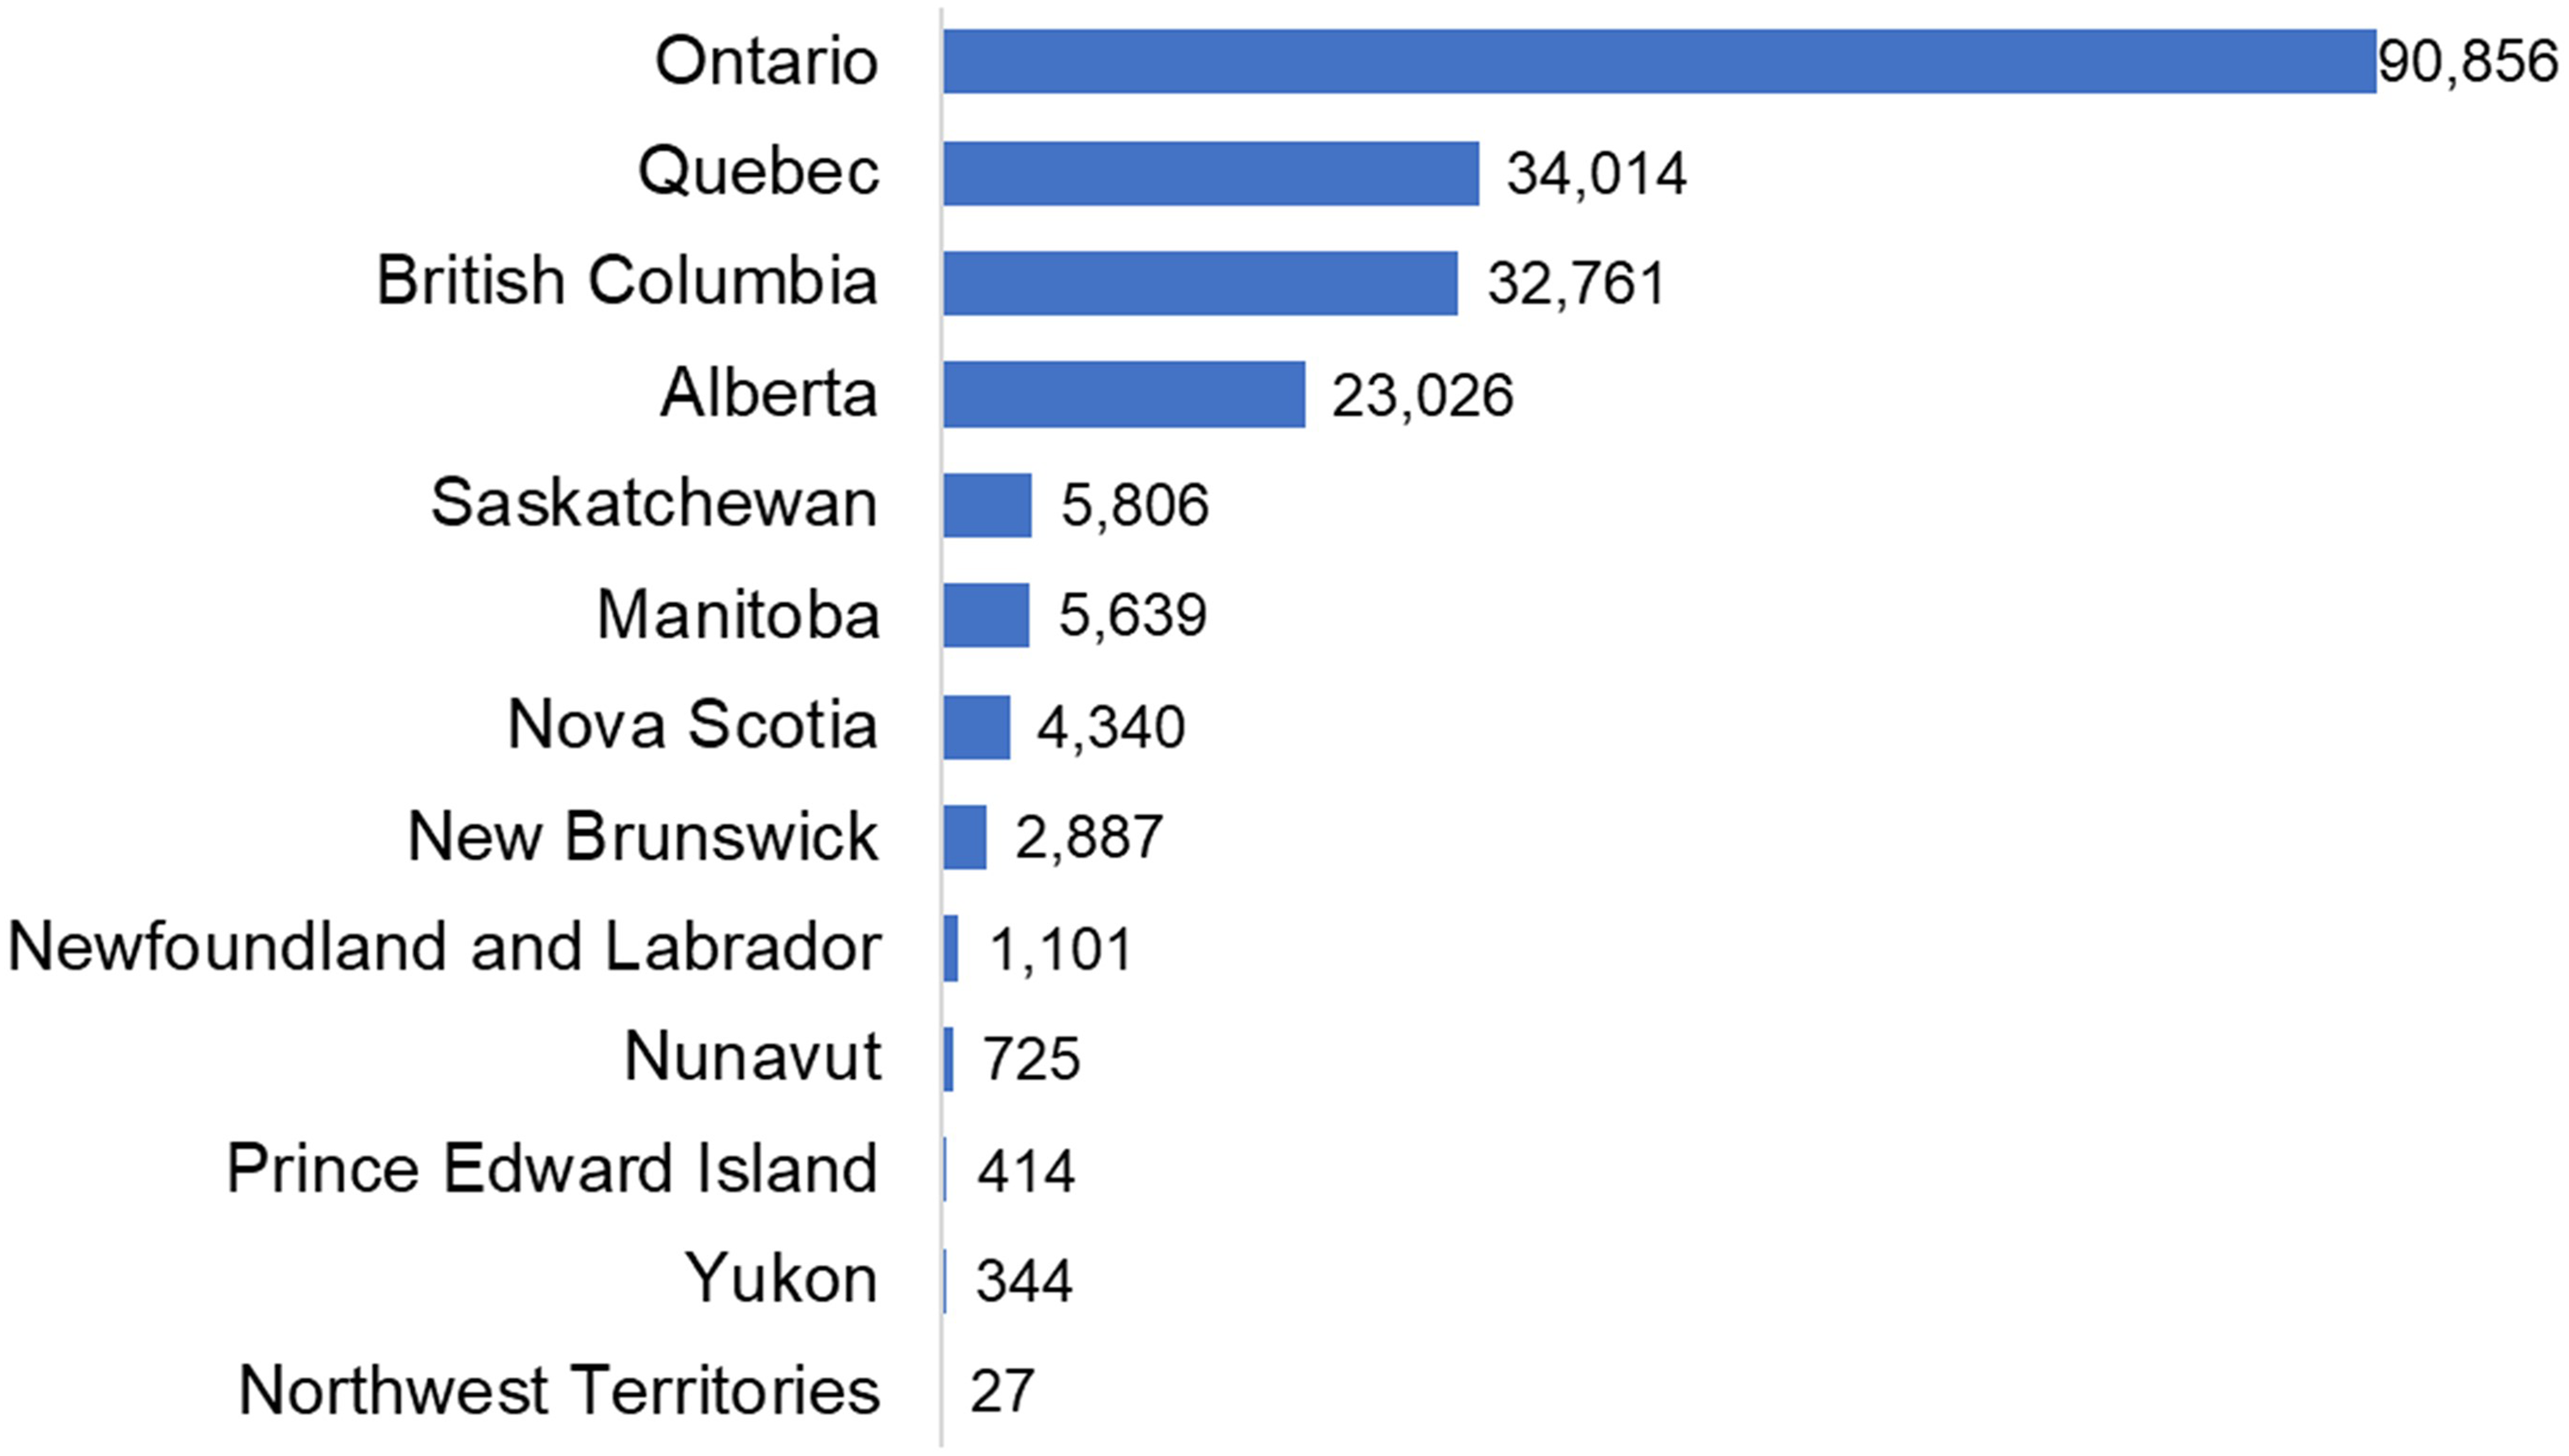
Distribution of Canadian tweets by province.
Next, we preprocessed the Canadian tweets (n = 201,940) by applying the following NLP techniques using Python and the Natural Language Toolkit (NLTK) library:
Removal of Tweets that are neither English nor French Removal of hashtags, mentions, and URLs Removal of punctuation and other special characters Removal of numbers Removal of stop words Stemming words to convert them to their root form Removal of duplicates
Afterward, we performed sentiment analysis on the remaining 64,372 Canadian tweets to detect dominant emotions and the corresponding sentiment polarity (positive, negative, or neutral). French tweets were translated, using Google translator, into English before processing.
Sentiment analysis
To classify the tweets into their respective dominant emotion (because multiple emotions were depicted in the same tweet) and to identify sentiment polarity, we developed a scoring algorithm named A set of Canadian tweets Lc = {T1, T2,…,Tn}, where 1 ≤ n ≤ 64,372. The NRC word-based emotion lexicon L = {Wi, W2,…, Wm}, where 1 ≤ m ≤ 14,182. Each Wi∈ L is a tuple (W, E, S), where W is the word, E is the emotion, and S is the associated score. A set of emotions ɛ = {E1, E2,…, Ek}, where 1 ≤ k ≤ 8. Each Ei∈ ɛ is a tuple (E, P, R), where E is the emotion, P is the corresponding sentiment polarity, and R is the rank (see Table 1).

Labeling each tweet with the dominant emotion and sentiment polarity.
Mapping of emotion to sentiment polarity and the overall rank of each emotion.

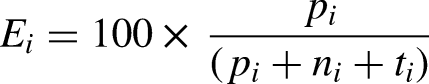
The algorithm (Figure 4) first tokenizes each tweet Ti into words using the WORD_TOKENIZE utility in NLTK, and then proceeds to check if a word Wi is associated with an emotion E in L. If a match is found, E is retrieved and the associated score S, as well as the polarity P, is mapped to E. In addition, S is incremented by 1 for E. The dominant emotion (i.e. the emotion with the highest score) is automatically assigned to each tweet Ti. However, if multiple emotions are dominant, the function
Thus, for text responses with multiple emotions, we created the algorithm to rank anger and fear higher in the negative category and joy in the positive category, and also ranked negative sentiments above positive sentiments in the same text, based on the theory of psychoanalysis of emotions.
22
Neutral sentiment is the least ranked since no emotion is elicited. We implemented the
Time series analysis
Seven-day k-mean smoother was used to estimate active cases from the daily reported case counts and this seven-day period is on par with the Statistics Canada used bandwidth. For the tth day, k-mean smoothing with k = 7 days was used


To examine the emotional sentiment or mood changes over the pandemic waves we classified waves based on the dates of (a) emergency measures imposed in each province and (b) the beginning of the wave surge, both happening within a few days, if not coincidental, consistently across Canada. Final ARIMA negative binomial time regression model
48
includes daily negative (or positive) sentiment daily percentage as the target (dependent variable St) and daily caseloads (smoothed over seven days), as the regressor (predictor) (Ct).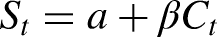
For the purpose of properly informing psychological surveillance measures, we estimated the latency period, the time period from the beginning to the end of emotion effect lasting after caseloads variations occurred, by carrying out cross-correlation analysis to daily sentiment counts. The latency was determined by estimating the lag associated with the first instance of the statistically significant cross-correlation. The cross-correlation at lag i, (ri) is estimated using the function
The time lag (or lead) for emotional sentiment exacerbation from the date of the case load surge was estimated using the residuals, filtered using the visibility graph algorithm cross-correlation method that was proven to be more effective than using the cross-correlation without filtering. 49
Power calculation for time series analysis was carried out using a method described in the literature. 50 Based on our power calculations to reach 80% power with alpha = 0.05 level of significance the length of the time series needed to detect a significant beta coefficient of case load influence of 2.5% (sentiment increase per 100 case load increase) with a standard deviation of 1.1% for 35% negative/positive/neutral sentiments is 2073 days. Given that there is a small number of tweets in four Atlantic Provinces and concurrence of the timing of public health restrictions, the four Atlantic Provinces were lumped together in the analysis. We used the formula given in Yukon, Nunavut, PEI, and Atlantic Provinces do not meet these requirements given that there are lots of missing days with no cases and sentiments detected. Therefore, we decided to combine Atlantic Provinces together and only descriptive analysis results are provided for Yukon and Nunavut.
We used the following formula for power calculation for time series regression based on the published literature.
50
We used 
Results
Validation of sentiment topics classification
For this validation segment of the study, we first considered comparison with the Ekman Lexicon, which was originally designed based on facial expressions, 19 and later expanded for textual data analysis. It performed poorly in the extraction of the prominent sentiments of COVID-19 twitter expression classification, especially when there were multiple emotions. Even more importantly it excluded two important categories of pandemic induced quarantined and locked-down related expressions of “anticipation” and “trust.” We manually examined randomly selected tweets and found Ekman lexicon puts weights on single words such as sorry in the part of the expression of “sorry to anyone in social isolation” and classified as “fear,” for example. Whereas the overall meaning of the Twitter expression “sorry to anyone in social isolation, allow actually get tested, hope everyone stay safe” was classified by NRCCEL as a positive sentiment of “joy” and neutral sentiment of “anticipation.” Given that anticipation and trust are important sentiments for quarantine-related sentiments, further analysis was conducted using NRCCEL sentiment analysis. Even further, COVID lockdown tweets emotion sentiments of anger, fear, joy, and no-emotion were significantly (p < 0.0001) over-estimated, and disgust and sadness were underestimated (p < 0.0001) in the Ekman Lexicon classification. Additionally, NRCCEL classification identifies the expression using a string of words (phrase), each phrase is given a score and then add the scores to obtain overall sentiment polarization classification. After NRCCEL classification of the sentiments, we further validated one neutral emotional classification “anticipation” using two lexicons, VADER and Wordnet lexicons. We obtained an F score of 1.29 for VADER and 0.007 for the WordNet classifier. Herein, anticipation was further classified as either positive or negative, or neutral based on the VADER lexicon scoring. Table 2 shows the sentiment polarity for each emotion topic classified by NRCCEL with further classification of “anticipation” by VADER.
Percentage distribution of tweets by sentiment classification.
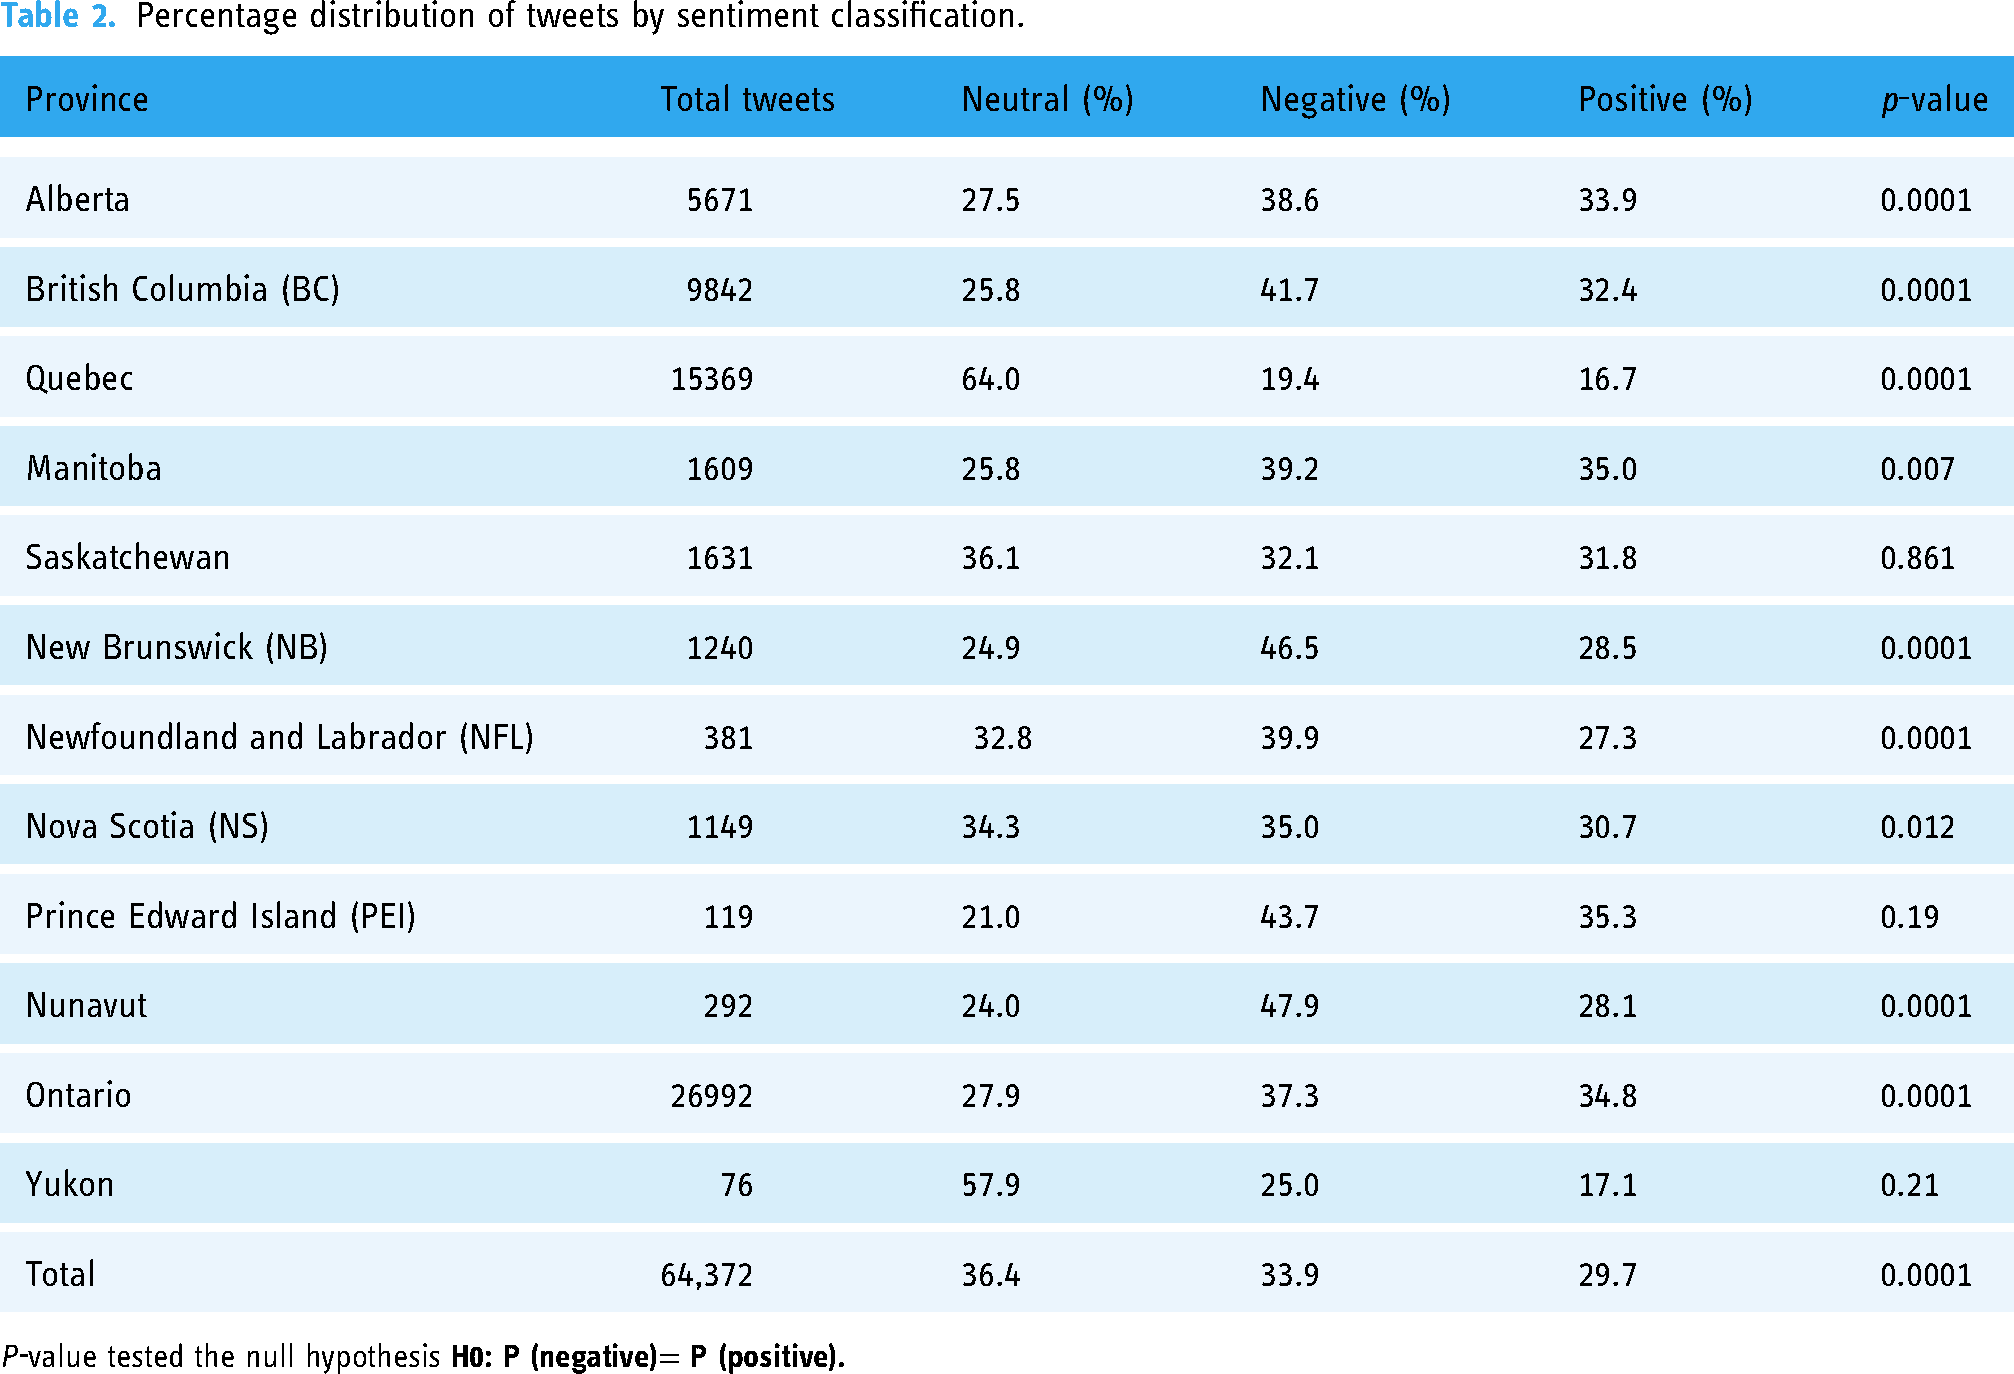
P-value tested the null hypothesis
Variations of sentiment expressions across Canadian provinces
Of the 262,204 tweets, 64,372 met the inclusion criteria for further analysis. Yukon (n = 76), Nunavut (n = 293), and Prince Edward Island (n = 119) had the least number of Tweets and did not meet the statistical power for time series analysis (Table 2). While most (36.4%) Tweets were classified as neutral, statistically significant higher percentages of negative tweets were noted in all provinces but Saskatchewan, PEI, and Yukon, for the chi-square test. The daily time series of negative and positive Tweet sentiment counts showed a peak shortly after the middle of the first wave and then exponentially decayed overtime during the second and third waves.
Most of the tweets (64.5%) were in the first wave of the pandemic, from 2 March 2020 to 10 June 2020. Overall, in Canada, the three waves of Tweets comprised the negative sentiments of Anticipation (30.1%), Fear (28.1%), Anger (25.3%), Sadness (8.6%), and Disgust (7.0%). Positive sentiments were mostly reflected by Anticipation (43.7%), Trust (41.4%), and Joy (14.9%). The tweets classified as neutral had mostly no emotions (86%), anticipation (9.6%), and surprise (4.4%).
Dynamics of Canadian sentiments and caseloads for the first three waves
The study period covered three waves of COVID caseloads, of which the first wave, the period covering March to June in most provinces is shown, before the first vertical line in Figure 5. In many provinces, the lowest peak of caseloads was in the first wave, while the third wave (19 October 2020 to 31 March 2021) showed the highest peak (Figure 5). Figure 5 shows seven-day daily caseloads (the bottom line in black), averaged using a seven-day k-mean smoother. In almost all provinces the second wave from June to October 2020, had the least number of cases. Nevertheless, negative sentiment expressions in the second wave were greater than in the other two waves.

Canadian polarized sentiment with seven-day smoothed daily caseload counts.
When considering the cross-correlation analysis of the Canadian daily caseloads and sentiment variations, there was a minimum of a five-day lag period shown for negative sentiments to arise in waves two and three, but there was no lag effect detected for wave one, during which negative sentiments were sprouted immediately, on the same day of caseloads increase. However, Tweeters’ positive sentiments took a slightly longer period to emerge, in response to rising cases. It took a minimum of six to seven days to subside positivity in all three waves. In addition to the lag effect, we were able to uncover the magnitude of the effect, when all Canadian data are combined, which calls for provincial-level analysis. In all three waves, when the percent of daily caseloads increased by 100 cases, the daily percent of negative sentiments decreased with varying magnitudes across waves, wave 1(β = −0.47, SE = 0.07), wave 2 (β = −0.20, SE = 0.04), and in wave 3 (β = −0.08, SE = 0.01). This time-varying decline of the magnitude of the gradient, from wave one through to three may indicate getting used to the new norm. Predictive power measured by R2 varies from 30% in wave 1, 12% in wave 2, and 17% in wave 3, which may be a result of having fewer tweets in waves 2 and 3.
The daily percentage of positive sentiment expressed by Canadian Tweeters did not show any association with case dynamics in waves 1 and 2 but in wave 3, perhaps because vaccines were approved in wave 3. Overall, when all three waves’ Tweets combined as the caseloads increased by 100, Canadian daily positive sentiments decreased by 5.5% (SE = 0.07). Those Canadian Tweeters who were neutral increased their neutral sentiment expressions in the first two waves with increasing caseloads. For 100 caseloads increase, neutral sentiments increased in wave 1 (β = 4.8% SE = 0.6) and in wave 2 (β = 2.3% SE = 0.42), but not in the third wave. In what follows, the geographical level analysis by province is presented.
Dynamics of daily Canadian caseloads and sentiments by province and regions
Most of the Tweets were in the first wave and we have presented the daily percentages of counts of negative, positive, and neutral for six provinces, covering the first three waves, and therein the four Atlantic provinces were combined (Figure 6). Emotional sentiments started even before the first case of COVID appeared in Canada (Figure 6). Nevertheless, as the daily COVID case numbers increased the three polarized sentiments of daily negative, positive, and neutral classifications showed varying levels and directions by geography and time (Figure 6).

First-wave daily caseloads and classified tweet emotional sentiments for Canadian Provinces.
Latency of emotional sentiment response to COVID caseloads dynamics: Cross-correlation analysis
Provincial-level latency period estimation detected the first lead time (in days), in that statistically significant negative/positive sentiment correlations with changing caseloads, were noted. These correlation results provided an estimate of latency, which can be interpreted as an estimate of the time in days taken to react to the caseload changes and we have noted the shortest latency period with the magnitude of the correlation, in Table 3. The latency period of emotional sentiment expressions appearing on Twitter, for caseloads changes, varies by province and by COVID waves. In most provinces, except Ontario (with the longest lag time of 14 days), NB, Quebec, and Alberta (no significant latency), negative emotional sentiment responses increased within two to three days of caseload increase in wave 1. Manitoba (latency = 4) and NS (latency = 9) showed a negative correlation of negative response decrease to caseloads rise in wave 2 and no significant latency in wave 3. Positive sentiments took a slightly longer period and in some provinces four to eight days to decline in response to increasing caseloads, except in Alberta (waves 2 and 3). In Quebec, the latency period for positive sentiment decline was the longest 18 days.
Cross-correlation (CC) latency period by province and waves.
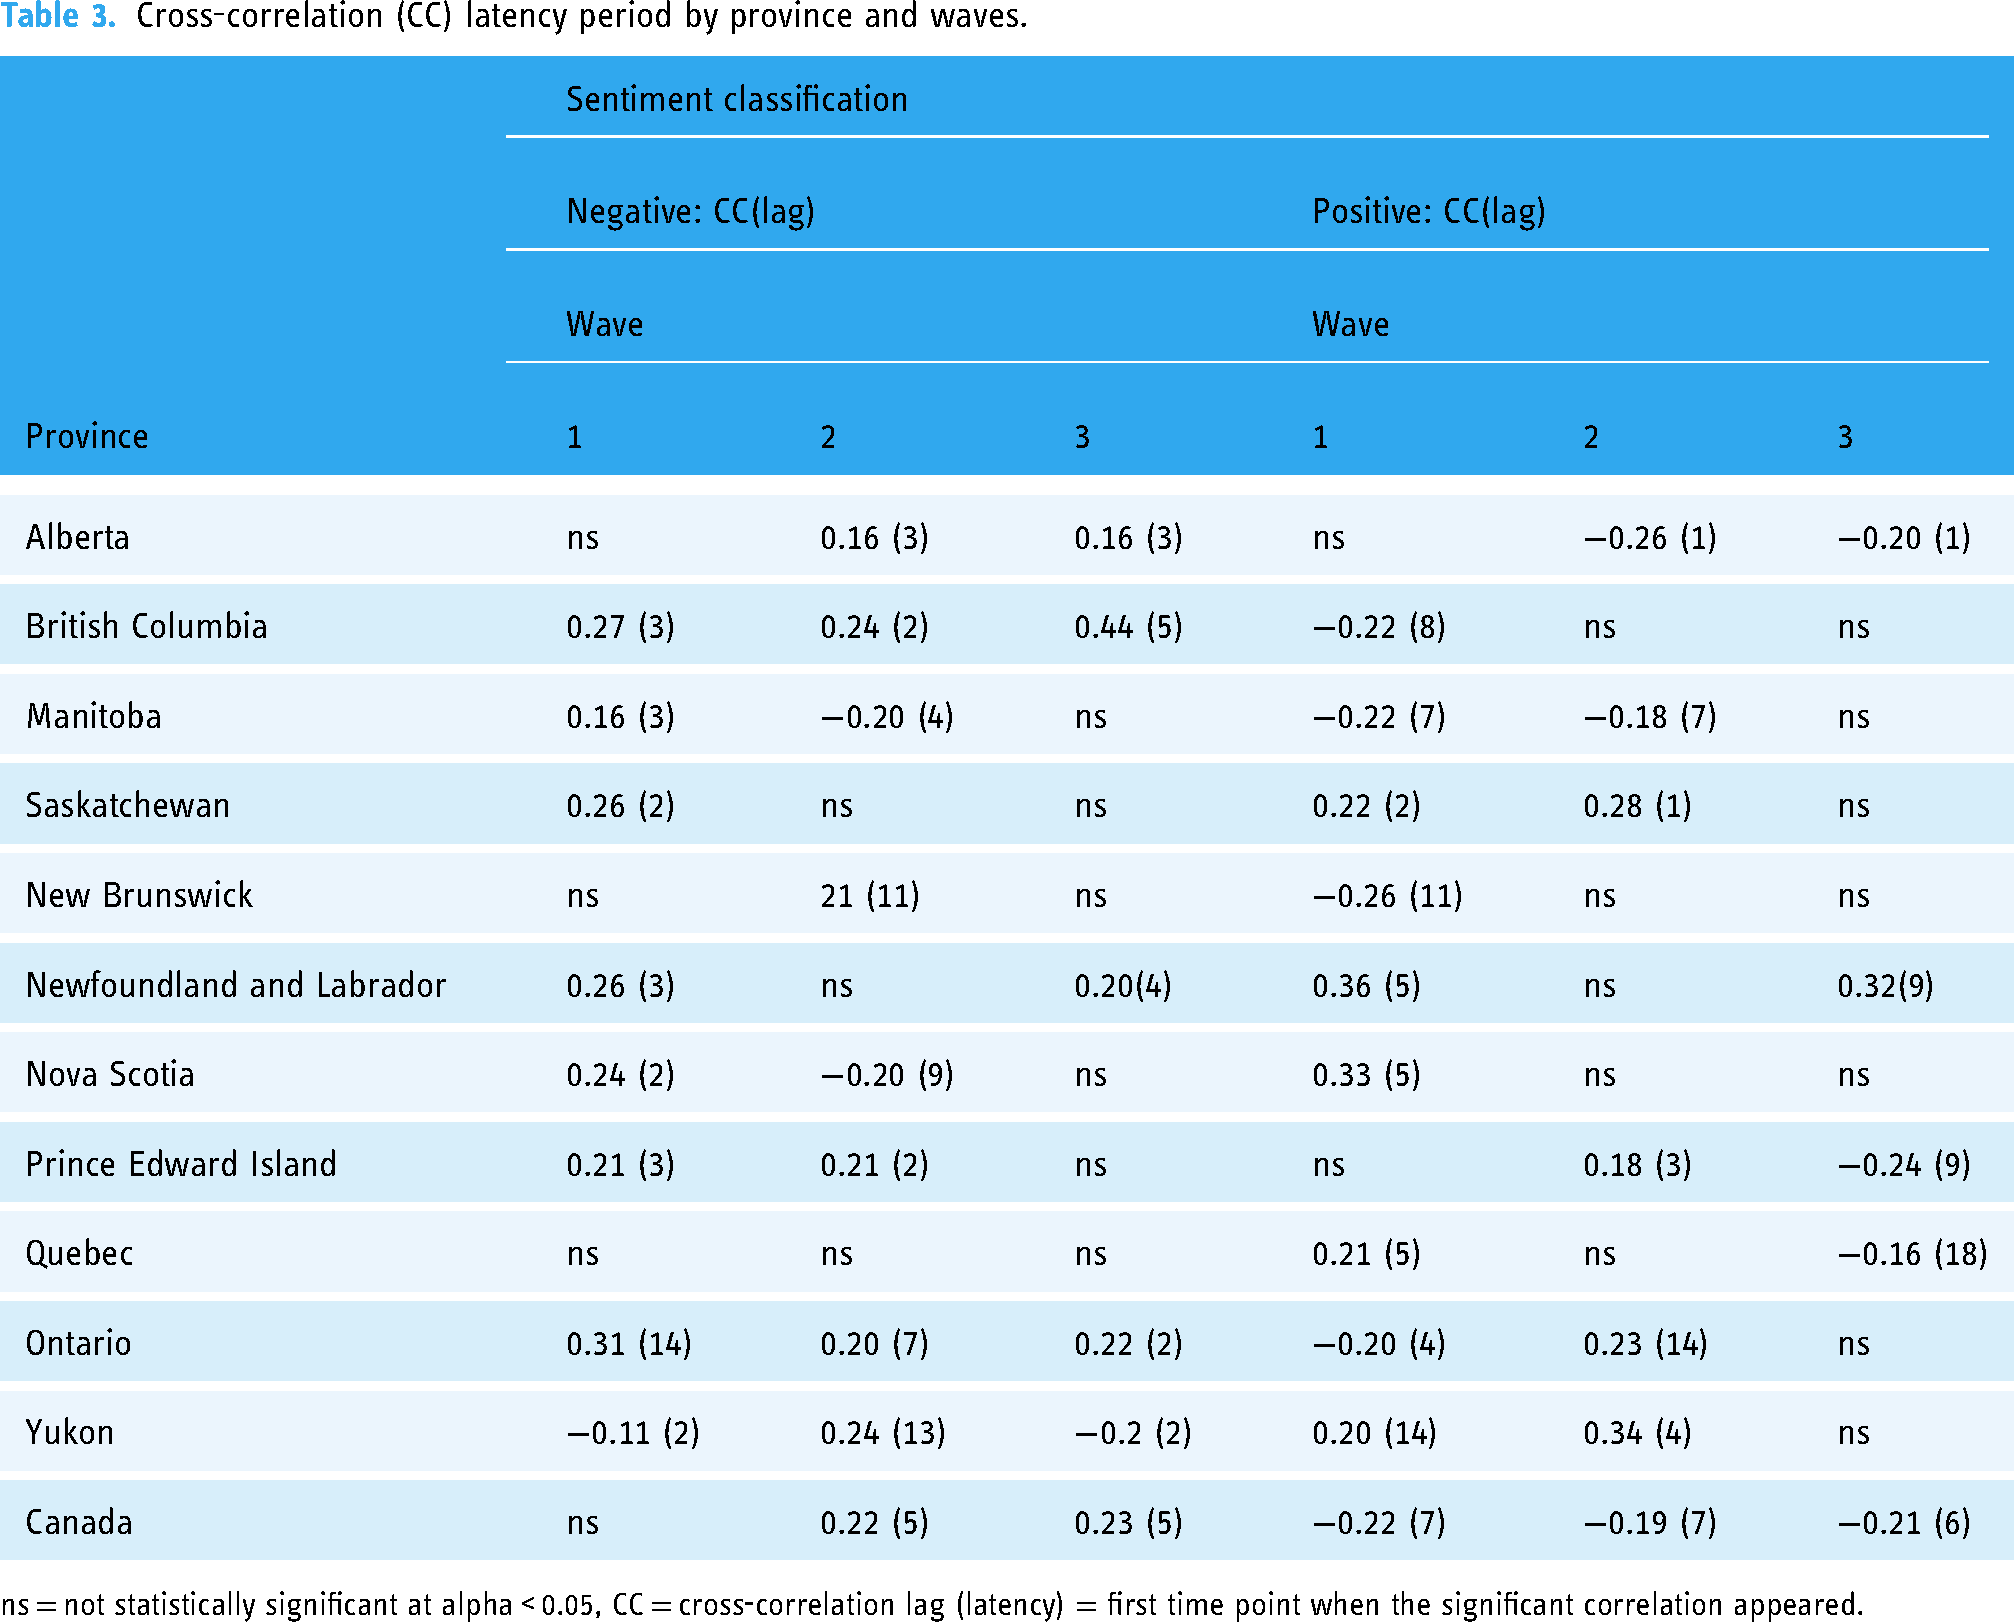
ns = not statistically significant at alpha < 0.05, CC = cross-correlation lag (latency) = first time point when the significant correlation appeared.
Emotional sentiments dynamics prognostication using COVID caseloads dynamics: ARIMA time series regression results
The percentage of variation in negative sentiments explained by the caseloads, overall, measured by R2, varied from 30% in wave 1 to 12% and 17% in waves 2 and 3. Positive sentiment prognostication was very poor (around 2.1%), but neutral sentiment predictive power was 42% in wave 1 and 19% and 1.6% in waves 2 and 3.
Negative sentiment prognostication: Canadian Tweeters’ emotional responses to increasing COVID caseloads showed geographic variations, in magnitude and direction, across all three waves (Table 4). As caseloads increased by 100, in Alberta, BC, and Quebec, Tweeters in these provinces showed resilience with decreasing daily percent of negative sentiments, whereas smaller provinces such as Manitoba and Atlantic Canada showed increased negative emotional sentiments with increasing caseloads in wave 1 (Table 4). We also found Alberta and BC Tweeters’ negative emotional sentiments in wave 2 showed a reversing trend in wave 1, with increasing negative sentiments with increasing caseloads. Quebec Tweeters consistently showed resilience towards increasing caseloads (1% decline per 100 case caseload increases). Saskatchewan's negative sentiments were not significantly related to caseloads in all three waves. Overall, Canadian Tweeters showed resilience with increasing caseloads, but the magnitude declined from waves 1 through 3.
Negative sentiment percent linear relationship with caseloads increase.

ns = no significant effect at alpha = 0.05. SE = standard error, the coefficient is for 100 COVID cases increment.
Positive sentiments prognostication: Alberta Tweeters showed an increasing trend of positive emotional sentiments during waves 1 and 3 with increasing caseloads and changed the direction in wave 2. But Ontario Tweeters remained increasingly positive with increasing caseloads in all three waves (Table 5). Manitoba, Atlantic, and Quebec Tweeters’ positive emotional responses declined with increasing caseloads in wave 1 and this pattern continued only in wave 3 in Quebec. Saskatchewan Tweeters’ positive sentiments went down with increasing caseloads in waves 2 and 3, not in wave 1.
Positive sentiment percent linear relationship with caseloads increase

ns = No significant effect at alpha=0.05. SE=standard error, the coefficient is for 100 covid case increment
Neutral Sentiment prognostication: In wave 1, Neutral sentiments increased with rising caseloads except in Alberta, which happened in wave 2 (Table 6). Of all provinces, Manitoba and Saskatchewan showed the highest magnitude of the trend in wave 1. Alberta and BC trends reversed in wave 3 showing a decline in neutral sentiments with increasing caseloads. Atlantic Canada neutral sentiments associations were not significant.
Neutral sentiment percent linear relationship with caseloads increase

ns= No significant effect at alpha=0.05. SE=standard error, the coefficient is for 100 covid case increment
Principal findings: Our hybrid modeling approach that combined AI-based emotion detection tools, as well as supervised learning methods of ARIMA time series modeling and cross-correlation analysis, demonstrated the feasibility of detecting the association between caseload dynamics and polarized emotion sentiments. The major thrust of this study was emotional sentiment extraction algorithm development and application covering an entire country, including many Canadian tweets, 64,372 gathered for a lengthy period of 396 days, covering the first three waves of the pandemic. We used established AI-based techniques and explored the dynamic relationship between daily neutral, negative, and positive sentiments with daily COVID caseloads, stratified by geographic regions. Using Canadian Tweets hash-tagged quarantine and locked down related multiple terms, study findings depict sentiments arising from these regulations. Thus, findings from Twitter data provided a basis to interpret emotional reactions in relation to this social/physical confinement. Overall, our findings suggest daily negative, positive, and neutral sentiment variations are weakly linearly related to caseload changes. It is likely that there are other factors contributing to emotional sentiment dynamics. Nevertheless, daily emotional sentiment variations are significantly influenced by daily caseload changes among those Tweeters who were concerned about being locked down and confined. We found latency of the emotional sentiments to come into effect when the caseloads changed, which was five days for negative emotional sentiments, but a little longer six to seven days for positive sentiments to be expressed.
Discussion
Using several thesauri, we found 19 semantic vocabulary terms representing social and physical confinement measures imposed by provincial public health regulatory systems. Combined with four COVID terms of expressions to these terms, we hash tagged and extracted 8,832,129 tweets, more terms than used in other COVID Tweet data analyses in single country studies. The two algorithms that we developed successfully extracted tweets, covering 396 days, and after geo-tagging and discarding those with no emotions and geo locations, we included 64,732 tweets representing Canadian twitter users’ verbal emotional reactions to these restrictions imposed by the government to control the outbreak. A global study that used two hashtags, COVID-19 and social isolation resulted in over 10 million tweets, 6 and another global study of a short duration of 48 days, that used four COVID and three confinement-related hashtags, revealed 20,051 emotional sentiments labeled tweets. 40 Whereas a study that used three keywords of COVID-19 resulted in 20,325,929 tweets from more than 170 countries. 54 In comparison to these global and multi-country study numbers of tweets, the size of our single-country study sample is large enough to represent a general population of Tweet users in the country. Our sample of Tweets, when stratified by province/region, contains 1600 to 26,992 tweets per province, which may provide a large enough sample to represent the community of Twitter users in each geography. Research conducted in China analyzing 62,119 twitter discussions on news forums stated their sample sufficiently represented a community sample, because of wider coverage. 8
Most of the Canadian tweets (64.5%) were in the first wave, which occurred from March to June 2020, and the number of daily Tweets exponentially decayed over time starting from the mode of the first caseload wave. A Spanish COVID sentiment analysis time series study that covered a shorter time span (60 days) showed a similar linearly increasing pattern at the beginning of the pandemic and then leveled off after reaching the peak of the caseload wave. 4 Another short-term (4 weeks) study conducted in Italy among oncology physicians’ sentiments expressed in WhatsApp messages showed a declining pattern in positive emotions overtime during the pandemic. 9 These geographic variations emphasize the importance of tracking geo-locations of sentiment exacerbation data collected from social media platforms and the necessity of following up for a longer duration, to capture the time-varying patterns across geographies.
Following the literature that examined people expressing positive and negative anticipation when coping with COVID, 55 we further classified NRCCEL neutral sentiment classified anticipation using VADER to extract positive anticipations and negative anticipations. Our study revealed negative anticipation as one of the dominant negative expressions followed by fear and anger, in most Canadian provinces, while positive anticipation and trust were major topics of positive sentiments shown in all Canadian provinces. Given that the positive anticipation sentiment was the highest-ranked topic among positive sentiments, Canadian Twitters’ may be optimistic about an upcoming promising end result and this finding is similar to the results shown in a US study. 55 Two other studies that analyzed healthcare professionals’ tweets, one using the Ekman lexicon noted fear and the other Italian study using the NRCCEL lexicon also noted fear, anger, and sadness as the dominating negative sentiments and both studies noted joy as the dominating positive sentiment for their COVID-19 information concepts.9,10 Our confinement/social isolation tweet study results that used the NRCCEL lexicon provided a somewhat similar pattern to the aforementioned studies and the subtle differences noted in positive sentiments may be due to the differences in populations, general versus health professionals. In addition, our Tweet data representation of confinement and social isolation may account for the noted differences. Despite hashtag, geographical, and use of lexicon classifications differences, our finding of fear and anger dominating COVID-related social media expressions is congruent with other studies. None of the above studies, polychotomized anticipation into positive, negative, and neutral and we emphasize future research to consider this extended classification.
Daily negative tweets outnumbered positive tweets indicating most Canadians relate their social confinement with anticipated negativity, combined with fear and anger as dominant negative emotions expressed. Similarly, a global study on Twitter trends during the early stage of the pandemic from January to April 2020, identified negative emotions (predominantly fear) as exceeding positive emotions. 54 This pattern that we observed was only consistent with the early days of the eight-day worldwide COVID-19-related tweet sentimental analysis results. 6 There were no consistent temporal patterns of negative sentiments dominating positive sentiments or vice versa that we observed across Canadian provincial jurisdictions shown in their short-period world tweet analysis. One Chinese study showed the opposite of the pattern we observed. Wherein Chinese tweets text analysis showed the number of positive emotions (happiness) exceeding negative emotions and they indicated the influence of religion on staying positive. 8 In addition, variations across geo-locations within a country were not tracked in those studies. The aforementioned research findings that supported the consistency of the sentiment polarity dynamic may justify the capability of our hybrid modeling approach to capture essential temporal dynamics from a lengthy recording period. Decides the influence of religion, other social media researchers had explained this pattern of negative emotions exceeding positive emotions using Grey's neuropsychological theory which states that the behavioral inhibition system (BIS) tends to negatively respond to social uncertainty increase. 8 It is possible the pandemic-related confinement and locked down related Tweets that we analyzed reflect more of the BIS-related negative psychological impact than what is shown among the general public.
We were unable to find many studies that estimated the time taken for negative and positive sentiments to exacerbate or recede (latency) after COVID caseloads surge or vice versa. The provincial level cross-correlation between the daily percentage of negative (and positive) sentiments and daily caseloads exhibited two to three days on average latency, and in some provinces like Quebec exhibited 14 days of onset of delay in the first wave. Overall, in Canada, negative sentiments were exacerbated after five days of caseload surge, in waves 2 and 3, and it took six to seven days after caseloads increase for the positive sentiments to recede. These latency periods differ not only by province and also across waves but happened within the entire “confinement” or “stay at home” 14-day period. This may reflect this study tweets extracted were related to confinement, which lasted 14 days. One may argue this ecological relationship discovery is spurious. A study conducted in China applied a system dynamic model to establish a causal relationship between public sentiments and government responses to COVID-19. 56 Their validity and rationality of the model performances revealed two findings: (1) increased government positive responses facilitated an increasing trend of positive responses and (2) changes in the epidemic a “worse disaster context” promoted negative emotions. 56 This research evidence may rationalize the dynamic pattern that we observed in some provinces, showing an increasing trend of both negative and positive emotions in relation to increasing caseloads. This may also indicate that Canadian provincial jurisdictions promptly responded to create a positive impact so that positive sentiments increased with daily caseloads increase and this needs to be confirmed in future research. A Chinese study identified significant correlations between COVID case numbers and public attention up to a six-day lag period, with the highest correlation in lag of two to three days. 57 Our findings underscore the need to examine the latency period of emotion exacerbation after caseloads surge to properly inform the timing of the onset of psychological sentiment exacerbation, during the lockdown.
Our study added another layer to the existing knowledge base by classifying the responses into negative, positive, and neutral sentiments and significantly predicting these polarized responses in relation to increasing caseloads. This ARIMA time series regression prognostic modeling of confinement and lockdown Twitter response emotions was unique to this study. Overall sentiment daily variations over time and caseload dynamics showed a weak relationship and explained 12% on average for Canada. But when considering the percentage of daily polarized tweets, by province, the daily caseload dynamics significantly predicted the negative and positive emotional sentiment exacerbation/recedes. We were able to identify a significant prognostication effect of the negative emotional effect in four to five provinces in the first three waves. In wave 1, the percentage of variation in negative sentiments (30%) and neutral sentiments (42%) explained by caseloads was higher than for positive sentiment prognostication (2.1%). While most of the Tweets (64.5%) are in the first wave and most Tweets were significantly negative sentiment expressions and this may explain the poor predictive power of positive sentiments. A study that analyzed country-level google trends depicting awareness of coronavirus found a positive serial correlation over time with an increasing volume of responses at the beginning of the pandemic, 58 and this may explain the weak relationship that we observed in some provinces with fewer tweets.
It is noteworthy, that the most populated Canadian provinces, Alberta, BC, and Quebec showed a significant resilience effect with linearly declining negative emotional sentiments and inclining positive sentiments in relation to the caseloads increase. This pattern of being vulnerable to increasing caseloads changes, showing increasing negative daily percentages of emotions and decreasing positive emotions were shown in less populated provinces of Manitoba and the region of the Atlantic. Moreover, we uncovered an association between the dynamics of neutral sentiments and caseloads, one that showed increasing neutrality in emotional sentiments with increasing caseloads in the first wave. Confirming the vulnerability, a study conducted in Ontario used a multifactor ARIMA model that included the daily positive-to-negative sentiment ratio for 200 days (that covered the first two Canadian COVID waves) and found a negative association with increasing cases (−0.98 per 100 caseloads increase, p = 0.02). 26 The results are incompatible in magnitude since we used the daily percentage of sentiments, not the ratio, and only confinement-related Tweets but confirmed a similar direction of the association between dynamics of caseloads and sentiments using ARIMA models.
Chandrasekaran et al. 25 stated that there is a dearth of knowledge on the temporal pattern of emotional sentiments in relation to COVID outbreaks and our study findings filled this gap in knowledge. They used topics of emotional expressions in global tweets that included 20 topics including the spread of the virus and lockdown regulations for a five-month period, from January to May 2020 and their analysis revealed a higher proportion of negative sentiment scores during the 12 weeks of spread and growth of cases. 25 This pattern further confirms our study finding of significant associations of negative emotional effects with increasing caseloads noted in time series regression models. They illustrated positive sentiments were related to government announcements of incentives for people affected by regulating lockdowns 25 and the positive sentiment trends we noted may also be a result of the Canadian government provision of incentives such as supplementary income packages during the lockdown. Literature suggests other factors contributing to emotional dynamics. A study conducted among nurses’ Facebook expressions found a peak in negative sentiments during the period of isolation. They stated this effect was a result of being away from friends and family, loneliness, and fear of being infected, and they found a peak in the positive sentiments during the period of granting incentives. 59 These global study findings justify the dynamic relationships that we uncovered and there are other factors contributing to sentiment temporal variations in addition to caseloads variations.
Though we did not follow a cohort of tweeters using an ID, our findings, when contextualized within confinement and lockdown regulations, may suggest (a) there are three cohorts of tweeters, depending on being pessimistic, optimistic, and naturalistic expressing negative, positive, and neutral sentiments or (b) there is one cohort of tweeters changing their views, from negative to positive or being neutral, depending on external circumstance including caseload dynamics.
Conclusion
Our hybrid modeling approach that combined AI-based sentiment analysis and ARIMA time series regression modeling provided important tools for emotion sentiment detection. Within the context of lockdown and confinement, our findings provided directions for public health regulatory authorities to curb the public emotional crisis in relation to surging caseloads. Emotional exacerbations were greater at the beginning of the pandemic during the first wave and within this period caseloads alone explained up to 30% of negative emotions variations. Even though, the caseloads peaked higher during the third wave of the pandemic, Twitter's emotional sentimental expressions were lesser in magnitude than in the first wave, possibly due to getting used to the new norms of confinement and lockdown. It is important to take necessary measures to address rising negative emotions at the early stage of the pandemic within two to three days of the caseloads surge. Our findings suggest geographic heterogeneities of public reactions, depicted by emotional dynamics in tweeter expressions in relation to COVID caseload changes within the same country. The magnitude, direction, and latency periods of the emotional sentiments varied provincially. These noted dynamics of provincial-level differences, in public emotional sentiment expressions, should be considered when planning provincial-level confinement-related psychological health promotion efforts. Future research should validate social media text corpora-based emotional sentiment polarities using geo-linked data obtained from a community sample.
Implications: In addition to public health implications, this study contributed an AI-based theoretical framework for extracting and geo-coding Tweets and classification of expressions with a mixture of emotions into a dominant emotion using Lexicon-based emotional sentiment classifications. The hybrid modeling approach with statistical methods expanded to uncover the ecological relationship between temporal variations of emotions and caseload dynamics. The results of the application provide directions for geographically targeted psychological health monitoring. Another dimension uncovered in this study is the benefit of the use of social media as a venue for the free expression of negative outcomes of anticipation, anger, and fear as well as positive outcomes of joy and trust during a confinement and lockdown period. Free expression can be interpreted as a form of social therapy. 4
Supplemental Material
sj-docx-1-dhj-10.1177_20552076231171496 - Supplemental material for Dynamics of emotion trends in Canadian Twitter users during COVID-19 confinement in relation to caseloads: Artificial intelligence-based emotion detection approach
Supplemental material, sj-docx-1-dhj-10.1177_20552076231171496 for Dynamics of emotion trends in Canadian Twitter users during COVID-19 confinement in relation to caseloads: Artificial intelligence-based emotion detection approach by Swarna Weerasinghe, Oladapo Oyebode, Rita Orji and Stan Matwin in DIGITAL HEALTH
Footnotes
Acknowledgements
The authors acknowledge the permission granted by Twitter Inc, to extract data.
Authors contributions
Data extraction, curation, and sentiments analysis: Oladapo Oyebode, supervised by Rita Orji and Stan Matwin. COVID data extraction, statistical analysis, and interpretation of results: Swarna Weerasinghe. Original manuscript Writing: Swarna Weerasinghe, Oladapo Oyebode, and Rita Orji. Editing and comments: Rita Orji and Stan Matwin.
Declaration of conflicting interests
The author(s) declared no potential conflicts of interest with respect to the research, authorship, and/or publication of this article.
Ethical approval
Anonymous aggregated data were extracted and no IRB approval was needed.
Funding
The author(s) received no financial support for the research, authorship, and/or publication of this article.
Informed consent
No participant consent was applicable. The data extracted from Twitter was completely anonymous and Statistics Canada released daily COVID caseload numbers that did not contain any personal identifiers.
Supplemental material
Supplemental material for this article is available online.
References
Supplementary Material
Please find the following supplemental material available below.
For Open Access articles published under a Creative Commons License, all supplemental material carries the same license as the article it is associated with.
For non-Open Access articles published, all supplemental material carries a non-exclusive license, and permission requests for re-use of supplemental material or any part of supplemental material shall be sent directly to the copyright owner as specified in the copyright notice associated with the article.