
Abstract
Objective
Despite the availability of thousands of mental health applications, the extent to which they are used and the factors associated with their use remain largely unknown. The present study aims to (a) assess in a representative US-based population sample the use of smartphone apps for mental health and wellbeing (SAMHW), (b) determine the variables predicting the use of SAMHW, and (c) explore how a set of variables related to mental health, smartphone use, and smartphone “addiction” may be associated with the use of SAMHW.
Methods
Data was collected via online questionnaire from 1989 adults. The data gathered included information on smartphone use behavior, mental health, and the use of SAMHW. Latent class analysis was used to categorize participants. Machine learning and logistic regression analyses were used to determine the most important predictors of SAMHW use and associations between predictors and outcome variables.
Results
While two-thirds of participants had a statistically high probability for using SAMHW, nearly twice more had high probability for using them to improve wellbeing compared to using them to address mental health problems (43% vs. 18%). In both groups, these participants were more likely to be female and in the younger adult age bracket than male and in the adult or older adult age bracket. According to the machine learning model, the most important predictors for using the relevant smartphone apps were variables associated with smartphone problematic use, COVID-19 impact, and mental health problems.
Conclusion
Findings from the present study confirm that the use of SAMHW is growing, particularly among younger adult and female individuals who are negatively impacted by problematic smartphone use, COVID-19, and mental health problems. These individuals tend to bypass traditional care via psychotherapy or psychopharmacology, relying instead on smartphones to address mental health conditions or improve wellbeing. Advising users of these apps to also seek professional help and promoting efforts to prove the efficacy and safety of SAMHW would seem necessary.
Introduction
The dissemination of smartphones (more than 2 billion users worldwide) 1 has been accompanied by the rapid dissemination of digital smartphone apps, including for health and wellbeing purposes. This phenomenon can potentially reduce the gap in mental health services delivery. As such, the World Health Organization launched the 2020–2025 global strategy on digital health “to improve health for everyone, everywhere by accelerating the development and adoption of appropriate, accessible, affordable, scalable, and sustainable person-centric digital health solutions” (p. 3). 2 The opportunity to provide wide scale screening and treatment tools for mental health conditions has led to a rapid development of the field (over 10,000 mental health apps available through Google play and App stores, in addition to many wellbeing-related apps).3,4 Furthermore, several smartphone apps have been launched specifically targeting problematic smartphone use.4,5 Despite important concerns related to the quality of health-related apps,6,7 there is some evidence from meta-reviews and meta-analyses that some of the mental health apps may be efficacious at reducing symptoms including anxiety, depression, and “stress.”8–11
Mixed results were reported on general health-related app adoption. For instance, a study on a representative German sample reported low-to-moderate acceptance of such apps. 12 However, previous studies utilizing small convenience samples suggested interest in smartphone apps for mental health and wellbeing.13,14 Several studies described possible predictors of acceptance of mental health-related apps, including a positive attitude toward the apps, stress-related symptoms, 14 and the perceived utility of a given app. 15 Studies conducted in Saudi Arabia and the United States on convenience samples of individuals with mental health disorders showed that 25% to 40% of people were using mental health apps.16,17
The stress brought about by the COVID-19 pandemic (e.g. confinement, mental and general health difficulties, healthcare access challenges, financial anxiety, etc.) has led to a dramatic increase in the use of digital health tools, particularly for video-enabled treatment.18,19 This phenomenon was also possibly associated with an increase in wellbeing app downloads (e.g. meditation apps). 20 However, despite the wide availability of apps for mental health, wellbeing, and smartphone use control, and despite a broadening evidence base for their potential benefit, there is limited precise knowledge on the penetrance of these tools and the user characteristics linked to them.
Study purpose
The present study aims to assess in a representative sample of the US population the use of smartphone apps for mental health and wellbeing (SAMHW). The study also aims to explore how a set of variables related to mental health, smartphone use, and smartphone “addiction” may be associated with the use of SAMHW, and what the most important predictors for the use of SAMHW are.
Research questions
Five research questions guided this study.
First question (RQ1): In a representative sample of the US population, what is the prevalence of use of SAMHW? Second question (RQ2): In a representative sample of the US population, can we identify and describe underlying classes of users of SAMHW? Third question (RQ3): If underlying classes of smartphone users are identified, what are the associations between participants’ sociodemographic characteristics (age and sex) and the uncovered latent classes? Fourth question (RQ4): Among variables such as age, sex, average daily duration of smartphone use, perceived level of social problems due to smartphone use in 12 months preceding the study, alcohol use disorder, smartphone “addiction,” and mental health disorders experienced in 2 weeks preceding the study, what are the most important features (covariates) predicting smartphone users’ uncovered latent class membership? Fifth question (RQ5): What are the associations between the covariates (age, sex, average daily duration of smartphone use, perceived level of social problems due to smartphone use, alcohol use disorder, smartphone “addiction,” and mental health disorders experienced in 2 weeks preceding the study) and the unveiled latent classes of users of SAMHW?
As this was designed as an exploratory study, no hypotheses associated with these research questions were made.
Methods
Participants
A representative sample of the US adult population was recruited. Overall, 1989 individuals participated in the study and answered an online questionnaire. Participants’ descriptive statistics of the two considered sociodemographic variables are: age 19–76 years old (M = 45; SD = 16); age categories 19–35 (691/35%)), 36–60 (802/40%), and 61–76 years old (496/25%); sex: male (965/48.51%), female (1006/50.57%), and nonbinary (18/0.9%).
Recruitment and sampling procedures
The crowdsourcing platform Prolific (https://www.prolific.ac/) was used to recruit study participants online and anonymously. Prolific has advantages over other similar platforms in that it is exclusively dedicated to research studies, and its participants are considered more naïve to experimental research and more ethnically and geographically diverse. 20 Prolific offers nationwide representative samples of adults in two countries (the United States and the United Kingdom). Based on the US base of one of the authors (EA) and that he was among the first to publish a scholarly assessment of smartphone apps to treat problematic smartphone use, 21 the authors opted for using the Prolific platform to recruit a US representative sample in terms of age, sex, and ethnicity. A stratification method of sampling was used: from the Prolific US community of more than 42,000 users active on the platform in the past 3 months preceding the data collection, Prolific extracted a sample of 1989 individuals with a similar distribution of age, sex, and ethnicity as the national population as determined by US Census Bureau data.
Participants received approximately USD 1.3 for completing the questionnaire.
Data collection material
The online questionnaire included items on two sociodemographic characteristics in participants (age and sex); smartphone operation system (OS); smartphone use in the 12 months preceding the study (e.g. daily use duration, average daily use duration for non-essential activities, social problems due to smartphone use); use of smartphone apps in the 12 months preceding the study to diagnose a mental health problem and/or to assess wellbeing (Yes/No); use of smartphone apps in the 12 months preceding the study to treat a mental health problem and/or to improve wellbeing (Yes/No); psychiatric diagnoses, including alcohol use disorder, over the course of the participant's lifetime (Yes/No); and smartphone use during the COVID-19 pandemic (7-point response scale). Participants also completed the Smartphone Application-Based Addiction Scale, 22 which is comprised of 6 items and a 6-point response scale ranging from strongly disagree to strongly agree; the DSM (Diagnostic and Statistical Manual of Mental Disorders)-5 Self-Rated Level 1 Cross-Cutting Symptom Measure 23 (24 items, 5-point response scale ranging from Not at all to Nearly every day), assessing symptoms, during the 2 weeks preceding the survey completion, across 14 domains: anxiety, depression, anger, personality functioning, mania, sleep problems, somatic symptoms, psychosis, suicidal ideation, memory, dissociation, repetitive thoughts and behaviors, and substance use. In the present study, these dimensions were labeled “DSM Anxiety,” “DSM Depression,” etc. Although, outside of the treatment of smartphone addiction, no specific app names were included in the survey or queried about, survey questions were structured to communicate that “mental health” apps are meant for the diagnosis or treatment of a particular mental health diagnosis, whereas “wellbeing” apps are meant for the improvement of overall health through lifestyle modifications (exercise, meditation, etc.).
Ethics
The survey was conducted in accordance with the Swiss Human Research Act (Chapter 1, Section 1, Article 2, Scope: 2c) as it relates to research involving anonymously collected health-related personal data (https://www.fedlex.admin.ch/eli/cc/2013/617/en). Additionally, the company who collected the data in the United States obtained the participants digital informed consent for participation in the survey. The data collection was conducted in compliance with the US law and ethical norms. Participation was voluntary and restricted to those aged 18 years and over. All data was collected anonymously.
Data analysis
To answer RQ1, we constructed a crosstab with the smartphone health app variables × the participants’ sociodemographic characteristics and conducted a Pearson's chi-square of independence.
To answer RQ2, we conducted a latent class analysis (LCA) using the “poLCA” R package on the relevant data. Using participants’ item responses, LCA algorithms divide participants into subgroups based on unobservable constructs (latent variables). For a more detailed description of LCA algorithms, see Hagenaars and McCutcheon 24 and Weller et al. 25 In total, we ran 6 LCA models, with first model nclass = 2, second model nclass = 3, and so on. In each model, the other poLCA function parameter settings were as follows: nrep = 10, na.rm = F, graphs = T, maxiter = 100,000. After making sure that the six models built were well identified (through maximum likelihood estimation), we proceeded to the comparison and model selection. We selected the model with three latent classes because it was the one with best performance metrics (Bayesian Information Criterion [BIC] metrics (where the lowest value is considered better), entropy metrics (where the highest value is considered better)) and interpretability.
To answer RQ3, we computed a crosstab with age × sex × latent-class and calculated the Pearson's X2 of independence.
To answer RQ4, we used the “randomForest” package for R to build a machine learning classification model. For more information on the random forest (RF) algorithm, see Breiman et al. 26 and Vera Cruz et al. 27 The RF classification models yield, among other outputs, the relative importance of each predictor variable by relying on the mean decrease accuracy (MDA) measure. More specifically, the MDA metric expresses how much accuracy the model would lose by excluding each variable, thus indicating the importance of each variable for the success of the classification. RF are nonparametric and as such are able to capture nonlinear relationships, including interactions among predictors. 26 To select the best option, we built three classification models with different fitting parameters. In machine learning, the original dataset has to be split into at least two sets: one to train the model; the other to estimate the performance of the model in making predictions. In the current study, the dataset was randomly subdivided as follows: train-set = 70% of the sample; test-set = 30% of the sample. The fitting parameters for the selected model were as follows: “ntree” = 500, “mtry” = 4. The performance metrics of the selected model on the test-set data were as follows: accuracy score = 0.71 (95% confidence interval 0.65–0.77); No-Information Rate [NIR] = 75; p value (Accuracy [ACC]>NIR) = <0.001; kappa = 0.68.
The use of machine learning algorithms rather than standard methods can be explained by the fact that these algorithm hyperparameters allow us to build and test different models in terms of prediction capabilities and choose the best prediction models according to specific metrics. 26 In particular, the algorithm we used in our analysis (RF) is considered among the best for the prediction and ranking of the most important predictor variables.26,28–30 It must be noted, however, that machine learning classification and regression algorithms do not make inference statistics; this explains why we used standard methods such as logistic regression to obtain inference information.
To answer RQ5, we built a multinomial logistic regression model using the SPSS software (version 28.0). According to the Likelihood Ratio chi-square test, the full model was a significant improvement in fit over a null model (χ2(44) = 647.748, p < 0.001). Pearson's chi-square test indicated that the model fit the data well (χ2(3930) = 3776.614, p = 0. 960), as did the deviance chi-square (χ2(3930) = 3492.038, p = 1.000) (for both, nonsignificant test results are indicators of good fit31,32).
Results
Descriptive statistics on participants’ smartphone use
The statistics are reported as number of participants (percentage of participants).
Participants’ smartphone OS distribution was as follows: Android = 1097 (55%); iOS = 874 (44%); other = 6 (03%); don't know = 12 (06%). Daily average smartphone use duration was as follows: Min = 0.27h; Max = 17h; M = 3.33h; standard deviation (SD) = 2.27h; median = 3h. Daily average smartphone use for non-essential activities (12 months preceding the study) was as follows: <1h = 279 (14%); 1–3h = 780 (39%); 3–5h = 527(26%); 5–7h = 188(9%); 7–9h = 113 (6%); >9h = 102 (6%). Participants’ experience of social problems attributable to smartphone use (12 months preceding the study) was as follows: definitely no = 1109 (56%); probably no = 557 (28%); probably yes = 262 (13%); definitely yes = 61 (3%). Participants seeking professional help to reduce smartphone use: Yes = 26 (1%); No = 1963 (99%). Participants seeking professional help to deal with social problems due to smartphone problematic use: Yes = 38 (2%); No = 1951 (98%). The existence of a mental health diagnosis over the participant life course: Yes = 587 (30%); No = 1402 (70%). And, the existence of a diagnosis of alcohol use disorder over the participant life course: Yes = 102 (5%); No = 1887 (95%).
Descriptive statistics of participants’ use of apps to limit smartphone use
As many as 263 (13%) of participants reported having downloaded at least one app to limit smartphone use. Among them, 53 (3% of the total sample) downloaded more than one app. Participants’ use by app was as follows: Antisocial (60/18%), Freedom (25/8%), ZenScreen (21/6%), Moment (20/6%), BreakFree (20/6%), Space (19/6%), AppDetox (18/5%), Social Fever (15/5%), Cold Turkey (12/4%), innerMode (9/3%), F.lux (8/2%), and RealizD (6/2%). In addition, 95(29%) of participants who downloaded apps to limit smartphone use reported using “other apps” not queried about in the survey.
The popularity of SAMHW
Table 1 shows a crosstab of participants’ health app use variables × sociodemographic variables.
SAMHWB: use by age and sex in US adult population.

Data are shown as n(%).
Note: figures with the same exponent in each column are significantly/statistically differents (p < 0.05). For example: regarding age in column ACMH, 30% is significantly different from 42% and from 28%, they have the same expotenent (the letter "a"); 28% and 30% are also significantly different. Figures with different exponents in each column are not significantly differents.
ACMH: applications to check mental health; ACTMH: applications to treat mental health; AIWB: applications to improve wellbeing; SAMHWB: smartphone applications for mental health and wellbeing.
As shown in Table 1, 15% (297 out of 1989) of participants reported having used apps to diagnose mental health conditions such as depression, anxiety, and substance use disorders in the 12 months preceding the study; female and younger adults (19–35 years old) were significantly more likely to be part of this group compared to males, adults (36–60 years), and older adults (61–76 years). Also, 13% (255) of participants reported having used apps to treat mental health conditions such as depression, anxiety, and substance use disorders in the 12 months preceding the study; female and younger adults were more likely to be part of this group compared to males, adults, and older adults. Additionally, 60% (1193) of participants reported having used apps to improve their wellbeing (e.g. meditation apps, relaxation apps, mindfulness apps, exercise apps); younger adults were more likely to be part of this group compared to adults and older adults.
Composition of SAMHW users’ latent classes
Table 2 displays the composition of the SAMHW users’ latent classes by age category and sex.
Composition of the SAMHWB user latent classes by age and sex.

Data are shown as n(%).
Note: figures with the same exponent in each column are significantly/statistically differents (p < 0.05). For example: regarding age in column WAU, 36% is not significantly different from 44% (they have different exponents); 21% is significantly different from 44% (they have the same exponent “b”), 36% is not significantly diffrent from 44% (they have different exponents “a” and “b”).
AAU: all-app users; NAU: non-app users; NBP: number of participants; SAMHWB: smartphone applications for mental health and wellbeing; WAU: wellbeing-app users.
The first latent class (770 participants, 39% of the sample) was labeled no-app-users (NAU), because members of this group have low or non-existent probabilities of using any of the relevant smartphone apps (apps to diagnose or treat mental health conditions; apps to improve wellbeing; and apps to limit smartphone use). Adult and older adult participants were significantly more likely to be part of this group compared to young participants.
The second latent class (856 participants, 43% of the sample) was labeled wellbeing-app-users (WAU), because members of this group have high probabilities of using smartphone apps to improve wellbeing but low probabilities of using other relevant smartphone apps. Younger adult and adult participants were significantly more likely to belong to this group compared to older adults.
The third latent class (363 participants, 18% of the sample) was labeled all-app-users (AAU), because members of this group have high probabilities of using all the smartphone health apps surveyed (apps to diagnose or treat mental health conditions; apps to improve wellbeing; and apps to limit smartphone use). Females and younger adults were significantly more likely to be part of this group compared to males, adults, and older adults.
The best predictor variables of latent class membership
Figure 1 shows the RF machine learning selected model MDA plot, that is, the 22 predictor variables (in decreasing order of importance) of the three uncovered SAMHW users’ latent classes.
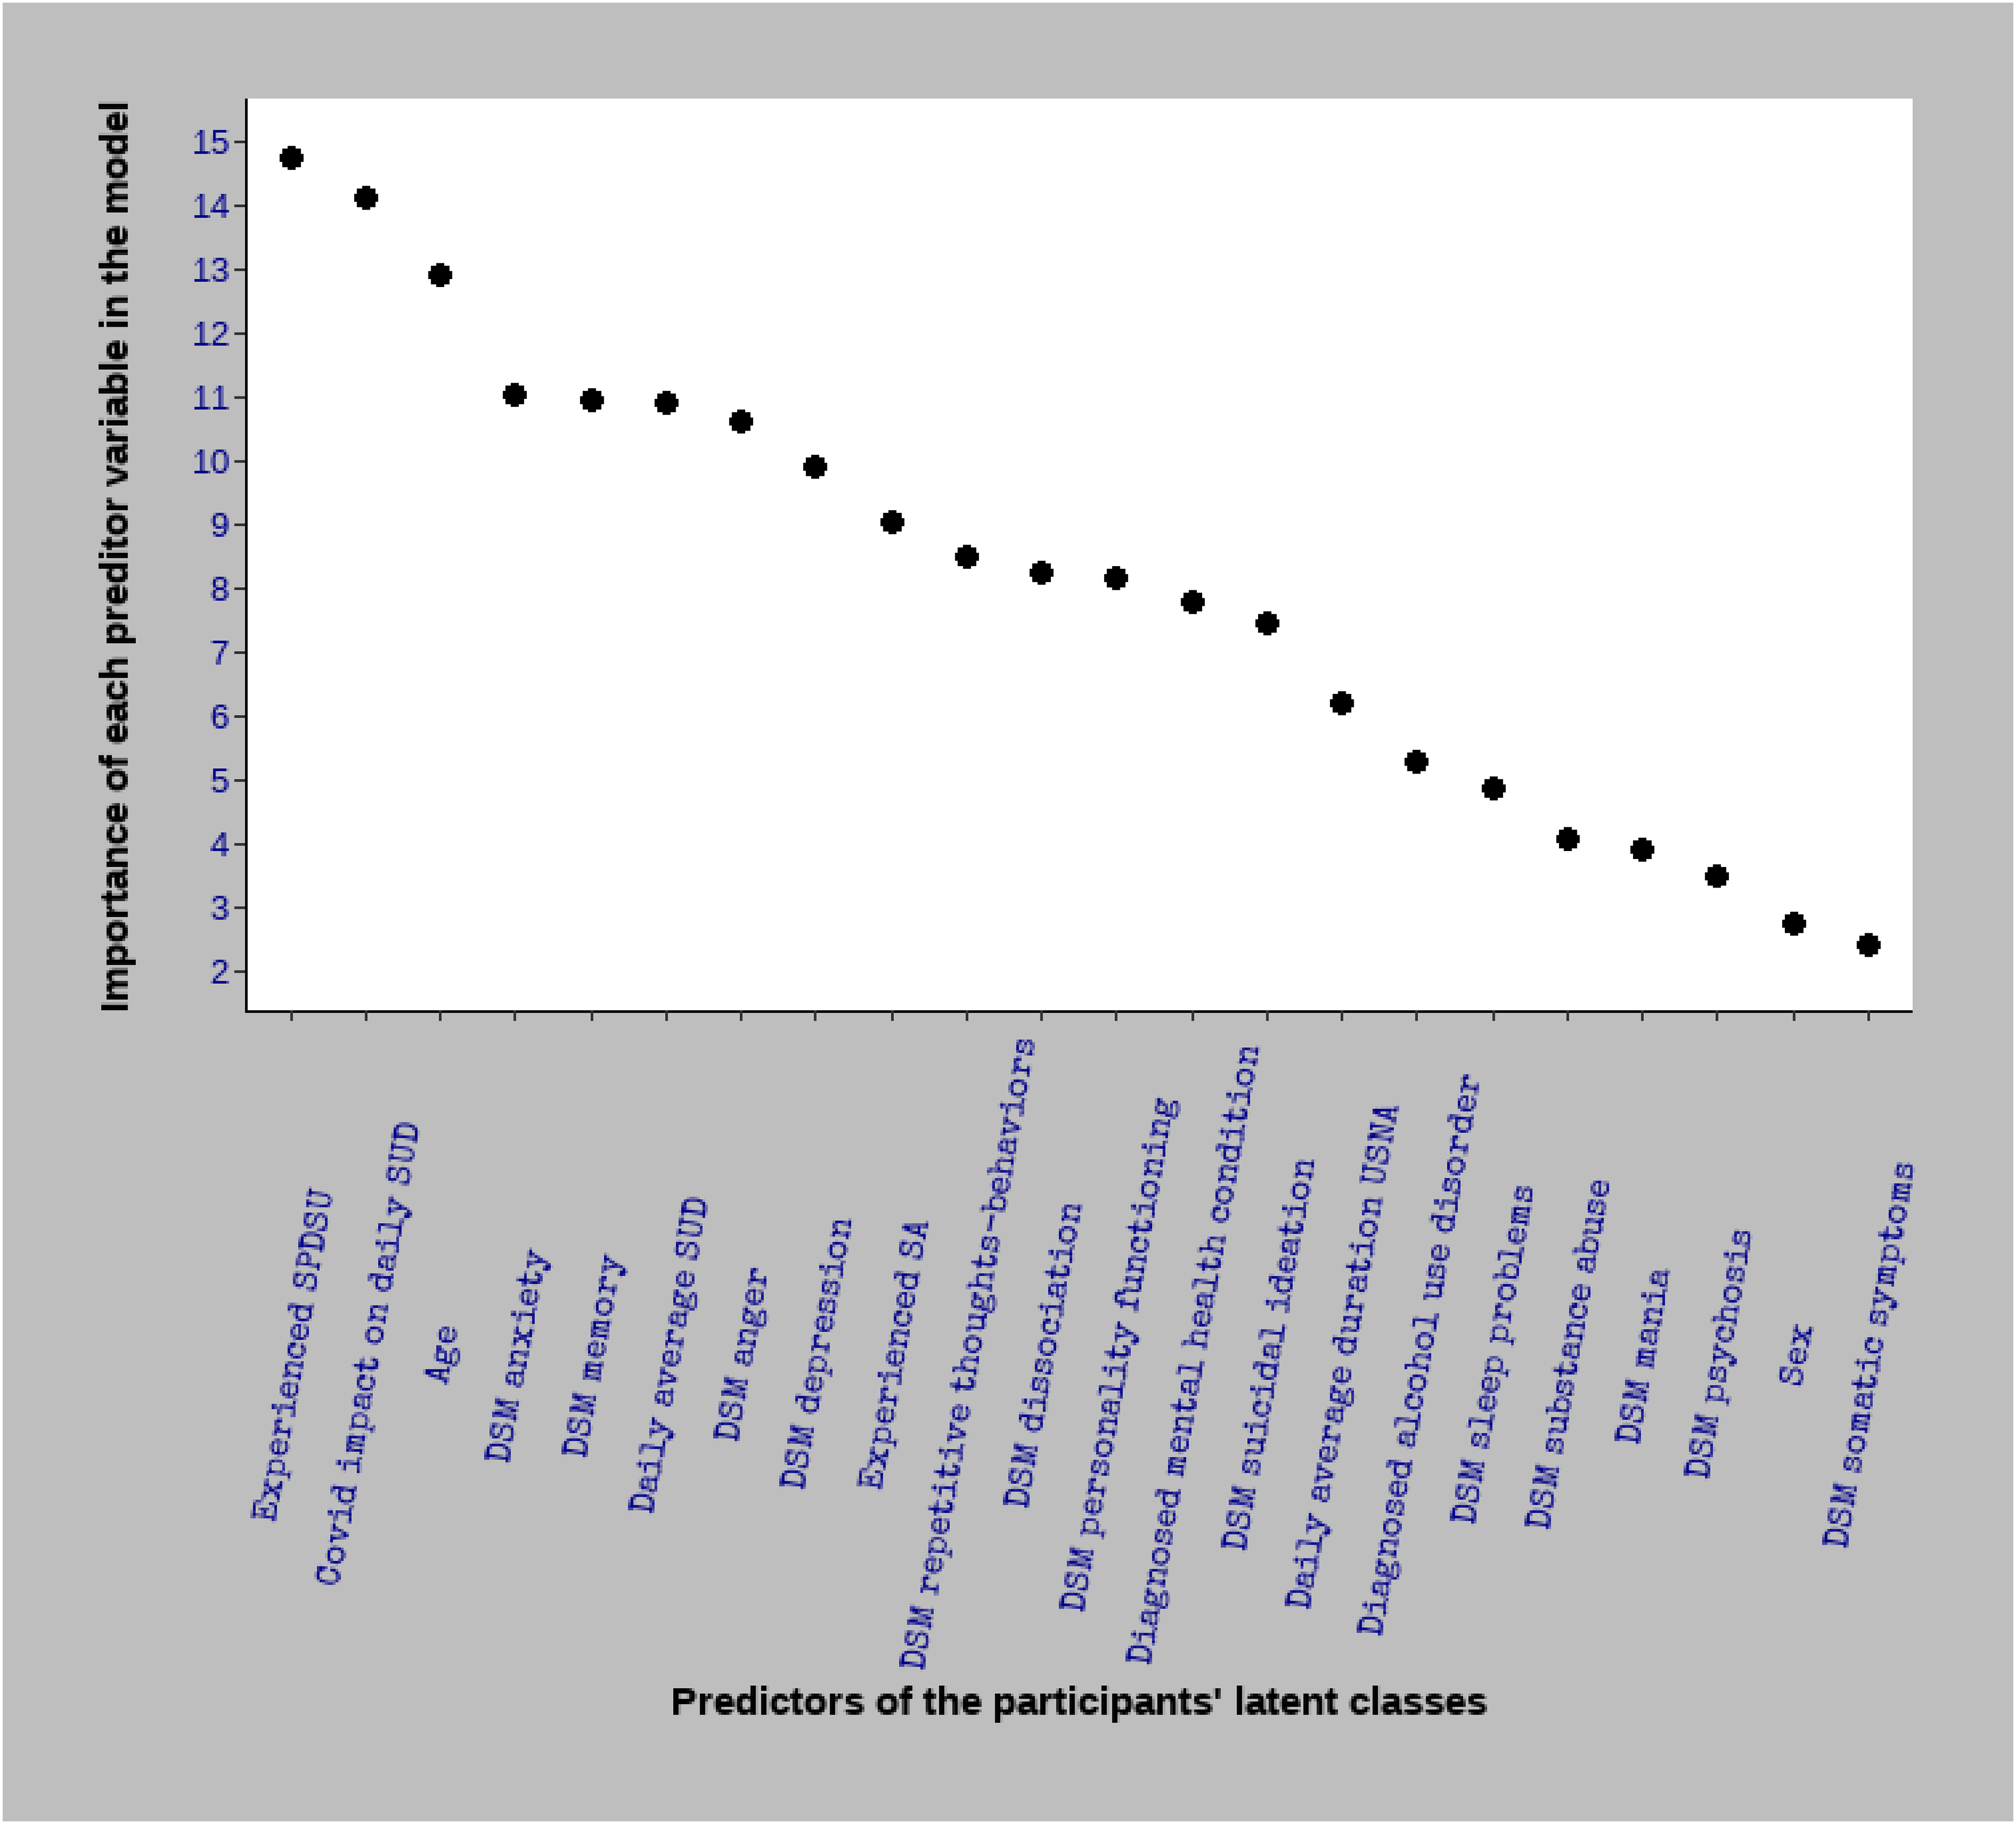
MDA plot of the random forest machine learning model. It shows, in decreasing order, the importance of each predictor variable for latent class membership. For instance, among the 22 predictors included, the most important is the level of “experienced social problems due to smartphone use” (MDA = 14.76). DSM: Diagnostic and Statistical Manual of Mental Disorders; MDA: mean decrease accuracy; SA: smartphone “addiction”; SPDSU: social problems due to smartphone use; SUD: smartphone use duration; USNA: using smart phone on non-essential activities.
As shown in Figure 1, among the 22 predictors included in this model, the 10 most important were: experienced social problems due to smartphone use (MDA = 14.76); COVID-19 impact on daily smartphone use duration (MDA = 14.11); age (MDA = 12.93); DSM anxiety (MDA = 11.03); DSM memory (MDA = 10.95); daily average smartphone use duration (MDA = 10.92); DSM anger (MDA = 10.62); DSM depression (MDA = 9.90); experienced smartphone “addiction” (MDA = 9.04); and DSM repetitive thoughts-behaviors (MDA = 8.49). The three least important predictor variables were: DSM somatic symptoms (MDA = 2.42); sex (MDA = 2.73); and DSM psychosis (MDA = 3.50). As stated, the value associated with the MDA (e.g. MDA = 14.76 for experienced social problems due to smartphone use) means the model loses that value (14.76 points) on its total accuracy score if the corresponding predictor variable is removed.
The importance of the RF machine learning algorithm for assessing predictor variables is not only that it allows ranking them in descending/ascending order: it can also be used for variable selection and variable multicollinearity checks. Thus, only the predictor variables with a MDA > 2 and the nonmulticollinearity ones were selected for inclusion in the multinomial logistic regression model, the results of which are presented below.
Associations between covariates and the three uncovered SAMHW latent classes
Table 3 shows the summary of the multinomial logistic regression model. In this model, the NAU latent class was set as the reference class and coded “0,” which means that the model was designed to predict the probability of an individual belonging to the WAU latent class (coded “1”) and the AAU latent class (coded “2”).
The estimated beta coefficients of the associations between the covariates and the SAMHWB user latent classes.

* Significant at p < 0.05.
The top part of the table represents comparisons between NAU latent class, which is the reference class (baseline), and the WAU latent class. The bottom part represents comparisons between NAU latent class and the AAU latent class.
AAU: all-app users; b: beta coefficient; CI: confidence interval; DSM: Diagnostic and Statistical Manual of Mental Disorders; NAU: non-app users; OR: odds ratio; p: p-value; SAMHWB: smartphone applications for mental health and wellbeing; SE: standard error; WAU: wellbeing-app users.
In this table, the first part (top) represents comparisons between NAU latent class, which is the reference class (baseline), and the WAU latent class. In this part of the table, the covariates significantly associated with the latent classes are: Covid-19 impact on smartphone daily use duration (b = 0.199; odds ratio (OR) = 1.220; p < 0.001); experienced social problems due to problematic smartphone use (b = 0.338; OR = 1.402; p < 0.001); DSM anger (b = 0.145; OR = 1.156; p = 0.049); age (b = −0.014: OR = 0.986; p < 0.001); DSM substance abuse (b = −0.209; OR = 0.811; p = 0.021). A positive b-coefficient means that an increase in the concerned covariate increases the probability of belonging to the WAU group; a negative b-coefficient means that an increase in the concerned covariate increases the probability of belonging to the NAU group. In the context of this analysis, the OR values can be interpreted as effect-size statistics. For example, for the experienced social problems due to problematic smartphone use covariate, which has an OR of 1.402, for each unit increase in participants’ experienced social problems due to problematic smartphone use score, the odds of belonging to the WAU group is 40% greater, after controlling for other predictors.
The second part of the table (bottom) represents comparisons between NAU and AAU latent classes. In this part, the covariates significantly associated with the latent classes are: Covid-19 impact on smartphone daily use duration (b = 0.321; OR = 1.378; p < 0.001); experienced social problems due to problematic smartphone use (b = 0.531; OR = 1.701; p < 0.001); DSM mania (b = 0.238; OR = 1.269; p = 0.022); DSM anxiety (b = 0.115; OR = 1.239; p = 0.044); age (b = −0.038; OR = 0.963; p < 0.001); sex (b = 0.357; OR = 1.429; p = 0.022) (this means female participants are significantly more likely to belong to the AAU latent class); diagnosed mental health condition (in the 12 months preceding the study) (b = 1.053; OR = 2.865; p < 0.001).
Discussion
Using apps against apps
In total, 13% of participants reported a smartphone “addiction.” Interestingly, the same percentage reported having downloaded an app to limit or control smartphone use. In contrast, only 1% reported having sought professional help to reduce smartphone use, and only 2% to deal with social problems from problematic smartphone use. These findings suggest that individuals who are negatively impacted by smartphone use are opting to bypass traditional care via psychotherapy or psychopharmacology, relying instead on their smartphones. This would be in concordance with other studies and theories related to the potential for smartphone apps in addressing addictive smartphone use33,34 and is consistent with the move to use “apps to wean us off apps,” 21 and can be considered another manifestation of how central digital platforms have become to the treatment provision landscape, including when it comes to problems that digital platforms themselves may have created. The telepsychiatry revolution, already unfolding pre-COVID-19 pandemic and greatly aided by the pandemic-related shift to remote delivery, 35 can now be seen to encompass problematic smartphone/internet use and internet gaming disorder as target diagnoses. There are other potential reasons for the relatively heavy reliance on apps: A downloadable app can be seen as a relatively easy solution given the structural barriers complicating access to traditional treatment, including availability of relevantly trained providers, affordability, time constraints, and other attitudinal factors. 36 The literature suggests real limits to how much benefit can be drawn from standalone interventions, however, including due to app engagement issues. As such, evidence-based studies indicate the need for professional accompaniment for durable effectiveness,37–41 making blended treatment and stepped-care models (combining app and human clinical support) reasonable recommendations, including for technology-related health issues.42,43
The popularity of mental health and wellbeing apps
A rather moderate proportion—almost half (44%)—of participants reported using a smartphone mental health or wellbeing app in the 12 months preceding the study. Their reported goals were to diagnose (15%) or treat (13%) mental health conditions or to enhance wellbeing (16%). The present study findings on prevalence of use are consistent with previous studies that indicated low-to-moderate adoption.12,16,17 The fact that females and younger adults (19–35 years) were statistically more likely to be part of this group than males, adults (36–60 years), and older adults (61–76 years), is also consistent with other studies, 44 and has been explained as a function of the high levels of interaction by this group with lifestyle apps and social media. 44 It is also consistent with the comparative reluctance by males to disclose, and seek treatment for, mental health problems, as widely reported.45,46
Latent classes of SAMHW users
While latent class analysis suggests that about two-thirds of participants had a high probability for using the relevant smartphone apps, the group of participants with high probability for using them to improve wellbeing (43%) was more than double the size of that with high probability for using them for mental health problems (18%). One explanation may lie in the fact that wellbeing is a broader concept that encompasses physical and mental health. Another explanation may be the desire to avoid the stigma still attached to psychiatric diagnoses such as major depressive disorder that would require “treatment,” and an easier time acknowledging the need to improve overall “wellbeing” through more “normalized” interventions such as “yoga” and “mindfulness.” Younger adults and adults were statistically more likely to belong to the first group compared to older adults, while females and younger adults were statistically more likely to belong to the second group compared to males, adults, and older adults. This is unsurprising given that females and younger individuals are more likely to interact with social media and digital interfaces, and, therefore, may have fewer psychological and proficiency barriers when it comes to using them to address health problems.
Predictors and relationships with participants categories
According to the machine learning model, the two most important predictors for using the relevant smartphone apps were variables associated with smartphone problematic use and COVID-19 impact. This suggests that pandemic-related stress (e.g. confinement, threatened health, professional and financial anxiety, etc.) and the sudden move to an even more heavily smartphone-dependent lifestyle may have contributed to an increase in mental health symptoms, smartphone use, and openness to finding help online, since almost all else was being pursed remotely. 47 Perhaps predictably, among the remaining important predictors, the large majority was linked to mental health problems (e.g. DSM anxiety, DSM anger, DSM depression, DSM memory, and DSM repetitive thoughts behaviors) and smartphone “addiction.” The level of insight into mental health symptoms could have influenced the desire to use the relevant apps in our study.
As for latent class covariates, individuals with high values or scores on age and DSM substance use disorder covariates were statistically more likely to belong to the NAU category of participants than the two other categories. As previously noted, older adults are less likely to interact with non-utilitarian mobile technology, perhaps due to technology knowhow barriers or being more accustomed to conventional ways.44,48 Also, several studies have shown strong evidence for comorbidity between mental health problems and substance use disorders, 49 suggesting a shared etiological origin or a causality relationship. For instance, it might be that some individuals experiencing mental health problems gravitate to substance use for coping purposes instead of seeking treatment, including treatment via smartphone apps.
There was no clear pattern regarding use of mental health versus wellbeing apps. Participants with high scores on the COVID-19 impact, social problems from smartphone use, and DSM anger covariates were statistically more likely to belong to the WAU and the AAU categories than to the NAU one. Individuals with high scores on the DSM mania and DSM anxiety covariates, individuals diagnosed with a mental health condition, and females were statistically more likely to be part of the AAU category than the other two. Individuals with a high score on DSM anger were statistically more likely to belong to WAU category than the other two. It would make sense that individuals experiencing social problems and mental health problems, broadly defined, would be more likely to seek help, including through mobile wellbeing and mental health apps.
Limitations
The current study did not include several variables known to influence digital literacy and that might impact the use of smartphone wellbeing and mental health apps50,51 and this represents a limitation in terms of results interpretability. App language was also not covered, representing another limitation.
Also, the sample representativeness was based only on age, sex, and ethnicity. Furthermore, information regarding the participants’ education level, socioeconomic classifications, and geographic location was not available. That these details were not covered in our survey represents a limitation in terms of the interpretability and generalizability of our results. However, it is important to note that previous studies reported high-quality sample representativeness using the Prolific crowdsourcing platform, in comparison to probabilistic survey conducted by the Pew Research Center for questions about user perceptions and experiences.52,53
A further limitation is linked to the fact that 95(29%) participants who downloaded apps to limit smartphone use reported using “other apps” not queried about in the survey. In the absence of any comprehensive scholarly survey of this new field, the list of smartphone apps to limit smartphone use that were included in the study was based on media and app-company reports of new or popular apps at the time the study was conceived. In this fast-moving field, it is possible that new apps had come to light by the time the study was conducted. It is also possible that respondents were using other apps (e.g. news or wellbeing apps) as “healthier” options to replace or limit the use of more problematic ones. A more exhaustive list of apps to limit smartphone use might have led to a better understanding of participants’ behavior regarding their smartphone use control.
Conclusion
Findings from the present study confirm that the use of SAMHW is growing, particularly among younger adults and females who are negatively impacted by smartphone problematic use or COVID-19, or who might be experiencing psychological problems. The range of “symptoms” users appear to be targeting through their smartphones is broad and includes problems related to the smartphone itself. These individuals tend to bypass traditional care via psychotherapy or psychopharmacology, relying instead on smartphones to address mental health conditions or improve wellbeing. However, as studies on effectiveness of SAMHW recommend coupling these digital tools with professional help,37–39 it would make sense to ensure that these apps advise their users to seek professional help in parallel with using them or if they do not experience improvement in wellbeing or mental health. More studies are required to explore the efficacy and safety of standalone apps as a potentially important component of mobile telepsychiatry; their differential uptake across age, sex, and other demographics; the role of stigma in their adoption; and the possibility of enhancing efficacy through hybrid models.
Footnotes
Abbreviations
Acknowledgments
The authors wish to acknowledge the Prolific team for their help in conducting the survey.
Contributorship
EA and YK were involved in initial conception of the study. EA, YK, LR, FBB, RC, and RK were involved in conception of the survey and writing of the questions. RC, RK, FBB, and YK were involved in recruitment procedure and GVC in data analysis. EA, GVC, and YK prepared the first draft and all the authors gave the final draft.
Declaration of Conflicting Interests
The author(s) declared no potential conflicts of interest with respect to the research, authorship, and/or publication of this article.
Funding
The author(s) received no financial support for the research, authorship, and/or publication of this article.
Ethics approval and consent to participate
Participants gave digital informed consent for their survey contribution. Participation was voluntary and restricted to those aged ≥18 years. All data was anonymously collected. The survey was conducted in accordance with the Swiss Human Research Act. 14
Availability of data and materials
Guarantor
YK.