
Abstract
Background
Community-acquired pneumonia is one of the most common infectious diseases in children and is a leading cause of death among children under 5 years of age, resulting in high rates of antibiotic usage and hospitalization. It is of extremely practical significance to make full use of the existing electronic medical records to study pneumonia and to establish automatic diagnosis models for pneumonia.
Methods
We established pneumonia diagnosis models of Bayesian network using a total of 13,448 electronic medical records. We investigated learning network structure and parameter estimation and evaluated different structure learning strategies and various modeling methods. By identifying the key predictors of model, the pneumonia status was analyzed.
Results
The performance of the proposed Bayesian network was evaluated using a set of 3361 cases with a precision of 0.7861, a recall of 0.9889, and an F1-score of 0.8759. On an independent external validation set containing 4925 cases, Bayesian network achieved a precision of 0.7382, a recall of 0.9947, and an F1-score of 0.8475. Our proposed Bayesian network outperformed all other methods, including CatBoost, XGBoost, LightGBM, logistic regression, and ridge classification.
Conclusion
The appropriate feature selection improved the performance of Bayesian networks. The proposed Bayesian network had good generalizability and could be directly applied to clinical research centers. And the key predictors identified by the network demonstrated good clinical interpretability, allowing for a better understanding of pneumonia status and complications. This study had important clinical value and practical significance for the research and diagnosis of pediatric pneumonia.
Keywords
Introduction
Community-acquired pneumonia (CAP), defined as pneumonia acquired outside of a hospital or health care setting, is a common infectious disease and a leading cause of death among children under 5 years of age, resulting in high rates of antibiotic use and hospitalization.1,2 The annual incidence of CAP requiring hospitalization was 15.7 per 10,000 children, with the highest incidence in children under 2 years of age in the United States. 3 Pneumonia also imposes a heavy economic burden on both developed and developing countries. In the United Kingdom, potential direct medical costs for children aged 0 to 16 years hospitalized with CAP range from £12 to £18000 per year. 4 Current management strategies remain suboptimal, in part due to insufficient technology to determine etiology, triage patients, and predict their outcomes. 5
With recent advances in machine learning technology, machine learning models have been increasingly applied to the analysis of large-scale electronic medical record (EMR) data, helping to learn effective patterns, discover knowledge, and build disease diagnosis models from the data. Prosperi et al. 6 used logistic regression, random forests, and AdaBoost to identify asthma, wheezing, and eczema. Sun et al. 7 developed pneumonia prediction models using classification and regression trees, and analyzed that older age, comorbidities, and initial presentation of lower respiratory tract infections were the main predictors of pneumonia. Giang et al. 8 attempted to build a model to predict ventilator-associated pneumonia from EMR data. Yu et al. 9 evaluated a range of machine learning methods on a dataset of 16 features from EMR, with the CatBoost model achieving the best performance. Existing methods have achieved excellent prediction ability and can well express the relationship between input and output variables, but they fail to take into consideration the underlying relationship between input variables. 10 In certain clinical scenarios, the ability to capture inherent intrinsic relationships between input variables has a far greater clinical value for disease analysis. 11
Bayesian network modeling has attracted considerable attention in medical diagnosis due to its ability to establish probabilistic relationships between diseases and their associated symptoms.12,13 Zhao et al. 14 proposed a hybrid neuro-probabilistic reasoning algorithm that integrated Bayesian networks with graph convolutional networks to discriminate benign and malignant pulmonary nodules in computed tomography images. Spyroglou et al. 15 evaluated the performance of a Bayesian network classifier in predicting asthma exacerbations based on multiple patient parameters, including objective measurements and medical history data. Sanders and Aronsky 16 also developed and evaluated a Bayesian network to identify patients who met asthma care guidelines using only electronically provided data at patient triage.
In this study, we established a Bayesian network pneumonia diagnosis model based on EMR data. The application of feature selection based on odds ratio (OR) values proved that the classification performance of Bayesian networks is as good as that of popular machine learning algorithms. In addition, the key predictors identified by the network demonstrated good interpretability, allowing a better understanding of pneumonia status and complications. Through independent external validation, we demonstrated that our proposed Bayesian network has good generalizability and can be directly applied to EMRs in clinical research centers. In summary, this study had incredibly important clinical value and practical significance for the research in the field of pediatric pneumonia and the rapid automated diagnosis of pneumonia.
Materials and methods
Data collection and preparation
In this study, we retrospectively collected EMRs of 33,571 consecutive patients with a mean age of 3.81 (standard deviation (SD) = 2.41) admitted to the Department of Pulmonology, Children's Hospital of Zhejiang University School of Medicine, China from 2012 to 2020, as an internal dataset for model training and validation. EMRs consisted of the first course records, admission records, discharge records, etc. Among them, the discharge diagnosis recorded the patient's final confirmed diseases, and the text in the first course records and admission records, such as the history of present illness, physical examination, and auxiliary examination, recorded the details of the clinician's inquiry and observation of the patients’ statuses. We constructed an experimental dataset using texts from these domains. Specifically, the information of history of present illness, physical examination, and auxiliary examination were taken as feature corpus X, and the information of discharge diagnosis was taken as target y. Notably, statistics showed that the vast majority of patients had more than one diagnosed disease due to complications. Table 1 provides a sample English translation to illustrate the EMR types and corresponding fields used in our study.
An example of the texts in four fields from raw EMRs in English translation.

Note: The italic
Independent external validation data
In addition, we also collected EMR data of 6573 patients with a mean age of 2.27 years (SD = 2.16) from the Department of Pulmonary Medicine, Zhengzhou Children’s Hospital, China, as an independent external validation dataset to evaluate the clinical generalization performance of the proposed Bayesian network.
Tabular dataset building
The texts of history of present illness, physical examination, and auxiliary examination of each patient were concatenated as characteristic corpus records. First, HanLP,
17
an open-source multilingual language processing toolkit, was used to automatically split each corpus record into a series of keywords through an entropy-based key phrase extraction method. Considering Chinese grammatical expressions, key phrases were defined in 2-gram and 3-gram forms. After filtering phrases based on the stopword list, 53,719 key phrases remained. Among them, the top 500 key phrases with the highest frequency accounted for 68.43% of the total frequency (approximately within the range of
Inspired by NegEx, 18 58 regular expressions were adopted to find the positive and negative scopes of 47 designated terms in each corpus record, respectively. An example of a common negative mention pattern follows the structure of “(no | not | there is no) key phrase (not seen | not found).” Using regular expressions, we were able to determine the exact value of each term in each record, including positive mentions (1), negative mentions (0), and no mentions (0). According to whether pneumonia was recorded at the time of discharge diagnosis, cases of pneumonia were defined as positive samples (1) and cases without pneumonia were defined as negative samples (0). All of which were binary terms that should be coded as either positive (1) or negative (0), that is, bi-values are not allowed.
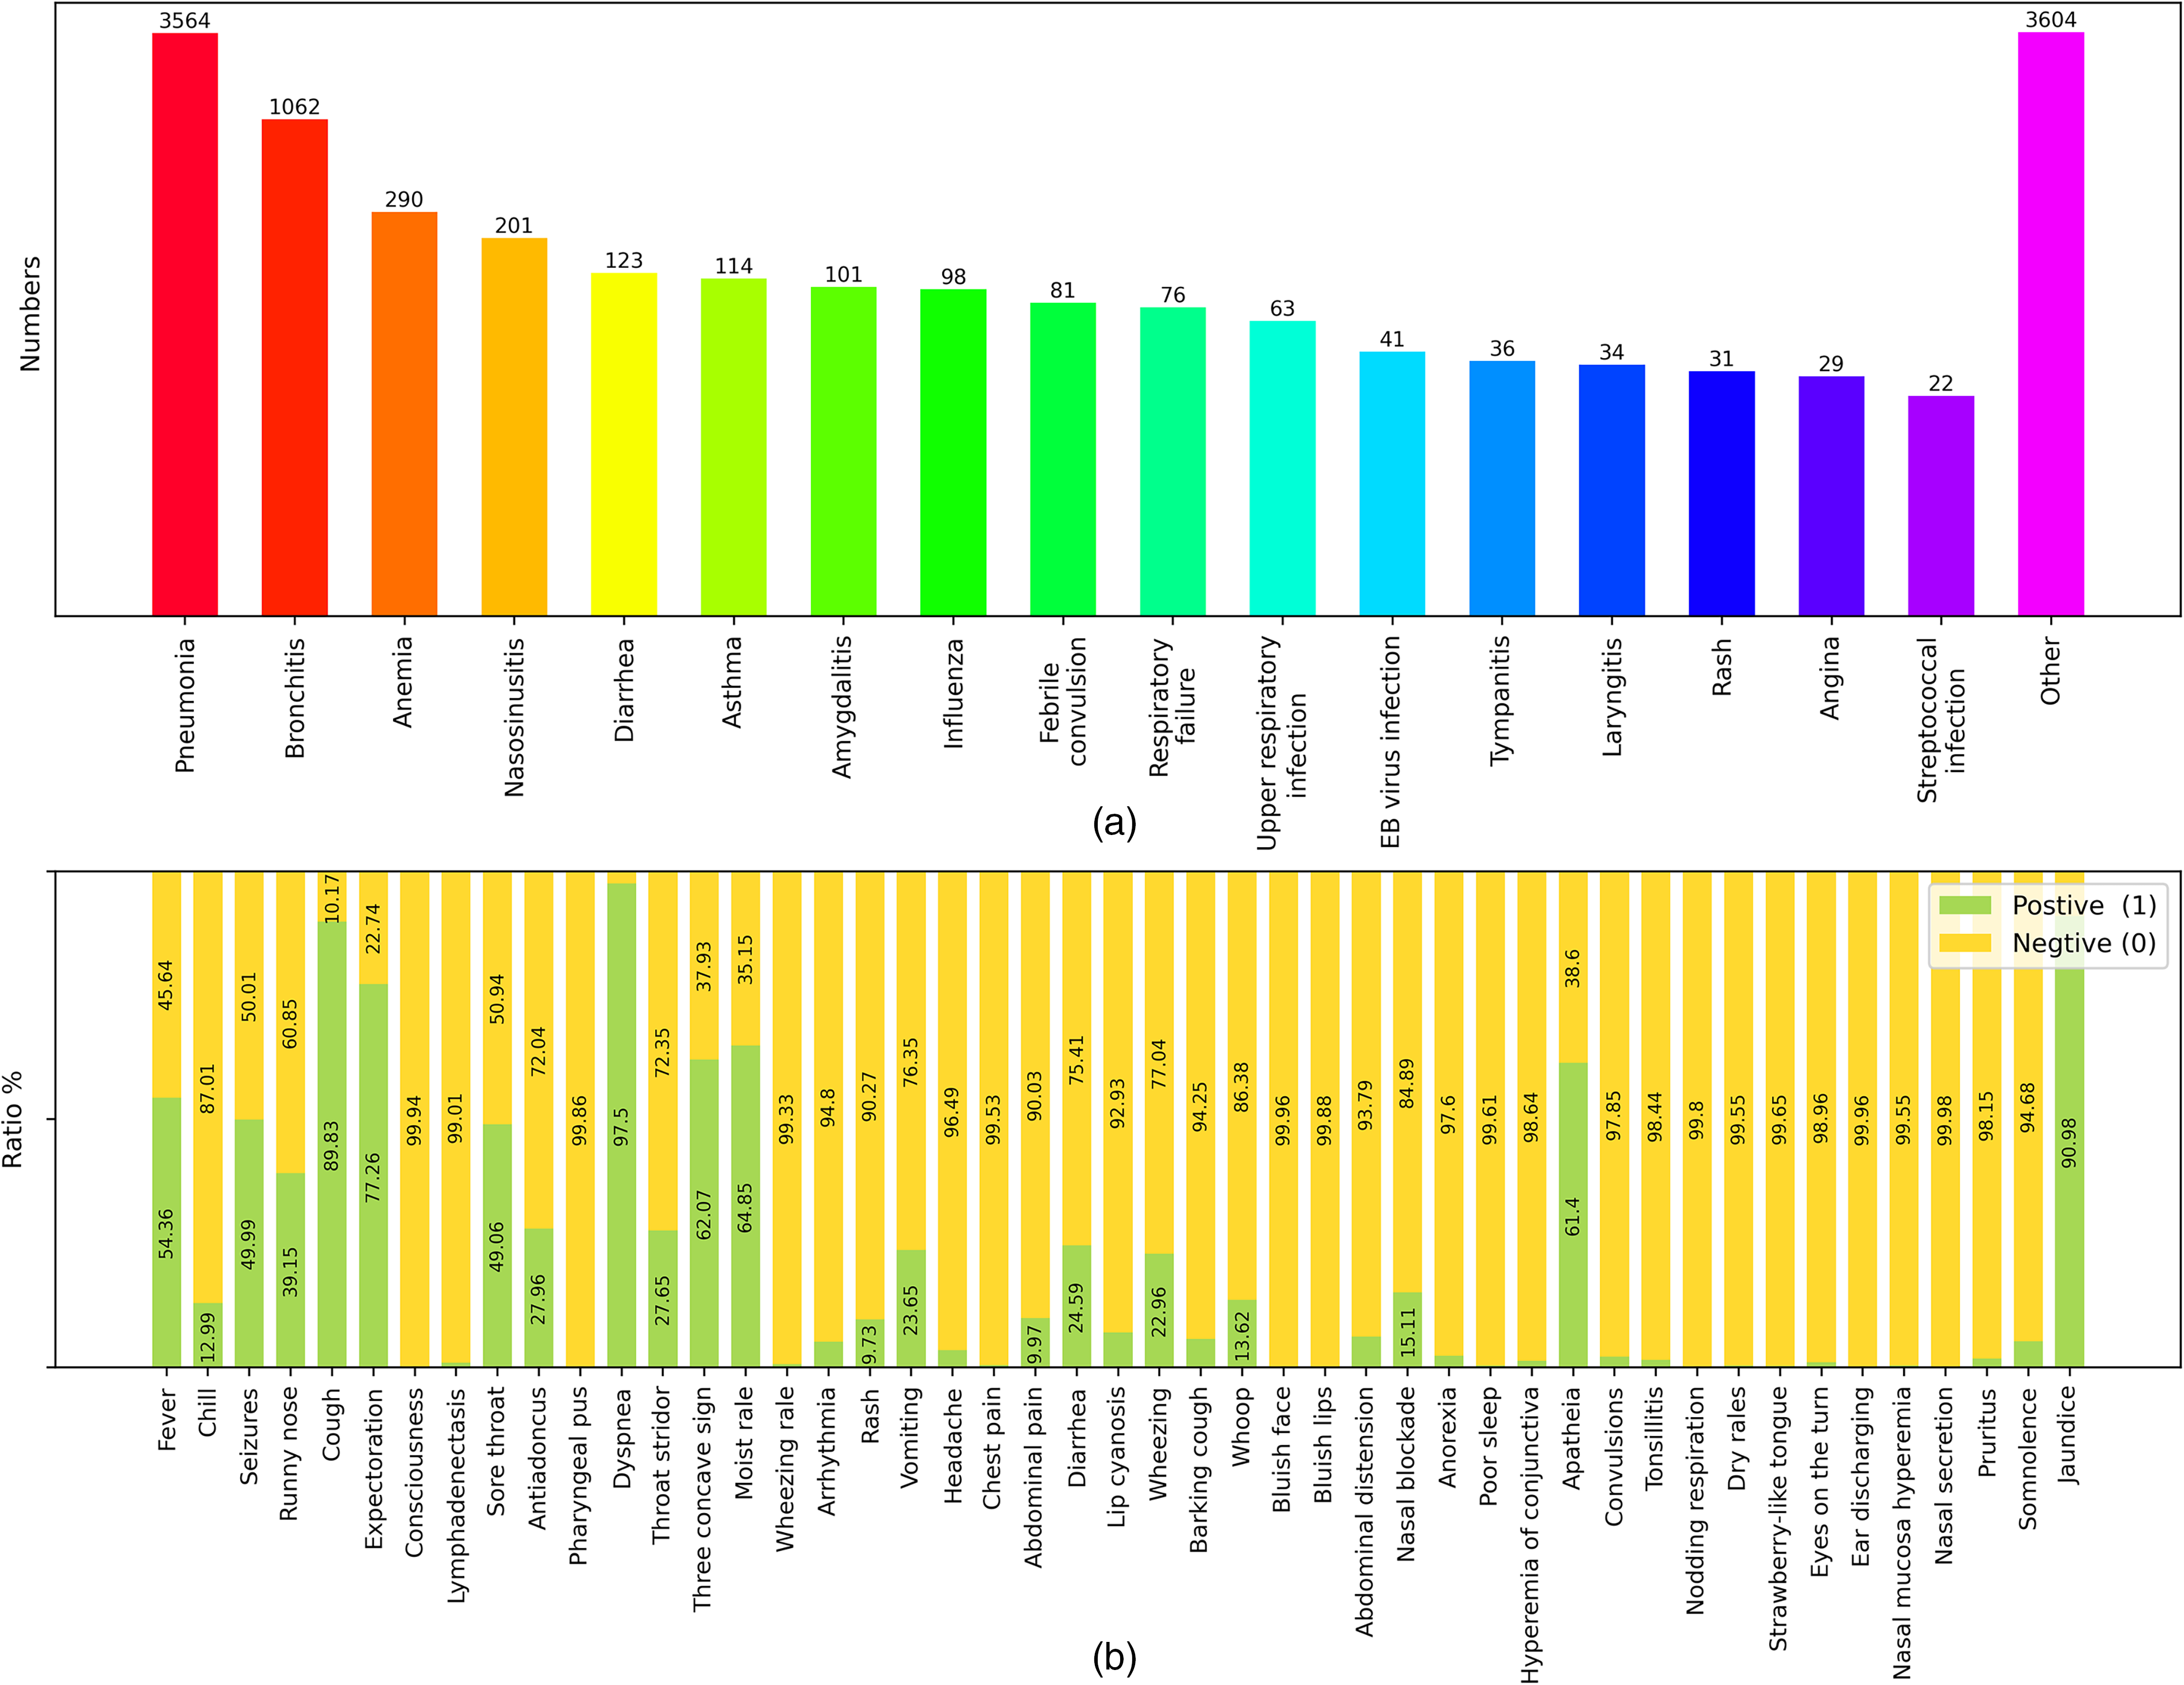
Finally, a tabular dataset named DataSet-PT was generated from the internal dataset containing 47 features and 1 target. By eliminating duplicate data, a total of 16,809 case records were retained, including 11,640 cases of pneumonia, accounting for 69.25% of the total, and 5169 cases of non-pneumonia, accounting for 30.75% of the total. Figure 1 illustrates the detailed statistics of DataSet-PT, in which Figure 1(a) shows the distribution of diseases included in the discharge diagnosis field, Figure 1(b) presents the proportion of pneumonia cases and non-pneumonia cases, and Figure 1(c) illustrates the feature distribution. Using random shuffling, DataSet-PT were further split into a training set TrainSet-PT for modeling and an internal validation set TestSet-PT for performance evaluation at a ratio of 4:1, that is, 13,448 cases in TrainSet-PT and 3361 cases in TestSet-PT.

Data distribution. (a) Pie chart of disease distribution contained in the discharge diagnosis text in the electronic medical records (EMRs). There were 35 types of diseases with pneumonia being the most diagnosed disease. (b) Proportion pie chart of pneumonia cases and non-pneumonia cases in the DataSet-PT after removing duplicate records. (c) Feature distributions in the DataSet-PT. The total amount for each feature was 16,809.
For the independent external validation dataset, a tabular dataset named ExternalSet-PT was obtained following the same pipeline, retaining 4925 case records, including 3564 pneumonia cases (72.37% of the total) and 1361 non-pneumonia cases (27.63% of the total). The data distribution of ExternalSet-PT is shown in Figure 2, where Figure 2(a) and (b) present the disease and feature distributions, respectively.
Distribution of independent external validation data. (a) Bar chart of the disease contained in external electronic medical records. There were 17 diseases and others. Some cases had more than one disease. (b) Feature distribution in ExternalSet-PT. The total for each feature was 4925.
Bayesian network modeling
A Bayesian network denoted by
Structure construction
Feature correlation. Inspired by previous works,20,21 we used the OR values to measure the correlation between features, where an OR value is a measure of the association between exposure and outcome. The OR value between feature 
Features selection. Given that the purpose of our Bayesian network modeling was to predict the occurrence of pneumonia, it was necessary to determine whether a feature node should be connected to the target pneumonia node. It was also meaningful to distinguish nodes that had direct or indirect connections to the pneumonia node. This process was considered as a feature selection process, resulting in two sets of features, among which the feature set containing only directly connected nodes was named as Fine-Features and the feature set containing all features including both directly and indirectly connected nodes were named as All-Features.
Network structure search. The DAG was constructed using a heuristic, asymptotic, greedy, hill climbing algorithm. In the step of adding each node, three operations (namely, adding edges, subtracting edges, and reversing edges) were performed to reduce the score of the entire network structure, where K2 score 22 was used to measure the structure score.
Initial graph. In greedy search, the initial graph is an important factor. 23 We used two initial graph configurations, including a configuration without an initial graph and a configuration with an initial graph generated based on OR values.
Ranking strategy. The order in which nodes are added is also an important factor in greedy search. We applied four ranking strategies 21 : (1) Random, (2) Global impact, (3) Descending, and (4) Ascending.
Figure 3 shows the resulting Bayesian network architectures, where Figure 3(a) demonstrates an undirected graph with 478 edges, while Figure 3(b) and (c) shows the Bayesian network structure based on All-Features and Fine-Features, respectively. The feature correlation heatmap based on the OR value was shown in Figure 4a, where each point represented the logarithm of the OR value between the features on the x-axis and y-axis. Clearly, points with a value >0 (i.e. colors close to the red band) represented a strong correlation between the two features, while points with a value < 0 (i.e. colors close to the blue band) indicated a weaker correlation between the two features.

Bayesian network architecture. (a) Undirected graph generated based on odds ratio values. Colored circles represent specific nodes in the network. The lines between the circles represent the connections of the nodes. The red dashed lines are the connections associated with the pneumonia node, and the gray lines are the connections not associated with the pneumonia node. (b) Bayesian network generated from the All-Features set. The red dashed line represents the parent node of pneumonia, while the green dashed line represents the child node of pneumonia. Gray lines indicate relationships that are not directly related to the pneumonia node. Arrows on the lines indicate causal relationships between nodes. (b) Bayesian network generated from the Fine-Features set.
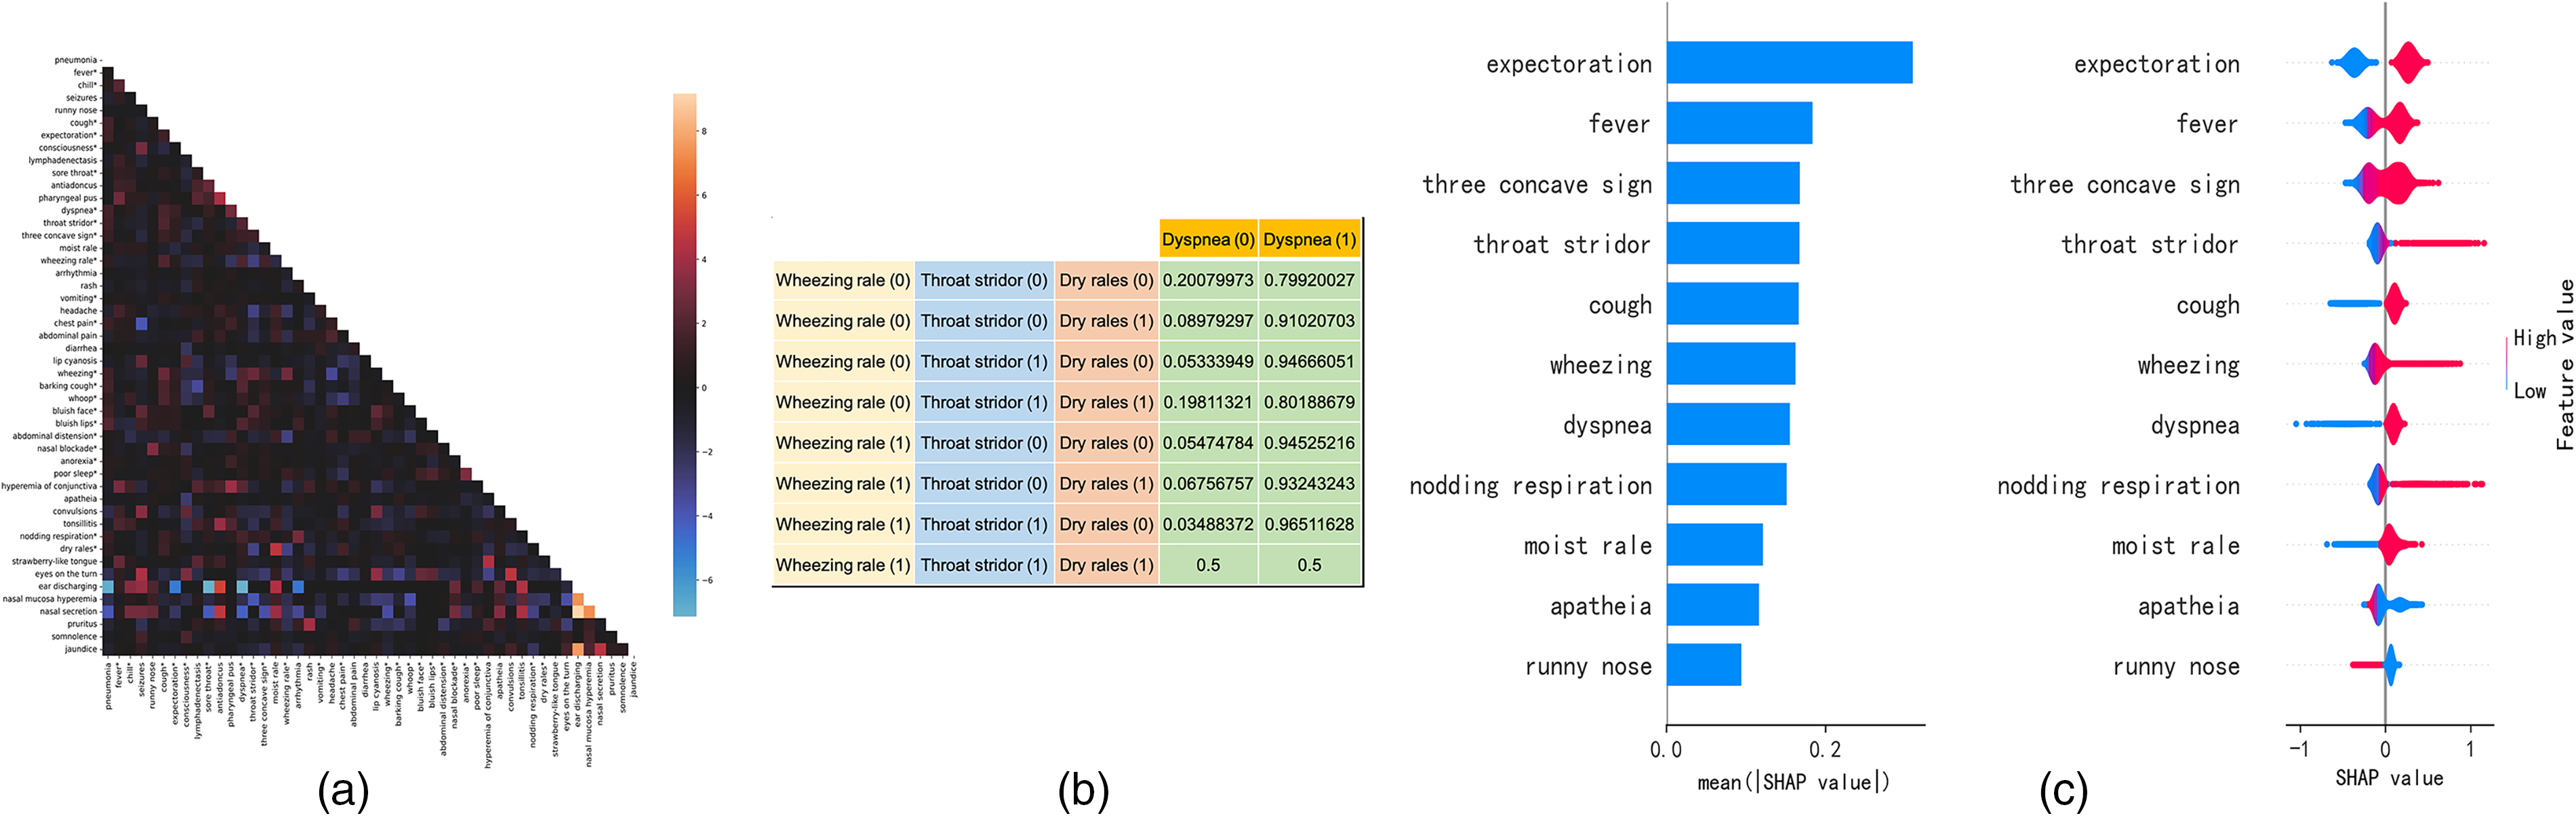
Feature analysis. (a) Heatmap of correlations between features. Each point represents the logarithm of the OR value between the feature on the x-axis and y-axis. Clearly, points with a value >0 (i.e. colors close to the red band) represent a strong correlation between the two features. Points with a value <0 (i.e. colors close to the blue band) indicate a weaker correlation between the two features. Features marked with * are closely correlated with pneumonia. (b) An example of a CPT of the dyspnea node from Bayesian network using Fine-Features. For inference, the probability of dyspnea
Parameter estimation and model inference
In the parameter estimation stage, we used a Bayesian estimator to estimate the CPT of each node. Bayesian–Dirichlet equivalence consistent prior was applied to compute an initial CPT for each node. Starting with the initial CPT, we updated each CPT using state counts from observations of TrainSet-PT. In the inference stage, the input to the Bayesian network is usually in the form of a series of observed evidence. Specifically, predicting the likelihood of pneumonia using All-Features is equivalent to computing the posterior probability of the Bayesian network
Figure 4(b) illustrates an example of CPT of the dyspnea node in the Bayesian network using Fine-Features. The Bayesian network can also be viewed as a joint probability distribution
Other modeling approaches
We applied five other machine learning models, namely CatBoost, XGBoost, LightGBM, logistic regression, and the ridge classifier24–27 for performance comparison. A grid search strategy was used to determine model hyper-parameters. For CatBoost, the number of iteration was 2000, the learning rate was 0.01, the max depth was 7, and the objective was binary log loss. For XGBoost, the number of estimators was 2000, the learning rate was 0.005, the max depth was 7 and the objective was binary log loss. For LightGBM, the number of estimators was 2000, the learning rate was 0.01, the max depth was 10, the max number of leaves was 50, and the objective was binary log loss. For logistic regression, the penalty was the L2 distance, the max iteration was 1000, and solver was L-BFGS. For the ridge classifier, the alpha was 0.5, the tolerance was 1×10⁻³, and the solver adopted L-BFGS.
Results
Performance evaluation metrics
In this study, three metrics, including precision, recall, and F1-score, were used to evaluate the performance, and defined as follows:

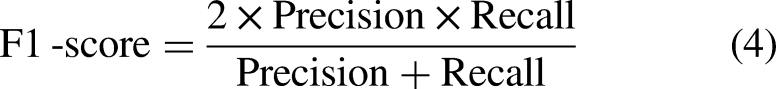
where TP, FP, TN, and FN are the true positive, false positive, true negative, and false negative rates, respectively. TP and TN denote correctly predicted positives and negatives with respect to the ground truth labels. FP and FN represent incorrectly predicted positives and negatives with respect to the ground truth labels. Statistical analysis of model performance was based on bootstrap and t-test.
Statistical analysis
Statistical t-test analysis between the pneumonia-positive and pneumonia-negative groups was analyzed. As shown in Table 2, most features showed statistically significant differences *(p < 0.05) between the pneumonia-positive and pneumonia-negative groups. Specifically, 40 features showed statistically significant differences between positive and negative groups in TrainSet-PT, and 30 features showed statistically significant differences in TestSet-PT. Of these features, 30 features showed statistically significant differences in both the sets, which confirmed that the extracted features were indeed discriminative. There was no statistically significant difference between TrainSet-PT and TestSet-PT in all features (all p > 0.05), which was in line with common sense, indicating that the splitting of DataSet-PT was reasonable. In ExternalSet-PT, there were 25 features showed statistically significant differences between positive and negative groups. Most importantly, only seven features showed no statistically significant differences with TrainSet-PT, which indicated a large feature distribution difference between these two datasets.
Statistical characteristics of TrainSet-PT, TestSet-PT, and ExternalSet-PT.

Note: *: p < 0.05, showing a statistically significant difference.
Experimental results
Table 3 showed the performance of Bayesian network modeling. It is clear that models without initial graphs generally performed better than models with initial graphs. The Ascending strategy worked best on both feature sets, and the Global impact strategy achieved a better recall on All-Features. The best performances for precision, recall, and F1-score achieved with Bayesian networks were 0.7746, 0.9722, and 0.8344 with All-Features, and 0.7861, 0.9889, and 0.8759 with Fine-Features.
Performance of Bayesian networks modeling on TestSet-PT.

Note: The numbers in bold are the best performance of models using different features in three metrics. w/ : with; w/o: without.
Table 4 demonstrated the performance comparison of different modeling approaches on TestSet-PT. Using All-Features, the CatBoost achieved the best precision and F1-score with 0.7852 and 0.8471, and the XGBoost and ridge classifier achieved the best recall of 0.9243. The Bayesian network, which without initial graph and using Ascending ranking strategy, outperformed other models, with the highest precision (0.7861), highest recall (0.9889), and the highest F1-score (0.8759) using Fine-Features. The metrics of other modeling approaches were shown significant differences with the performance of Bayesian network when Fine-Features was used.
Performance comparison on TestSet-PT.

Note: The numbers in bold are the best performance of models using different features in three metrics. *: p < 0.05, showing a statistically significant difference.
Table 5 demonstrated the performance comparison of different modeling methods on ExternalSet-PT. The ridge classifier achieved the best recall and F1-score with 0.9837 and 0.8382, respectively, while the logistic regression achieved the best precision of 0.7459 with All-Features. The Bayesian network outperformed other models with the highest precision (0.7382), highest recall (0.9947), and the highest F1-score (0.8475) using Fine-Features. The metrics of other modeling approaches were shown significant differences with the performance of Bayesian network.
Performance comparison on externalSet-PT.

Note: The numbers in bold are the best performance of models using different features in three metrics. *: p < 0.05, showing a statistically significant difference.
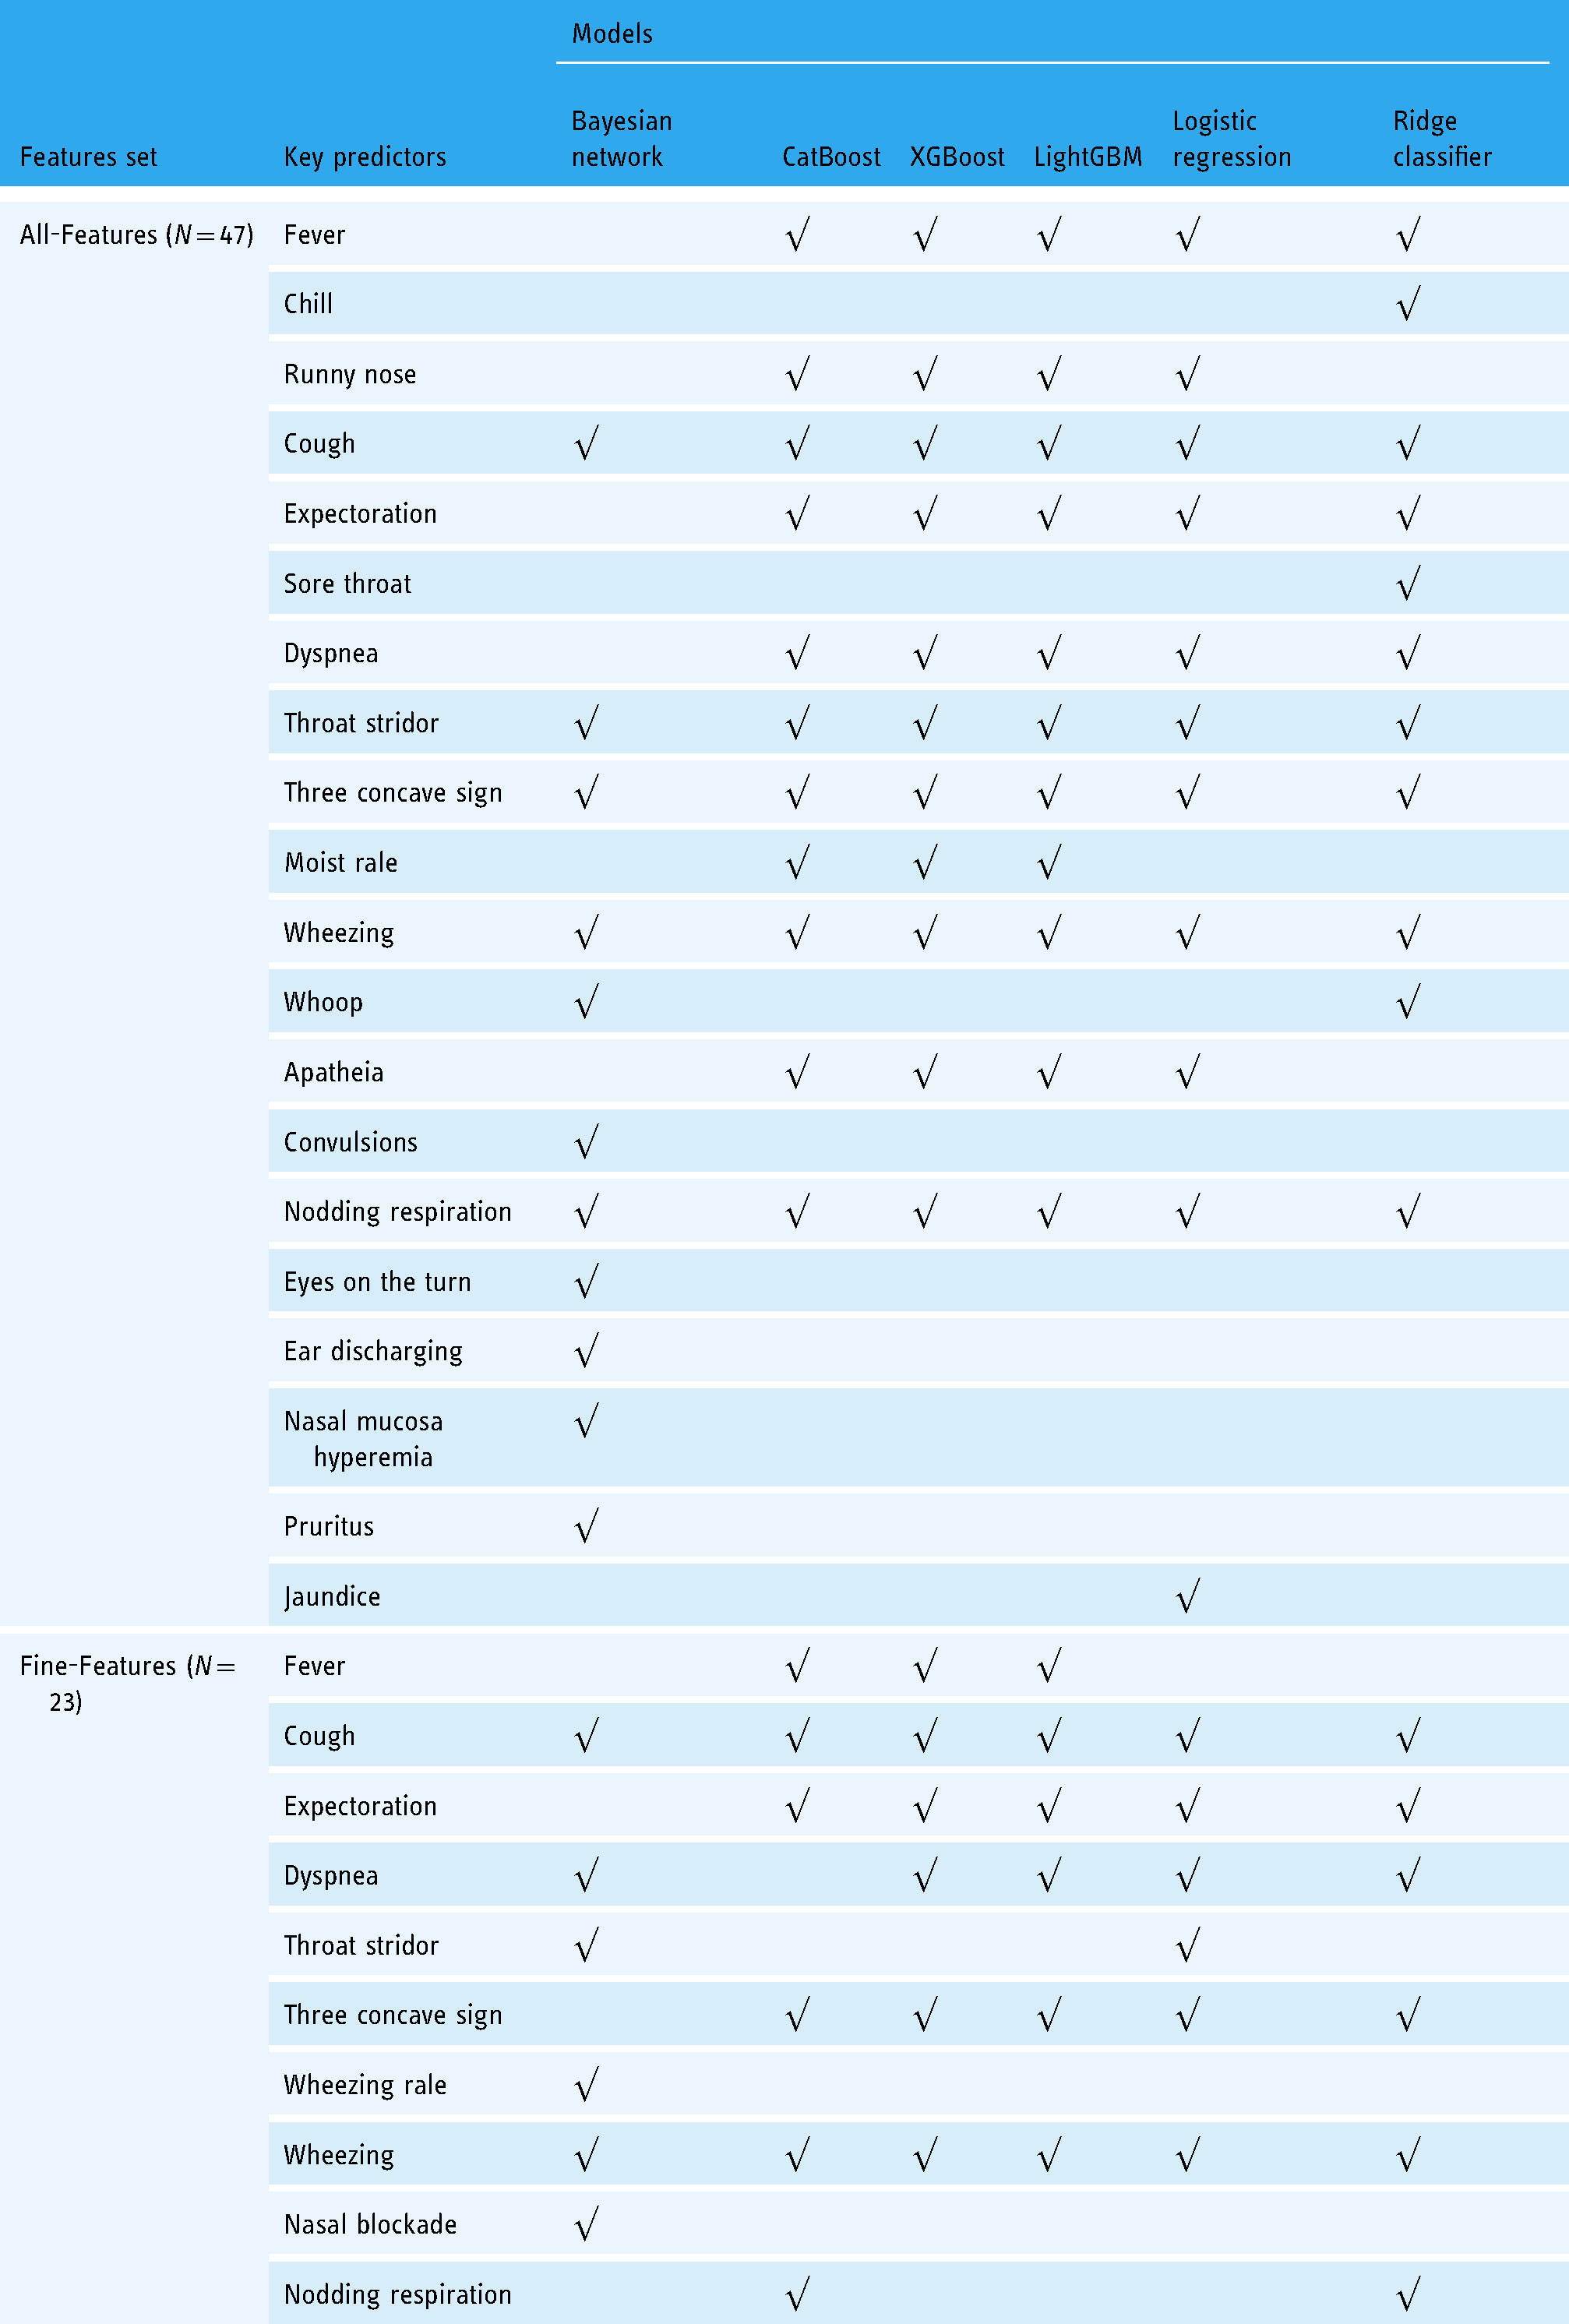
Table 6 illustrated the key predictors found by different models. For ease of comparison, we sorted the features of other models according to SHAP (sHapley Additive exPlanations) 28 values, taking the same number of features as the parent nodes of the pneumonia node, which were 11 and 6 features from All-Features and Fine-Features, respectively. Features were also ranked using SHAP to discover explanatory predictors for model interpretation as shown in Figure 4(c).
Results of the key predictors discovery.
Discussion
Implications and findings
Our results revealed that feature selection based on OR values improved the performance of Bayesian networks (F1-score of 0.8759 vs. 0.8344 as shown in Table 3). However, feature selection did not show the same advantages in other methods. For example, the performance of CatBoost decreased slightly (F1-score of 0.8471 vs. 0.8351 as shown in Table 4). One possible reason is that linear models and additive tree models treat variables and outputs as directly related, which is easier than Bayesian networks to eliminate the influence of noncritical variables, so they performed roughly the same on both feature sets. However, feature selection based on OR value does reduce the search space of Bayesian network. Therefore, the selected variables have greater mutual information with the pneumonia node.
In this study, we also found that in the absence of the initial graph, the Bayesian network model outperformed models built with the initial graph. We believe this is due to redundant edges in the initial graph misleading the optimizer into local optima since the heuristic hill-climbing algorithm is very sensitive to the search starting point. The results shown in Table 3 also demonstrated that the effect ranking strategy roughly followed the following order, Ascending > Global impact > Descending ≈ Random. We argue that for hill climbing, the later the pneumonia node is added, the easier it is to traverse and optimize the edges connected to the pneumonia node in a global view. The clearer the dependency between the pneumonia node and other nodes, the better is the prediction effect. Global impact is not as effective as Ascending, probably because its original intention is to find a reasonable global network structure rather than infer-specific nodes.
As shown in Tables 2 and 5, although the characteristics of TrainSet-PT and ExternalSet-PT have significant statistical differences, the proposed Bayesian network still exhibited strong performance and outperformed all other models with Fine-Features. Table 5 demonstrated that our Bayesian network achieved good performance in EMRs from the independent external research center (F1-score of 0.8246 with All-Features and 0.8475 with Fine-Features). The impact of feature selection based on OR values on the external validation data was also significant, and the F1-score of the Bayesian network using Fine-Features was the highest.
Clinical significance of the identified key predictors
As shown in the All-Features rows of Table 6, all models considered cough, throat stridor, three concave sign, wheezing, and nodding respiration as significant predictors. The occurrence of pneumonia is accompanied by cough, so cough is very reliable as a key predictor of confirmed pneumonia. The throat stridor is a typical clinical manifestation of laryngeal obstruction. When this symptom occurs, it often indicates that the larynx has been narrowed due to infection. Laryngeal infections are often accompanied by lower respiratory tract infections. While throat stridor is not a typical symptom of pneumonia, throat infection often accompanies infections. This may reflect some characteristics of the cases in our data, that is, a large proportion of pneumonia cases also have symptoms of throat infection, and pneumonia is likely caused by aggravation of throat infection. The three-concave sign, also known as the intercostal retraction sign, appears in patients with severe pneumonia and is a common manifestation of severe pneumonia. It is therefore not surprising that the models found three concave signs to be strong predictors of a pneumonia diagnosis. Nodding respiration is also a typical symptom of severe pneumonia, and its presence is the diagnosis of pneumonia. Wheezing is a gasping sound during the exhalation phase. It is usually caused by the stenosis below the tracheal carina. It is a typical manifestation of lower respiratory tract infection with stenosis. Wheezing not only indicates lower airway infection, but also lower airway narrowing.
In the All-Features rows of Table 6, there were several predictors (i.e. convulsions, eyes on the turn, ear discharging, nasal mucosa hyperemia, and pruritus) selected by the Bayesian network only. Convulsions are not typical symptoms of pneumonia, but in children with pneumonia, repeated high fever may cause symptoms of systemic convulsions. Eyes on the turn is a typical symptom of febrile convulsion in children. Common causes of febrile convulsions include upper respiratory tract infection, tympanitis, and pneumonia. As shown in Figure 1(a), our data included at least 1073 children with febrile convulsions. The Bayesian network identified the eyes on the turn as a key predictor, probably because in our case most of the children with febrile convulsion also had pneumonia. Streptococcus pneumoniae frequently causes both tympanitis and pneumonia, which maybe the reason why ear discharge is considered a key predictor. This appears to indicate insufficient pneumococcal vaccination coverage in the region, in fact, where at least 202 children were diagnosed with tympanitis as shown in Figure 1(a). Nasal mucosa hyperemia often refers to upper respiratory tract infections, caused by rhinitis, nasosinusitis, and other diseases. It is not uncommon for upper respiratory tract infection to develop into pneumonia. Pruritus is a typical symptom of rash. Figure 1(a) showed that our data contained 194 rash cases. Symptoms of skin rash, which is not a typical symptom of pneumonia, have been reported in cases of coronavirus disease 2019 (COVID-19) at times. 29 The identification of pruritus as a key predictor by the Bayesian network may be caused by these atypical cases, which may also explain why dermatology patients are referred to respiratory departments. Rash was also a feature extracted from EMR in our dataset. However, it had a low OR value with pneumonia, likely due to rash, as a disease name, being rarely mentioned in descriptive text.
In the Fine-Features rows of Table 6, the consistency of the model predictors was not as strong as the All-Features row, while coughing and wheezing were still consistently identified as key predictors. The identification results of the tree models (CatBoost, XGBoost, and LightGBM) and linear models (logistic regression and ridge classifier) showed a high degree of agreement. Figure 3(c) showed that the child nodes of the pneumonia node were expectoration, moist rales, barking cough, fever, dyspnea and apathy, respectively. A comparison with the Fine-Features of Table 6 showed that these features were also key predictors for other models, except for barking cough. The difference is that other models treat these features as causes of pneumonia, while Bayesian networks treat them as effects of pneumonia. What they have in common is that they all revealed a correlation between these features and pneumonia.
Advantages and clinical significance of the Bayesian network
Currently, the first step in screening children with suspected CAP is a rapid assessment to identify signs and make a subjective diagnosis based on expert experience. Our proposed Bayesian network will provide automated, rapid, and objective assessment while reducing the workload of specialists. CAP in children often appears as a complication of diseases, such as pertussis and influenza, and the presence of multiple symptoms can make it difficult to identify. Our proposed Bayesian network provides a second opinion, increasing the number of accurate diagnostics and yielding additional new insights. The most significant advantage of Bayesian network modeling is that it is far easier to visually understand than other common classical methods.
Existing research suggests that linear or additive tree models may yield more accurate classifications as they only consider direct relationships between input and output variables. However, the variable relationship-capture capability of the Bayesian networks has greater value for data exploration. Interpretability of tree and linear models often depends on the SHAP interpreter and SHAP value ranking. The structure of the Bayesian network is far more intuitive and easier to interpret due to causal relationships between nodes. Furthermore, Bayesian network modeling reveals relationships between various symptoms and complications in addition to direct input–output connections, which is extremely valuable for common clinical applications and research.
Limitations and future expectations
Although our experiments on the external validation set demonstrated the generalizability of the model, more validation is necessary for extrapolating to more centers. One of the future objectives is to collect more data from different individual hospitals and conduct a multicenter study. As a feasibility study, this work only included hospital admission, inpatient, and discharge records. Additional information such as epidemiology, past history of respiratory diseases, and comorbidities should also be included for a complete and accurate diagnosis.
Furthermore, the use of the proposed method is limited by the scope of the specification written by EMR. This specification means following a pre-arranged structure and using a standard vocabulary. In practice, the method relies on a pre-built lookup table to identify and align nonstandard terms to designated terms, and uses regular expressions to extract the values of 47 or 23 features from the EMR (i.e. whether the term is mentioned). Hence, future directions should inevitably include additional regular expressions to accommodate the EMR of specific centers.
For clinical application, one of the purposes of rapid assessment is to diagnose pneumonia in children as mild or severe. This diagnostic difference has critical implications for the course of treatment. Mild cases only require a prescription, whereas severe cases require routine blood tests and lung X-rays. One of our future directions is to extend our model to the diagnosis of mild and severe pneumonia.
Additionally, while models built with Fine-Features performed better in predictions, models constructed with All-Features were more interpretable. Therefore, we believe that combining large networks with higher interpretability with small networks with higher classification accuracy is another promising future approach.
Conclusions
In this study, EMR data were used to construct a Bayesian network for pneumonia diagnosis. The application of feature selection based on OR values proved that the classification performance of the Bayesian networks matches the performance of commonly used machine learning algorithms. The performance on independent external validation data demonstrated the clinical generalizability of our Bayesian network. Analysis of the key predictors identified by the network further increases our understanding of the conditions and complications of pneumonia patients. The findings of this study have important clinical value and practical significance for the study of pediatric pneumonia in the field and the rapid and automated diagnosis of pneumonia.
Footnotes
Acknowledgments
The authors would like to thank the Children's Hospital, Zhejiang University School of Medicine and the Zhengzhou Children's Hospital for support in this research.
Contributorship
YiW, QS, XL, and YY were involved in conception and design of the study. GY, YY, JL, YL, and YiW were part of administrative support. JL, GY, and YW provided the study materials or patients. JL, FS, YuW, and SL were involved in collection and assembly of data; QS, ZX, XL, YY, and YiW contributed toward data analysis and interpretation. All the authors were involved in manuscript writing and final approval of the manuscript.
Declaration of Conflicting Interests
The authors declared no potential conflicts of interest with respect to the research, authorship, and/or publication of this article.
Ethical approval
The authors are accountable for all the aspects of the work in ensuring that questions related to the accuracy or integrity of any part of the work are appropriately investigated and resolved. The study approval was granted by The Institutional Review Board (IRB) of the Medical Ethics Committee of Children's Hospital, Zhejiang University School of Medicine, China (IRB approval ID: 2020-IRB-058). The procedures were performed in accordance with the Declaration of Helsinki (as revised in 2013) and relevant guidelines and regulations. Informed consent was obtained after the procedure was fully explained to all participants and their legal guardians.
Funding
The authors disclosed receipt of the following financial support for the research, authorship, and/or publication of this article: This study was supported in part by grants from the National Key Research & Development Program (grant number 2019YFE0126200), the National Natural Science Foundation of China (grant number 62076218), the Zhejiang Province Research Project of Public Welfare Technology Application (grant number LGF22H180004), and the Hong Kong Research Grants Council through General Research Fund (grant number 17207722).
Guarantor
GY