
Abstract
Objective
To identify the differences between circadian rhythm (CR) metrics characterized by different mobile sensors and computational methods.
Methods
We used smartphone tracking and daily survey data from 225 college student participants, applied four methods (survey construct automation, cosinor regression, non-parametric method, Fourier analysis) on two types of smartphone sensor data (GPS, accelerometer) to characterize CR. We explored the inter-relations among the extracted circadian metrics as well as between the circadian metrics and participants’ self-reported mood and sleep outcomes.
Results
Compared to GPS signals, smartphone accelerometer activity follows an intradaily distribution that starts earlier in the day, winds down later, reaches half cumulative activity about the same time, conforms less to a sinusoidal wave, and exhibits more intradaily fragmentation but higher CR strength and lower interdaily disruption. We found a notable negative correlation between intradaily variability and CR strength especially pronounced in GPS activity. Self-reported sleep and mood outcomes showed significant correlations with particular CR metrics.
Conclusions
We revealed significant inter-relations and discrepancies in the circadian metrics discovered from two smartphone sensors and four CR algorithms and their bearings on wellbeing indicators such as sleep quality and loneliness.
Introduction
Circadian Rhythm (CR) is defined as the periodic quality of an organism’s activity that follows a 24-hour cycle. Medical research has found that healthy individuals’ day-to-day life exhibits a strong circadian rhythm, whereas deviations from such a rhythm are often indicators of potential health issues 1 . Traditionally, circadian rhythm is assessed by questionnaires, such as the Morning-Eveningness Questionnaire (MEQ) 2 and the Munich Chronotype Questionnaire (MCTQ) 3 . These questionnaires are used to solicit respondents’ own recollection of their bed time and wake time. Another survey instrument, called the Social Rhythm Metric 4 , quantifies the circadian rhythm in other activities such as social interaction, attending school/work, and having dinner. The commonality between these surveys is their focus on the time in a day when a participant completes a certain number or proportion of certain types of activity.
With increasing amounts and varieties of sensor data available from daily life tracking devices such as smartphones, we are gaining unprecedented capability to evaluate circadian rhythm objectively and passively, requiring minimal efforts from the user. Multiple methods have been proposed for the purpose of CR characterization, using different sensor signals and different mathematical approaches. A straightforward approach is to automate the measurements of the constructs solicited in traditional CR surveys. As opposed to asking participants when a certain activity was performed in a day, we can instead find a digital marker in sensor signals that reflects the same event. For example, the first time in a day at which a person steps out of their home, while could be asked in a questionnaire, may be passively detected by their smartphone’s GPS sensor. In an analogous effort, Schoedel et al.
5
sought to passively detect participants’ sleep and wake schedule using smartphone usage events such as the action of snoozing, alarm settings, and the first and last time of smartphone usage during a day. The authors also recorded timestamps at which the participants completed 25%, 50%, and 75% of smartphone usage to track its progression throughout the day. We call this approach
Higher on the scale of analytical complexity is the cosinor method which was originally proposed in the 1960s
6
and continues to be improved upon
7
. Building on the assumption that a person’s daily rest-activity pattern follows a sinusoidal shape, the cosinor method aims to fit a trigonometric function to the magnitude of a body-worn sensor signal (e.g., wrist-worn actigraphy) and extract coefficients to serve as CR descriptors
8
. The method is interchangeably called trigonometric regression, harmonic regression, or
To free CR analysis from complying to a rather strict sinusoidal assumption,
Five non-parametric descriptors of circadian rhythm. In the formulae,
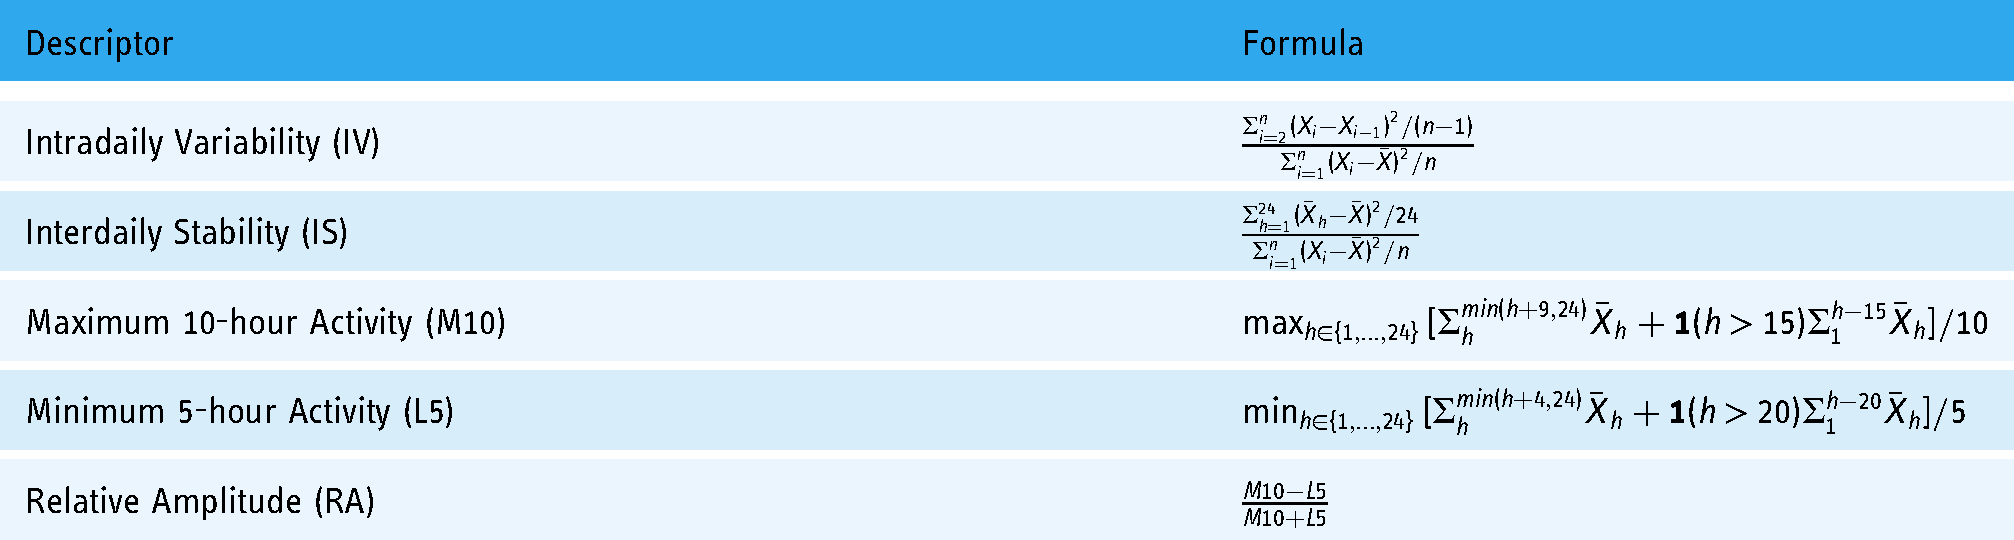
Other standalone studies exist that seek to quantify the notion of circadian pattern in unique ways. Abdullah et al. 14 used smartphone features such as distance traveled to predict CR scores obtained from the Social Rhythm Metric survey. Canzian et al. 15 proposed a “routine index” which quantifies the similarity between the geographic distribution of an individual’s smartphone-tracked location traces within a period of time during a day and that of the location traces within the same period of time during other days. Huckins et al. 16 also focused on the similarity concept and computed “circadian similarity” scores which are intra-class correlations between day-to-day variations in smartphone sensing features extracted over the same daily epochs (e.g., morning, afternoon). As opposed to using a trigonometric function to approximate for rest and activity, Huang et al. 17 used a Hidden Markov Model to infer latent activity states from participants’ accelerometer signal and computed cosinor-like circadian metrics based on the curve generated by latent state probabilities.
The methods outlined above produce different metrics that describe related, but distinct aspects of the circadian pattern. While these methods have been individually proposed and implemented with the sensing technology and sensor data of choice by the researcher, we find that evidence is limited in the extant literature that elucidates (1) the inter-relations between the circadian metrics extracted by different methods; (2) the relationship between the same circadian metric extracted from different types of mobile sensing data collected by companionship technology such as smartphones and smartwatches, and; (3) which data and method combinations produce metrics that are most correlated with personal wellbeing outcomes regarding mood and sleep.
We aim to address these limitations in this paper. We base our analyses on smartphone tracking data we collected from 1,584 college students (225 participants’ data were retained in the analyses after preprocessing) in a major public university in the United States over three weeks in the 2018-2019 school year 18 . We conduct CR analysis using the four main types of methods outlined above (survey construct automation, cosinor, non-parametric, Fourier) on two types of smartphone sensor signals (accelerometer, GPS), and compare the same metrics extracted from different sensor signals as well as compare different metrics extracted from the same sensor signal.
Research questions
We find that different circadian metrics produced by different computational methods may be characteristics of similar aspects of circadian rhythm. The first aspect is the
We list our research questions above. Through answering RQ1 and RQ2, we examine the intradaily temporal distribution and the circadian disruption aspects of CR based on data from smartphone accelerometer and GPS, two heavily utilized sensors in ubiquitous computing research19–21. We are interested in how CR manifests in the distinct yet related daily behavior captured by the two sensors: smartphone accelerometer data can reflect the user’s interaction with their phone and physical activity (while the phone is carried on person), whereas GPS data reflects the user’s location and mobility patterns. Magnitude can be straightforwardly calculated from accelerometer signals and is therefore used as their signal strength. GPS coordinates, on the other hand, do not straightforwardly lend to a signal magnitude measure, so we use displacement, computed by differencing the GPS trace, as the signal strength of GPS. We will not compare GPS and accelerometer based on their activity span aspect of CR because of their inherently different definitions and scales of amplitude. Next, we address RQ3 by investigating the inter-relations between different CR metrics extracted from both smartphone accelerometer and GPS data. Finally, with RQ4 we aim to validate these CR metrics against the participants’ self-reported mood and sleep variables during the study period to ascertain how circadian patterns computed by different approaches correlate to wellbeing indicators.
Methods
Data
The data we use for this study come from the UT1000 Project 18 we conducted at the University of Texas at Austin in two deployments, one in the Fall 2018 semester (October-November) and the other during Spring 2019 semester (February-March). This project was approved by the University of Texas Institutional Review Board (study number 2018-07-0035; approval date: September 25, 2018; expiration: July 16, 2019). In this project we collected smartphone tracking data from a total of 1584 student participants (61% female; 91% between the age of 18–22) for three weeks, which included GPS, accelerometer, and phone usage data from the participants’ primary smartphones in addition to real-time and daily self-report data consisting of participants’ answers to activity, mood, and sleep surveys (ecological momentary assessments). Specifically, the GPS data contain timestamped coordinates (longitude and latitude) and were recorded by smartphone GPS sensors configured to scan for one minute every 10-minute break. The accelerometer data are sampled at a frequency of 10 Hz and contain a reading along the X, Y, and Z axes relative to the smartphone’s position at each sampling. Both GPS and accelerometer data are subject to hardware constraints such as phone power-off or user deactivation.
Experiments
To create the required input for CR analysis, we performed data preprocessing as follows. For accelerometer data, we first calculate a magnitude value
These 144-length vectors will be the input for further CR analysis. The CR methods outlined in the Related Work section are highly sensitive to missing data and we do not want to fill in missing data by interpolation. As such, we retain participants who have at least five days of fully complete data (not necessarily consecutive), i.e., complete 144-length vectors of both accelerometer and GPS activity values. This is an extremely strict criterion because missing as little as 10 minutes worth of data on a day would disqualify the day as “complete”. Even so, our participant cohort is large enough that we can afford to restrict our dataset to the highest completeness of days and still provide a large enough sample size to conduct CR analysis. Our preprocessed dataset contains 225 participants in total: 162 participants from the 2018 deployment and 63 participants from 2019.
For each of the days with complete accelerometer and GPS data from each of the participants retained, we perform the following operations for both accelerometer and GPS data. First, we compute the cumulative activity at the increment of 10 minutes and find the timestamps at which 25%, 50%, and 75% of cumulative activity has been reached (“quartile activity timestamps”). Activity is defined as mean absolute deviation from gravity for accelerometer and consecutive displacement for GPS. Second, we fitted a transformed cosinor model with a logistic link function 7 to the signals to learn parameters such as mesor, amplitude, acrophase, and the F-statistic. Third, we implement the formulae of Interdaily Stability and Intradaily Variability (Table 1). Finally, we follow the circadian movement calculation by Saeb et al. 11 and computed the frequency energy that falls between 23.5 and 24.5 hours on the Lomb-Scargle periodogram.
These computational efforts resulted in a list of metrics that we use to answer the research questions formulated in the Research Questions section. To answer RQ1, we look into the differences between accelerometer and GPS in their quartile activity timestamps, acrophase and F-statistics from transformed cosinor modeling and Intradaily Variability. To answer RQ2, we look into the differences between accelerometer and GPS in their frequency energy and Interdaily Stability. For both RQ1 and RQ2, we use Welch’s T test to compare values due to the likely different variance.
To answer RQ3, we put together 11 CR metrics (three quartile activity times, amplitude/mesor/acrophase, IV/IS/RA, and periodogram power near a 24 hour cycle) and apply a mixed graphical model
22
to learn their inter-relations. Specifically, we fit a LASSO regression model for each of 11 CR metrics with the remaining 10 metrics as predictors, using a regularization parameter
To answer RQ4, we first select six variables (four mood outcomes and two sleep outcomes) from our daily survey data. The four mood outcomes are sadness, loneliness, stress, and contentment, evaluated at 9am each day by the question “Please describe how you felt today overall: I was feeling _________ sad/lonely/stressed/content”. Participants were asked to choose from four answer options, namely not at all, a little bit, quite a bit, and very much, which are associated with values 0, 1, 2, and 3 respectively. As expected, participants’ answers to the contentment question, a positive affect, are negatively correlated with the other three items (sad, lonely, stressed). Moreover, the self-reported mood outcomes have been shown to correlate significantly with daily behavioral features derived from passive mobile sensing signals 23 . The two sleep outcomes are the amount of sleep and next-morning refreshedness, evaluated at 9am each day for the previous night. The question for the amount of sleep is “How many hours did you sleep last night?”, for which participants could choose from no sleep/less than one hour of sleep (entered as 0), more than 12 hours (entered as 13), and every number of hours in between (e.g., an entered 7 means 7–8 hours of sleep). The question for next-morning refreshedness is “How refreshed did you feel after your sleep?”. For the refreshedness question, participants again had four options to choose from, namely not at all refreshed, slightly refreshed, somewhat refreshed, and very refreshed, which are associated with values 0, 1, 2, and 3 respectively. Participants’ answers to the “How many hours did you sleep last night?” question have been shown to correlate strongly with sleep duration measured by wearable sensors in a separate study of ours 24 . For each of these daily-evaluated mood and sleep outcomes, we calculate the average value over the study period such that each participant is associated with one set of six mood and sleep variables. Finally, we compute the Spearman correlation between each of the six mood and sleep variables and each of the 11 CR metrics previously extracted from both smartphone accelerometer and GPS signals. We choose Spearman correlation over Pearson correlation to be robust against outliers and skewedness in the variables.
Results
RQ1
Table 2 shows the results of comparing CR metrics that describe the intradaily temporal distribution of smartphone accelerometer and GPS activity of our participants. The 25% activity time is significantly earlier in accelerometer than GPS: the cumulative accelerometer activity reaches the first quartile between 10-11am while the cumulative GPS activity reaches the first quartile between 11am and noon. The 50% or median activity time in accelerometer and GPS are quite similar and not significantly different, both falling between 2-3pm (14-15 hrs). The 75% activity time registers a significant difference between accelerometer and GPS again, with the latter significantly earlier. Cumulative accelerometer activity reaches 75% of the day between 6-7pm (18-19 hrs) while GPS activity does so between 5-6pm (17-18 hrs).
Comparing CR metrics that describe the intradaily temporal distribution of smartphone accelerometer and GPS activity.

Moving on to the cosinor metrics, we see that the F-statistic is significantly greater for GPS than accelerometer, indicating that daily GPS activity follows a sinusoidal shape more closely than accelerometer. However, the acrophase, or predicted time of peak activity, shows little and insignificant difference between accelerometer and GPS in both groups. This indicates that the time when mobility behavior peaks and the time when physical activity peaks during a day converge. Note the clear difference between the acrophase time and the 50% activity time in both groups and both sensors: acrophase falls between 4-5pm (16-17 hrs) while 50% activity time falls between 2-3pm (14-15 hrs). This temporal shift between median cumulative activity and peak activity during a day is tantamount to the difference between median and mode in the statistical context. The later acrophase than the 50% activity time suggests a left skewed daily activity profile in both accelerometer and GPS.
Next, Intradaily Variability is significantly greater in accelerometer than GPS, indicating that there exists more severe fragmentation, or switching between rest and activity, in accelerometer than GPS. This finding is expected because an individual tends to interact with their smartphone in “fragments” – picking it up, using it for a while, then leaving it unattended until the next use – thus contributing to bouts of activity between periods of rest. However, in one’s mobility pattern, such fragmentation is subject to the actual number of places the person visits and stays at during the day, which requires more effort and thus less likely to happen frequently.
Also listed in Table 2 (last column) are the Spearman correlations between the same intradaily temporal distribution metrics extracted from accelerometer and GPS. Regardless of how different or similar their means compare with one another, all metrics in this group except Intradaily Variability have a rather high level of correlation between the sensors. At 0.05, Intradaily Variability values extracted from accelerometer and GPS are barely correlated at all, underscoring the difference in the aspects of daily behavior captured by the two sensors.
RQ2
Table 3 shows the results of comparing the level of circadian disruption in smartphone accelerometer and GPS activity from our participants. Both the energy within
Comparing CR metrics that describe the level of circadian disruption in smartphone accelerometer and GPS activity.

RQ3
Figure 1 shows the inter-relations between 11 CR metrics extracted by four types of methods from our smartphone accelerometer and GPS data. Each node represents a CR metric and the edges in-between represent their inter-relations. The edges’ color indicates the sign of the pairwise relation (green positive, red negative) and thickness is proportional to the magnitude.

Inter-relations of CR metrics from smartphone accelerometer and GPS activity (see the Method section for details). Each node represents a CR metric and edges represent relations between metrics. Color and weight of the edges indicate the direction (green: positive; red: negative) and magnitude of the pairwise relation. The blue part in the ring surrounding each node indicates the proportion of variance explained by other metrics. T25/T50/T75: time of 25%/50%/75% cumulative activity; AMP/PHI/MES/FS: amplitude, acrophase, mesor, and F-statistics from the transformed cosinor modeling; IV/IS/RA: Intradaily Variability, Interdaily Stability, and Relative Amplitude from the non-parametric methods; E24: energy of frequency that falls within
Among the three quartile activity times, 50% activity time is to a large extent explained by 25% and 75% activity times in both accelerometer and GPS, meaning that a person who arrives at median cumulative activity later (or earlier) in the day tends to complete 25% and 75% of sensor activity later (or earlier) as well. A surprising negative link exists between 25% time and 75% time unique to GPS, suggesting that in terms of mobility activity the participants who started their days early tend to be the ones who finished their days late.
Among the cosinor modeling measures, the only relation that stands out is a strongly positive one between mesor (MES) and amplitude (AMP), especially in accelerometer. This is an expected pattern since both mesor and amplitude describe the signal’s activity span and are supposed to be codependent. Interestingly, neither acrophase (PHI) nor the F-statistic (FS) is related to mesor or amplitude. This means that the time when accelerometer and GPS activity reach a peak and how closely the cosinor model fits activity data are both independent of how large the peak is.
The inter-relations between the three non-parametric CR metrics (IV, IS, RA) seem very weak in both accelerometer and GPS, except for a strong, positive association between IV and IS evident only in GPS. Also unique to GPS is a strong negative relation between IV and E24, the energy of frequency that falls between 23.5 and 24.5 hours on the Lomb-Scargle periodogram, of which there is little in accelerometer. This indicates that participants who have higher Intradaily Variability in mobility tend to have more disrupted CR in mobility across days.
Lastly, there exists a consistent positive relation between E24 and the F-statistics from cosinor modeling in both accelerometer and GPS, with that in accelerometer even stronger. This relation is evidence that better fit with the cosinor model translates to stronger rhythmicity with a 24-hour cycle.
RQ4
We list the significant pairwise correlations between CR metrics and mood and sleep outcomes in Table 4. The two sleep outcomes returned consistent results between the accelerometer metrics (Table 4a) and the GPS metrics (Table 4b). Both the number of hours slept (sleep) and how refreshed one feels after a night of sleep (refreshed) are negatively correlated with the acrophase (PHI; modeled time of maximum activity from transformed cosinor) of both accelerometer and GPS. This indicates that later peak activity during a day is associated with shorter sleep duration and poorer sleep quality on the same night. Additionally, the number of hours slept has a highly significant positive correlation with the interdaily stability (IS) of accelerometry. A similar correlation about sleep schedule regularity and sleep duration is documented in an existing study using surveys to measure circadian rhythm in older adults 25 .
Pairwise Spearman correlation between CR metrics (11 total) and averaged daily mood and sleep variables (6 total; the name “sleep” refers to the amount of sleep). Only the correlations more significant than

Compared to the sleep outcomes, the four mood outcomes and CR metrics exhibited less consistent association. Nonetheless, the correlations between mood outcomes and certain magnitude related CR metrics in GPS are notable. For example, the relative amplitude (RA) of GPS displacement is negatively correlated with stress and positively so with contentment. This result suggests that a definite separation between busy and quiet periods of the day may have mental health benefits.
Discussion
The distinction between the aspects of daily behavior captured respectively by accelerometer and GPS is worth noting. Straight-forwardly, the GPS sensor detects changes in geographic location, therefore captures the user’s place visits and mobility patterns. However, we recognize at least three types of behavior that can lead to increased accelerometer signal activity (or greater deviation from gravity baseline): (1) interacting with the phone such as making phone calls and using mobile apps; (2) performing physical activities with phone carried on person while staying at the same place, such as cooking at home or walking around in an office, and; (3) traveling between places with phone carried on person, which is also reflected in GPS signals. In this sense, the accelerometer captures a finer grain of movement information – all movement, while the GPS would reflect larger aggregate movements through the environment.
Conclusion
In this study, we used smartphone tracking data from 225 college student participants with at least five full days of complete data to investigate inter-relations between circadian patterns extracted from accelerometer and GPS sensors as well as their correlations with mood and sleep measures collected from the participants. We used four analytical approaches, namely survey construct automation, transformed cosinor modeling, non-parametric methods, and Fourier analysis to characterize circadian rhythm using both sensors. We conceptually categorized CR metrics into three categories, namely temporal distribution, activity span, and circadian disruption. We asked four research questions: RQ1 and RQ2 compared CR metrics of the temporal distribution category and the circadian disruption category between smartphone accelerometer and GPS activity; RQ3 examined the inter-relations between different CR metrics within the same sensor, and; RQ4 explored the degree to which the CR metrics extracted with different methods from different data streams are correlated with self-reported mood and sleep outcomes.
We found that, compared to GPS signals, the intradaily distribution of smartphone accelerometer activity follows a pattern that starts earlier in the day; winds down later; reaches half cumulative activity about the same time, which is about two hours earlier than when it reaches maximum activity; conforms less to a sinusoidal wave; and exhibits more intradaily fragmentation. GPS activity, on the other hand, exhibited a stronger circadian rhythm and interdaily stability than accelerometer, revealing differences in the daily behavioral aspects that manifest in the two sensor signals. Moreover, the inter-relations between different CR metrics have their respective peculiarities in accelerometer and GPS activity. A notable one is the negative relation between intradaily variability and circadian rhythm strength, which is present in GPS but not in accelerometer. Finally, our participants’ self-reported sleep and mood outcomes showed significant correlations with particular CR metrics, of which two correlations were reproduced in both accelerometer and GPS signals: (1) later peak time of activity during the day (acrophase) and poorer sleep quality (less refreshed in the morning), and (2) lower interdaily stability and fewer hours of sleep. Among the mood items, loneliness level appears lower in participants whose daily routine saw more disruption, reflected in higher intradaily variability in accelerometer and lower 24-hour periodogram energy in GPS.
The analyses reported in this paper demonstrated that both accelerometer and GPS signals from smartphones can capture normal human movement behavior to be used to characterize daily rest-activity patterns (CR). We offered empirical evidence for the inter-relations between a comprehensive set of different circadian rhythm measures extracted from the two sensors and personal wellbeing indicators. The choice of sensor should take into consideration what is available and the needed signal resolution as that choice will have an effect on passive circadian rhythm characterization.
While mainstream CR studies have relied significantly on medical grade wrist-worn actigraphy 26 , we believe commercial smart devices will broaden citizens’ access to just-in-time knowledge of their own CR pattern, especially the aspects of it that are indicative of physical and mental health. Our work serves as a beginning step to develop mobile health tools utilizing heterogeneous passive sensing signals for effective CR monitoring and wellbeing informatics. To achieve this goal, future work is necessary to formally validate commercial smart device sensors with wrist-worn actigraphy, which was not done in this study. Compared to the young and overall healthy college student participants we used in our study, future CR research may benefit from both demographically more representative cohorts, especially under-served families and communities, and target groups with specific illnesses and health needs.
Footnotes
Acknowledgements
There is no acknowledgement to be made at this point.
Conflicting interests
The authors declare that there is no conflict of interest.
Contributorship
CW, MM, HF, and DMS conceived the experiments. CW and MM conducted the experiments. CW analysed the results. CW, MM, and HF wrote the first draft of the manuscript. All authors reviewed and edited the manuscript and approved the final version of the manuscript.
Ethical approval
The data collection study described in this paper was approved by the University of Texas Institutional Review Board (study number 2018-07-0035).
Funding
This work was supported by Whole Communities–Whole Health, a research grand challenge at the University of Texas at Austin.
Guarantor
DMS