
Abstract
Background
The acceptability of health interventions is centrally important to achieving their desired health outcomes. The construct of acceptability of mobile health interventions among adolescents is neither well-defined nor consistently operationalized.
Objectives
Building on the theoretical framework of acceptability, these two studies developed and assessed the reliability and validity of a new scale to measure the acceptability of mobile health applications (“apps”) among adolescents.
Methods
We followed a structured scale development process including exploratory factor analyses (EFAs), confirmatory factor analyses (CFAs), and employed structural equation modeling (SEM) to assess the relationship between the scale and app usage. Adolescent participants used the Fooducate healthy eating app and completed the acceptability scale at baseline and one-week follow-up.
Results
EFA (n = 182) determined that the acceptability of health apps was a multidimensional construct with six latent factors: affective attitude, burden, ethicality, intervention coherence, perceived effectiveness, and self-efficacy. CFA (n = 161) from the second sample affirmed the six-factor structure and the unidimensional structures for each of the six subscales. However, CFA did not confirm the higher-order latent factor model suggesting that the six subscales reflect unique aspects of acceptability. SEM indicated that two of the subscales—ethicality and self-efficacy—were predictive of health app usage at one-week follow-up.
Conclusions
These results highlight the importance of ethicality and self-efficacy for health app acceptability. Future research testing and adapting this new acceptability scale will enhance measurement tools in the fields of mobile health and adolescent health.
Background
Mobile technologies (e.g. smartphones and tablets) can deliver mobile health (mHealth) interventions that are affordable, easy to use, and that can be widely adopted across socioeconomic and age groups. 1 Advantages to mHealth interventions as compared to in-person interventions include cost-effective dissemination, real-time data collection and feedback, lower participant burden, and flexibility for tailoring. 2 Increasing evidence demonstrates that mHealth interventions are effective in changing an array of health behaviors and improving health outcomes.1–4
In 2018, ∼95% of U.S. adolescents aged 13 to 17 years had consistent access to smartphones and that percentage continues to increase. 5 Adolescents with smartphones report being online via computer or cellphone—almost constantly (45%), or several times a day (45%). 5 Thus, reaching adolescents on their smartphones to target health behaviors may be an effective health promotion strategy. mHealth interventions delivered as applications on smartphones (i.e. health apps) are effective among adolescents in changing behaviors related to obesity prevention, type 2 diabetes management, and medication adherence.2,3,6
There is substantial competition in the health apps marketplace; in 2015, there were already 165,000 health and fitness apps available for download, 7 though limited information about app effectiveness. 8 To build engaging health apps, mHealth researchers and app developers must understand how and what adolescents value in these apps. Only 21% of U.S. adolescents have ever downloaded a health app on their smartphone as compared to 36% of adults.9,10 Among adolescents who have downloaded a health app, 47% hardly ever or never use them, 45% sometimes use them, and only 8% use them often. 9 Public health interventions that are more acceptable are more likely to be adopted or used, and usage is necessary to bring about the intended outcomes of the intervention. 11 To deliver mHealth intervention apps that adolescents will use, the field needs tools to assess the acceptability of these apps throughout the development process. No validated measures of acceptability of health apps among adolescents (AHAA) currently exist
Justification for scale development
Currently, many researchers rely on qualitative methods to assess the acceptability of mHealth interventions.12–17 For example, researchers describe the use of semi-structured interviews and focus groups to collect qualitative data about acceptability, but often do not collect complementary quantitative data on acceptability.12–17 The development of an acceptability scale that can be readily integrated into formative studies, pilot studies, and larger efficacy and effectiveness studies would strengthen researchers’ ability to collect rigorous, quantitative data that can complement qualitative data to guide mHealth intervention development, save time and resources, and increase the likelihood of adoption and use in the real world.
Existing acceptability measures of mHealth and eHealth for adults have differently operationalized this construct, assessing a range of observed characteristics such as aesthetics18,19 (e.g. the way the app looks) and latent characteristics such as participants’ interest in the app, credibility of the app, and the app's personal relevance. 20 Rigorous, standardized processes for evaluating the acceptability of mHealth interventions would increase the ability to compare across interventions, an essential component of evaluation research as the number of mHealth interventions continues to grow.21–23
Theoretical framework of acceptability
We define the acceptability of health apps as whether intended users (in this case, adolescents) would use the health app in their everyday lives. 24 This definition conceptualizes acceptability as a multi-dimensional construct because many factors are likely to influence whether individuals use health apps in their everyday lives.25–27 Following work by Sekhon et al., 11 we consider acceptability as a necessary but not sufficient condition for the effectiveness of an intervention. Using Sekhon et al.'s 11 theoretical framework of acceptability (TFA) we aimed to consider seven domains of acceptability pertaining to health-related interventions: affective attitude, burden, ethicality, intervention coherence, opportunity costs, perceived effectiveness, and self-efficacy. 11 The definitions provided by the authors are described in Table 1.
Theoretical framework of acceptability (TFA) domains.

Sekhon et al. 11 emphasized that the acceptability of health-related interventions should be assessed at multiple time points during intervention implementation because participants’ perceptions of acceptability may change over time. Sekhon et al. 11 also proposed that the TFA should be applied to collect quantitative data via surveys or visual analog rating scales based on the TFA domains throughout all stages of a health-related intervention's development, implementation, and evaluation cycle.
Sekhon et al. 11 published their TFA framework in 2017 and few researchers have applied it to mHealth research in the published literature to date.28,29 A subset of the authors of this manuscript used the TFA as their foundation to qualitatively assess how adolescents define and conceptualize the acceptability of health apps (Chen et al. 30 ). Results indicated that two additional domains (i.e. dimensions) of acceptability were important to adolescents beyond the seven from the TFA: intervention expectations and peer norms. See Figure 1 below for an updated conceptual model for acceptability. Adolescents described what they expected out of the health apps based on prior experiences with health apps and other non-health apps (intervention expectations) and whether they perceived that their peers were experiencing the same health problem covered in the health app they were using (peer norms).
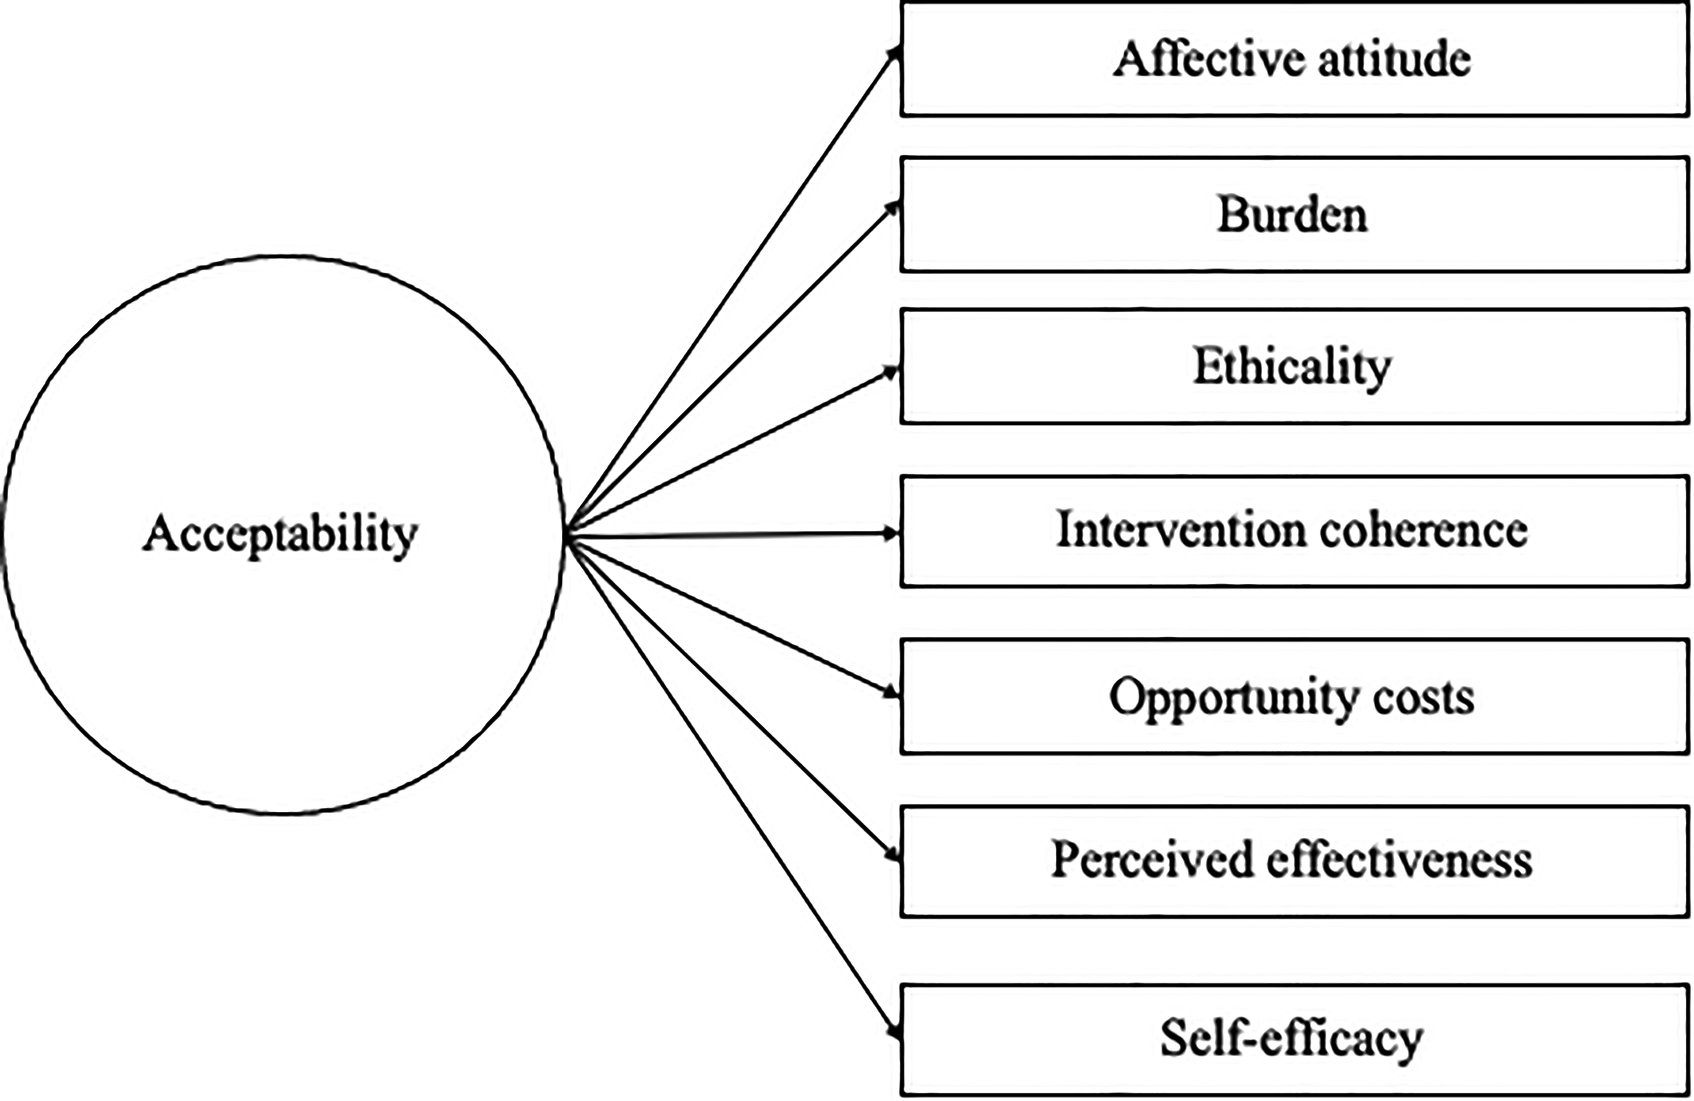
Updated theoretical framework of acceptability (TFA) for mHealth interventions among adolescents (Chen et al. 30 ).
Purpose
The goal of this research was to develop a new scale to assess the AHAA. We designed two studies to build on the qualitative research from our earlier study to address the following two research questions:
Research Question 1 (Studies 1 & 2): What are the psychometric properties of a newly developed scale to measure the AHAA? Research Question 2 (Study 2): What is the relationship between acceptability (as measured by the newly developed acceptability scale) and actual health app usage (as measured by the number of minutes spent on a health app one week after downloading the app)?
We hypothesized a positive association between health app acceptability and health app usage such that the greater the acceptability score, the greater the number of minutes participants will use the health app.
Below, we present the methods and findings for Study 1 and Study 2, respectively.
Study 1
Overview
Using the TFA 11 and the findings from the previous qualitative study (Chen et al. 30 ), we set out to create and test a new acceptability scale with adolescents in North Carolina by asking participants to try the nutrition tracker app Fooducate. 31 Fooducate's motto is “Eat healthy. Lose weight.” and has five features: Food Finder (scans food items and shares nutritional information), Community (for posting your own updates to share with other Fooducate users), Tracker (for daily calories), Recipes, and Diet Tips. All protocols associated with this study were approved by the Institutional Review Board at The University of North Carolina at Chapel Hill (IRB Number 17–295).
Methods
We used DeVellis’ scale development process 31 to guide study activities in combination with Múthen and Múthen's five-step research strategy for exploratory factor analyses (EFAs) and confirmatory factor analyses (CFAs). 33 We also included cognitive interviews and field tests to strengthen the scale development process, as recommended by 34 and Willis. 35 We synthesized these into a 7-step scale development process (shown in Table 2) with three distinct phases: item generation, theoretical analysis, and psychometric analysis. 35
Seven-step scale development process for studies 1 and 2.

CFA: confirmatory factor analysis; EFA: exploratory factor analysis;
Determine what latent variable we aim to measure37,38
Parts of Step 1 including “collect and analyze formative qualitative data,” and “propose revised measurement model,” were conducted prior to this study, and were described elsewhere (Chen et al. 30 ). This manuscript covers Steps 2 through 7. A more detailed description of our scale development approach is contained in Table 2 which includes the scale development steps as well as the specific activities we completed for each of those steps.
Item generation
Generate an item pool
After identifying the nine sub-constructs of acceptability in the previous qualitative study (Chen et al. 30 ) (attitudes, burden, ethicality, intervention coherence, opportunity costs, perceived effectiveness, self-efficacy, intervention expectations, and peer norms), we generated a pool of 56 possible items (28 item pairs) intended to measure each sub-construct. Each item pair included a positively framed item (e.g. I like the app) and a negatively framed item (e.g. I don't like the app) for a total of 56 items and each of the nine sub-constructs had between 4 and 12 items. The initial item pool is included in Appendix 1.
Determine the format for measurement
We chose to measure each of these items on a 4-point Likert scale (1 = strongly disagree, 2 = disagree, 3 = agree, 4 = strongly agree) because survey methodologists have found that offering four response options is optimal with children and adolescents as respondents. 39 Negative items were reverse coded after data collection and before analysis so that higher scores indicated higher levels of acceptability for all items.
Theoretical analysis
Have the initial item pool reviewed by experts
To assess content validity 12 experts at the University of Chapel Hill at North Carolina reviewed the initial item pool via email in September 2018. These experts had expertise in the following areas: eHealth, mHealth, adolescent health, social work, media and journalism, survey research, scale development, program development, and program evaluation. In addition, their research interests covered a variety of health topics, including nutrition, human immunodeficiency virus prevention, smoking, cancer, and sexual health.
Based on the feedback from these experts, we revised our items and included 52 items in the updated pool. This list of items is included in a survey in Appendix 2.
Include validation items
We wanted to include additional items in the survey to assess the convergent and discriminant validity of the acceptability scale. 31 To assess convergent validity, 31 we included adapted items from the system usability scale (SUS)40,41 because the usability of health apps is expected to be directly correlated with the acceptability of health apps.37,38 Developed in the 1990s for desktop computer systems, 42 the SUS has been used by mHealth researchers to collect data for health apps and other mHealth interventions.43,44 The SUS consists of 10 items and includes items such as “I thought the system was easy to use” and “I found the system very cumbersome to use.”40,41 Response options include 5-point Likert scale items (1 = strongly disagree, 2 = disagree, 3 = neutral, 4 = agree, 5 = strongly agree). We adapted the original SUS items for use with health apps similar to other mHealth studies45,46 and replaced “system” with the name of the health app adolescents were testing. For example, the adapted items included “I thought Fooducate was easy to use” and “I found Fooducate very cumbersome to use.” The adapted SUS items are included in the survey in Appendix 2.
Conversely, the proposed acceptability scale items should not correlate with items on the money attitudes scale 47 as there is no theoretical or empirical evidence to suggest that they would, so we included 6 items from the money attitudes scale in the survey to assess discriminant validity. 31 Some of the items included “I feel it is my parents’ job to pay for my everyday needs” and “I deserve to get most of the things I want.” 47 Response options included 4-point Likert scale items (1 = strongly disagree, 2 = disagree, 3 = agree, 4 = strongly agree) and a mean money attitudes score was calculated taking the mean of all of the items. 47 The money attitudes items are also included in the survey in Appendix 2.
Conduct cognitive interviews and field tests
We conducted cognitive interviews with a sample of six adolescents at partner schools in North Carolina in October 2018 to assess their opinions and reactions to each item on the proposed acceptability scale prior to finalizing items for a pilot study to collect data for EFA. Participants seemed to understand the survey items on acceptability and money attitudes and no changes were made to these items. However, participants repeatedly asked the principal investigator to define several words and phrases in items from the SUS, including “cumbersome,” “well integrated,” “technical person,” and “unnecessarily complex.” Since these words were included in the original SUS, 40 we chose to keep these items for comparison purposes but noted that these items are not necessarily teen-friendly.
We also conducted field tests with 10 adolescents across three partner school sites in rural North Carolina to test the updated survey, as well as to ensure that there was acceptable Wi-Fi connectivity at each school site since these schools would be participating in future waves of data collection.
Psychometric analysis
In December 2018, we recruited 182 participants across two school districts—one rural and one non-rural—in grades 7 through 9 to download and test the Fooducate app and complete the survey that included acceptability items, adapted SUS items, items from the entitlement subscale of the money attitudes scale, and basic demographic and smartphone usage items. We sent parent letters home with student grades at partner schools. The parent letters included basic information on the Fooducate food tracker app and the activity students would complete as part of the research study. Students were eligible if they returned parent consent and participant assent forms within a two-week window. We entered participants who completed the Fooducate activity and survey into a drawing for one of five $20 VISA gift cards.
Conduct EFA
We conducted a round of EFAs 36 to help us: (1) identify how many latent constructs underlie the set of items in the instrument; (2) better understand the nature of the latent constructs that account for the variation and covariation among the items; and (3) determine which items are performing well and which are not. 33 We adhered to the fundamental steps and procedural recommendations for EFA put forth by Brown 48 and the resulting measurement model from the EFAs in Study 1 served as the hypothesized measurement model for Study 2. We conducted analyses in Mplus version 7.1 48 and used weighted least squares estimation (wlsmv estimator) given the categorical nature of item responses. 49 We used oblique rotation to allow for potential correlation among factors. 50 We ran a series of exploratory factor models ranging from one to 10 factors and compared model findings to determine the appropriate factor structure.
Results for study 1
Sample characteristics
In January and February 2019, 182 students completed the Fooducate activity and survey (Appendix 3). Participant characteristics (n = 182) are included in Table 3. More than half (54%, n = 104) of the participants identified as female, almost half of the participants (47%, n = 86) were in the ninth grade, and all participants were between the ages of 12 and 16 years. The majority of the participants identified as Black/African American (69%, n = 126) and 17% (n = 31) of participants identified as Hispanic or Latino. The characteristics of this sample were similar to those of the schools. The participants were recruited from two schools—one rural and one non-rural—and about half (57%, n = 103) of the participants attended the rural school and about half (43%, n = 79) attended the non-rural school. See Table 3 for sample characteristics.
Sample characteristics for exploratory factor analysis (EFA) sample (n = 182).

Descriptive statistics
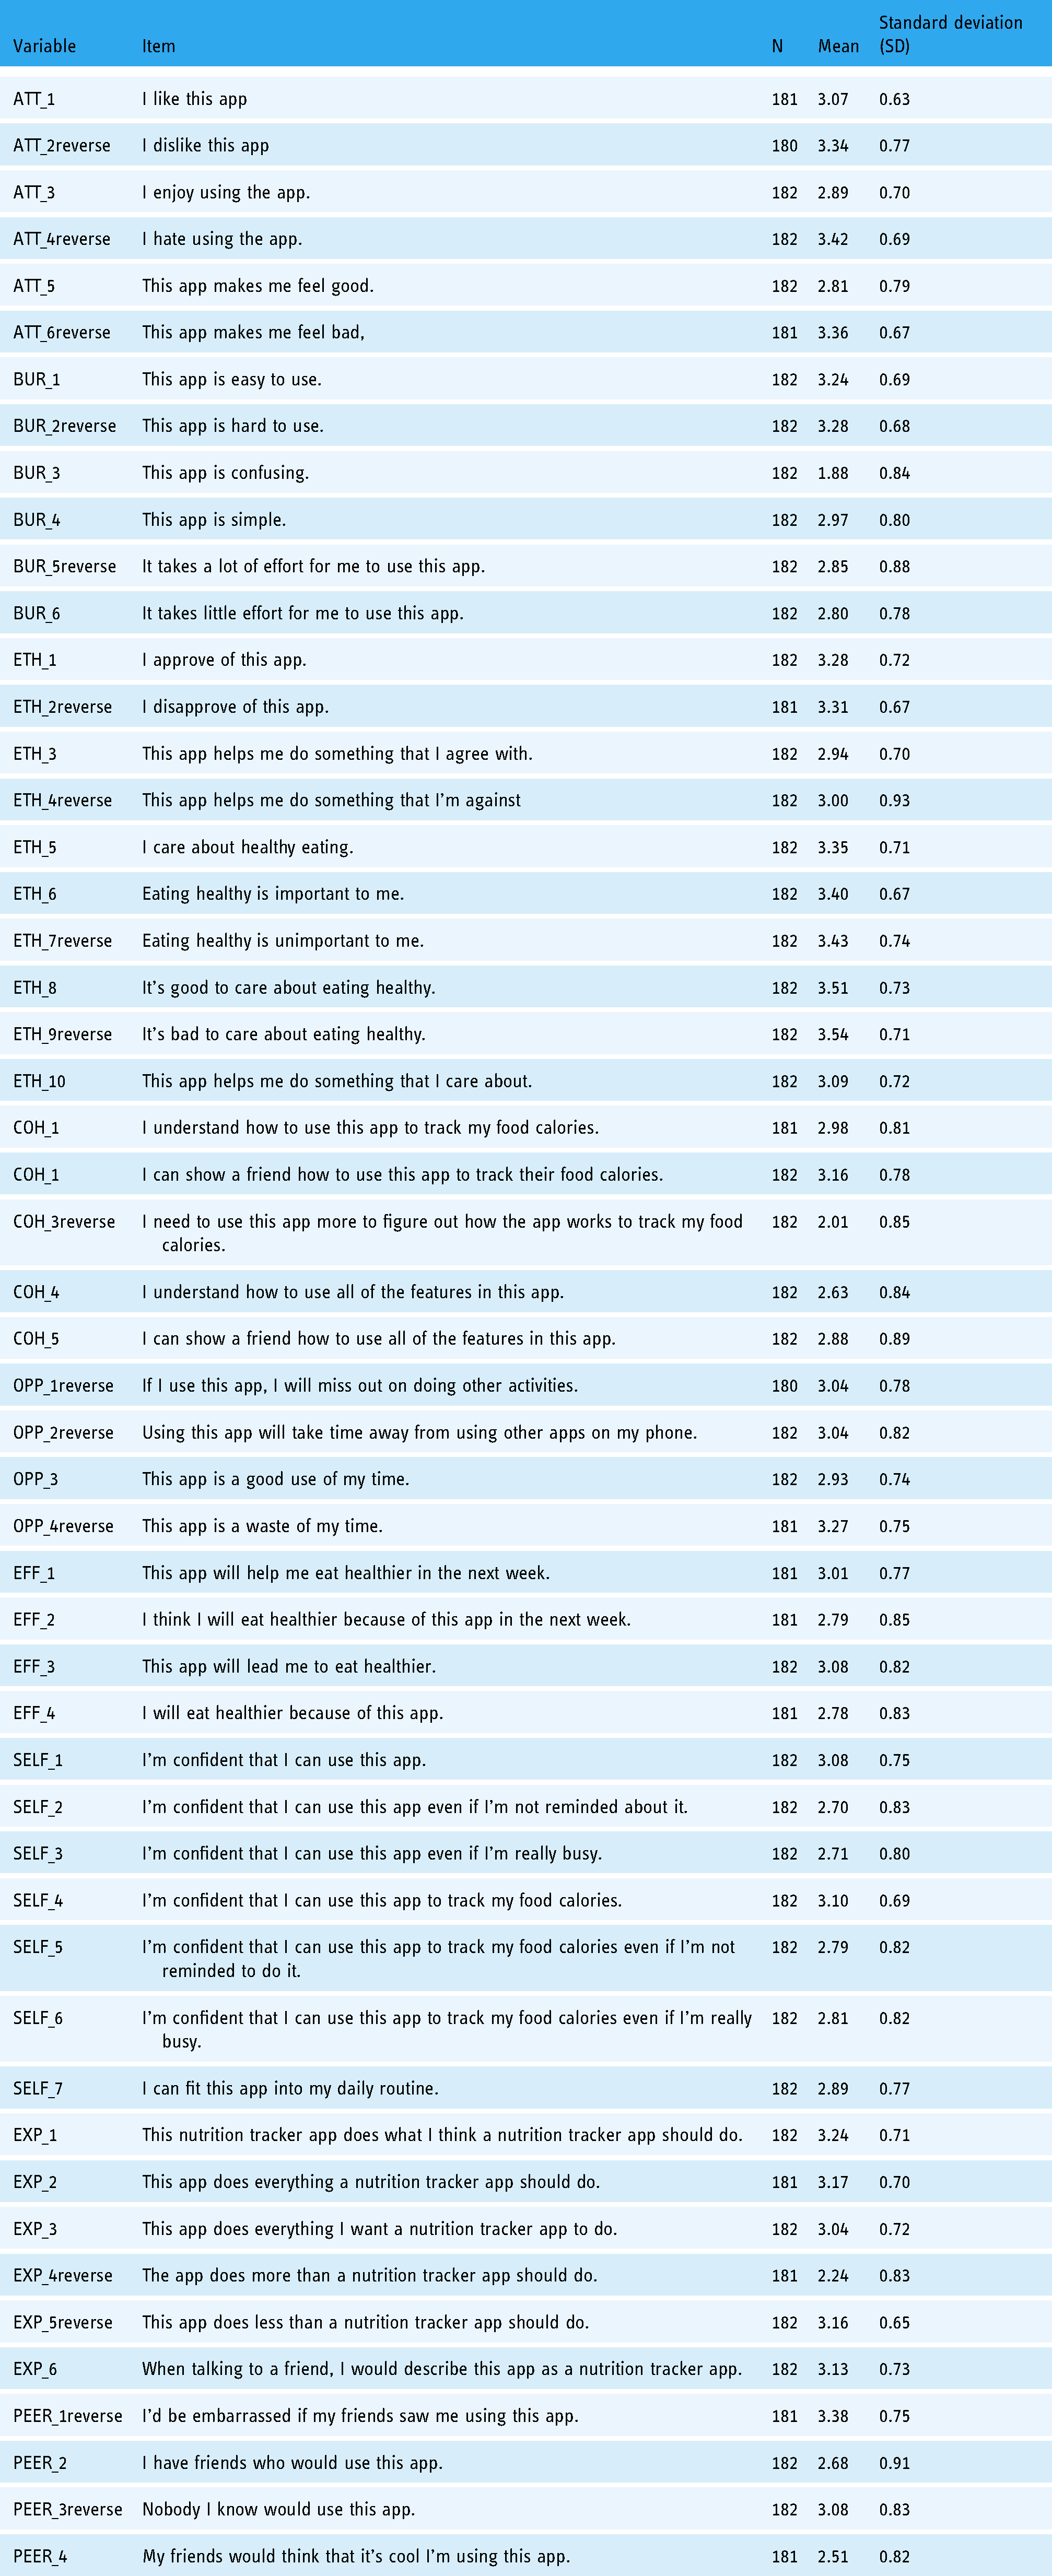
We inspected the means, standard deviations (SDs), and observed response ranges for all scale items (Table 4). Negative items were reverse coded and these variable names had the word “reverse” added to them. For all 52 items, the range was from 1.00 to 4.00. The scale item means ranged from 1.88 to 3.54 with SDs ranging from 0.63 to 0.93.
Means, standard deviations, and the range of responses from an exploratory factor analysis (EFA) sample.
Internal consistency reliability
Cronbach's alpha for the 52-item instrument was 0.94, which is considered to be high, with magnitudes of inter-item correlations ranging from <0.01 to 0.63. For each of the nine subscales (i.e. attitude, burden, ethicality, intervention coherence, opportunity costs, effectiveness, self-efficacy, intervention expectations, and peer norms) Cronbach's alpha ranged from 0.40 to 0.88 (Appendix 4). Magnitudes of inter-item correlations within these subscales ranged from 0.03 to 0.66. This range of inter-item correlations indicates that some items showed effectively no inter-item correlation up to moderately high inter-item correlation, underscoring the need to drop items.
Exploratory factor analysis (EFA)
We conducted several EFAs before and after instrument revisions. Based on our EFA results, there was evidence that our instrument likely had a nine-factor structure in alignment with the nine acceptability domains (attitude, burden, ethicality, intervention coherence, opportunity costs, effectiveness, self-efficacy, intervention expectations, and peer norms). The nine-factor model had the fewest items cross-loading on three or more factors and the majority of the significant factor loadings were over 0.40. Factor loadings and commonalities for each of the 52 items are shown in Appendix 5.
Scale revisions
We then updated scale items to maximize reliability, to eliminate items that were not loading on the same factors as others in the same subscale, and to delete items with low communalities (<0.5).32,50 We wanted to keep at least three items for each of the subscales include and in the end we retained 22-items from the original 52-item scale. Six subscales remained of the original nine with the subscales for opportunity costs, intervention expectations, and peer norms being deleted. We used an iterative modeling technique to optimize fit and interpretation and it became evident that a six-factor model would best suit the data. We named the new scale the AHAA scale and Cronbach's alpha for the new scale was 0.91. Cronbach's alphas for the subscales ranged from 0.74 to 0.88. See Table 5 for the 22 items along with Cronbach's alphas and inter-item correlation ranges for each of the six included subscales.
Cronbach's alphas and inter-item correlations for subscales of 22-item acceptability of health apps among adolescents (AHAA) scale.

Scoring the acceptability scale items
Each of the 22 items in the AHAA scale had four response options that were coded from 1.00 to 4.00. Acceptability scores were calculated by taking the mean of items responses within each of the six subscales and then totaling the six means. This approach was better than summing item responses because a summed score would artificially deflate scores with missing data and the subscales had different numbers of items. Additionally, we did not have evidence that one subscale should be weighted more than another. Therefore, possible acceptability scores ranged from 6.00 to 24.00. The mean acceptability score was 18.32 with an SD of 2.75. The minimum was 7.75 and the maximum was 24.00.
Convergent and discriminant validity
We predicted that the acceptability of a health app as measured by the AHAA scale would be associated with the usability of the health app as measured by an adapted version of the SUS. The adapted SUS items were scored using the guidelines put forth by Sauro 51 and the converted scores had a possible range of 0 to 100.00. In our sample of 182, the mean SUS score for our sample was 60.96 with an SD of 10.12. The minimum was 32.50 and the maximum was 87.50. Given Sauro's guidelines, 51 the average SUS score among our participants was lower than the benchmark average score (68). Cronbach's alpha for the SUS items was 0.45. We ran correlations and found that acceptability, as measured by the new 22-item AHAA scale, was associated with usability (rho = 0.62, p < 0.001) as predicted by theoretical and empirical literature.
We also predicted that the acceptability, as measured by the AHAA scale, would not be associated with money attitudes as measured by the money attitudes subscale to measure entitlement. 47 There were six items to measure money attitudes and we took the mean of the items to calculate a money attitudes score that had a possible range of 1.00 to 4.00. In our sample of 182, the mean of the money attitudes score was 2.47 with an SD of 0.62. Cronbach's alpha for the money attitudes items was 0.79. The minimum was 1.00 and the maximum was 4.00. We ran correlations and found that acceptability was not associated with money attitudes (rho = −0.02, p = 0.80) as predicted.
Study 2
Overview
To further assess the psychometric properties of the new 22-item AHAA scale developed in Study 1 and to measure the relationship between acceptability and actual health app usage, we recruited a new sample of adolescents in grades 7 through 9 in Study 2. We asked these participants to download and test the same Fooducate app. This time, we also asked participants to use it as much or as little as they desired in the one week that followed the initial data collection so that we could also collect Fooducate usage data from their phones to assess the relationship between acceptability and actual health app usage.
Methods
Recruitment
We recruited a separate sample of adolescents in grades 7 through 9 from a rural school in Eastern North Carolina with demographic characteristics similar to the sample for EFA. All students with iPhones at the participating school were eligible. iPhones were required for this sample because we used the Screen Time feature available on all iPhones to track the number of minutes participants spent on the app after completing the Fooducate activity for the following week (7 days).
Data collection. These participants were asked to download the Fooducate app during their lunch or elective period, play with the app for a few minutes, and complete a survey (Appendix 6) with the AHAA scale items, the SUS items, the money attitudes scale items, and the same demographic items and iPhone usage items (e.g. How many minutes have you spent on messages today? How many minutes have you spent on messages in the past 7 days?). There was an additional question asked to collect the number of minutes participants spent on the Fooducate app prior to completing the survey. After the in-class activity, participants were asked to use the Fooducate as much or as little as they wanted in the next week. Then, we returned to the school site exactly one week later to collect data from participants’ Screen Time feature to see how many minutes they spent on the Fooducate app in the previous week so that we could assess predictive validity 32 since we expect an association between acceptability and usage. We took pictures of each participant’s Screen Time that showed their Fooducate app usage along with their assigned participant identification number. We transcribed the number of minutes participants spent on the Fooducate app in the past week then subtracted the total number of minutes they recorded in their surveys (the number of minutes they spent on the app during the in-class activity) to obtain the number of minutes participants spent on the Fooducate app after the initial encounter.
Conduct CFA
CFA is a type of structural equation modeling (SEM) that assesses the relationship between observed measures or indicators (i.e. scale items) and latent variables (i.e. factors). 48 CFA is commonly used during the scale development process for construct validation to verify the number of underlying dimensions of the instrument (factors) and the pattern of item–factor relationships (factor loadings). CFA results also help determine how scales should be scored. CFA should also be conducted prior to the specification of a larger structural equation model that incorporates antecedents and distal outcomes of factors.
Based on the EFA results in Study 1, we had three hypotheses for Study 2 to test with CFA.
Hypothesis 1. Responses from the 22-item acceptability scale should fit the predicted six-factor model indicated by results from EFAs in Study 2. Each of the six factors represented a latent variable and each item was an indicator variable. See Figure 2 for this predicted measurement model. Hypothesis 2. Each of the six subscales (attitude, burden, ethicality, intervention coherence, effectiveness, and self-efficacy) was unidimensional. Hypothesis 3. Data from the 22-item acceptability scale should fit a higher-order latent factor model where the six factors (attitude, burden, ethicality, intervention coherence, effectiveness, and self-efficacy) were latent factors of the higher-order latent factor acceptability. See Figure 3 for this predicted measurement model.
We conducted CFAs in Mplus version 7.1 49 and used weighted least squares estimation (wlsmv estimator) given the categorical nature of item responses. 48

Measurement model of six factors of acceptability.

Measurement model of higher-order latent variable acceptability and first-order latent variables.
Assess the relationship between acceptability and actual app usage
To assess predictive validity and the relationship between acceptability and actual app usage (Research Question 2), we then ran structural equation models in Mplus to assess whether the acceptability scale or any acceptability subscales were predictive of actual app usage one week after downloading the Fooducate app. Results from CFA informed which SEM models we ran. We chose to run these models with SEM instead of with logistic or linear regression models because the SEM analytics framework assumes that there is measurement error whereas the more traditional analytics approaches do not.
Results
Sample characteristics
In March 2019, 161 students completed the Fooducate activity and survey (Appendix 6). Participant characteristics (n = 161) are included in Table 6. About half (52%, n = 84) of the participants identified as male, about half of the participants (55%, n = 89) were in the ninth grade, and all participants were between the ages of 12 and 16 years. The majority of the participants identified as Black/African American (78%, n = 125) and only 5% (n = 8) of participants identified as Hispanic or Latino. We recruited participants from one rural school and sample characteristics were similar to the demographics of the school population. See Table 6 for additional sample characteristics.
Sample characteristics for confirmatory factor analysis (CFA) sample (n = 161).

Descriptive statistics
We inspected the means, SDs, and observed response ranges for all scale items (Table 7). For the 22-item scale, the observations ranged from 1.00 to 4.00 for the majority of items. The response options ranged from 2.00 to 4.00 for ATT_4reverse, BUR_1, BUR_2reverse, and ETH_8. The scale item means ranged from 2.69 and 3.63 with SDs ranging from 0.49 to 0.83.
Descriptive statistics for confirmatory factory analysis (CFA) sample.

Confirmatory factor analysis (CFA)
First, we ran the six-factor model (Hypothesis 1).
This model had a good fit and therefore confirmed Hypothesis 1 that there were six distinct factors present among the 22 items included in the acceptability scale.
Next, we ran each subscale as single-factor models (Hypothesis 2). We examined the fit statistics for each of the six models and the single-factor model for perceived effectiveness had an excellent fit since fit statistics met all recommended thresholds. On the other hand, the remaining single-factor models had a good fit. Therefore, this led us to confirm Hypothesis 2 that each of the six subscales was therefore unidimensional.
We also examined the factor loadings, R2 values, and Cronbach's alphas for each of the subscales. The factor loadings for each of the items in all six subscales were statistically significant and ranged from 0.77 to 1.28. R2 for items in subscales ranged from 0.40 to 0.93. Cronbach's alpha ranged from 0.77 to 0.90 among subscales. These subscale reliabilities were comparable to those for the EFA sample above. See Table 8 for more information on factor loadings, R2 values, and Cronbach's alphas for each of the six subscales.
Factor loadings, R2 values, and Cronbach's alphas for six subscales.

Third, we examined the fit statistics for the higher-order six-factor model of acceptability (Hypothesis 3) and our findings indicated poor model fit. We could not confirm Hypothesis 3 based on these findings.
Even though CFA results indicated poor model fit for the second-order model, we examined the factor loadings, R2 values, and Cronbach's alphas for the higher-order six-factor acceptability model. With all 22 items grouped in their subscale factors, the factor loadings ranged from 0.80 to 1.234. R2 values ranged from 0.30 to 0.72. Cronbach's alpha for the 22-item acceptability scale is 0.90. For more information on factor loadings, R2 values, and Cronbach's alpha for the six-factor model of acceptability, see Appendix 7.
Structural equation modeling (SEM)
Since the six-factor model for the second-order latent variable acceptability was not a good fit according to CFA results, we moved forward with the six subscales representing distinct variables for our analyses on actual app usage. For SEM, we hypothesized that each of the six latent variables (attitude, burden, ethicality, intervention coherence, effectiveness, and self-efficacy) as measured by their individual subscale items were predictive of the observed variable usage (see Figure 4) measured by the number of minutes reported by Screen Time on participants’ iPhones.

Hypothesized structural equation model for latent variables attitudes, burden, ethicality, intervention coherence, effectiveness, and self-efficacy on the observed Variable App usage.
Participants spent between 0 and 95 min on the Fooducate app in the one week after they first downloaded the app and completed the in-class survey. The mean number of minutes was 12.29, the median number of minutes was 9.00, and 17 participants did not use the app after they completed the in-class survey.
The results of our SEM indicated that two latent variables—ethicality and self-efficacy—were significant predictors of actual app usage. See Table 9 for unstandardized and standardized regression coefficients.
Latent variable predictors and regression coefficients from structural equation modeling predicting usage.
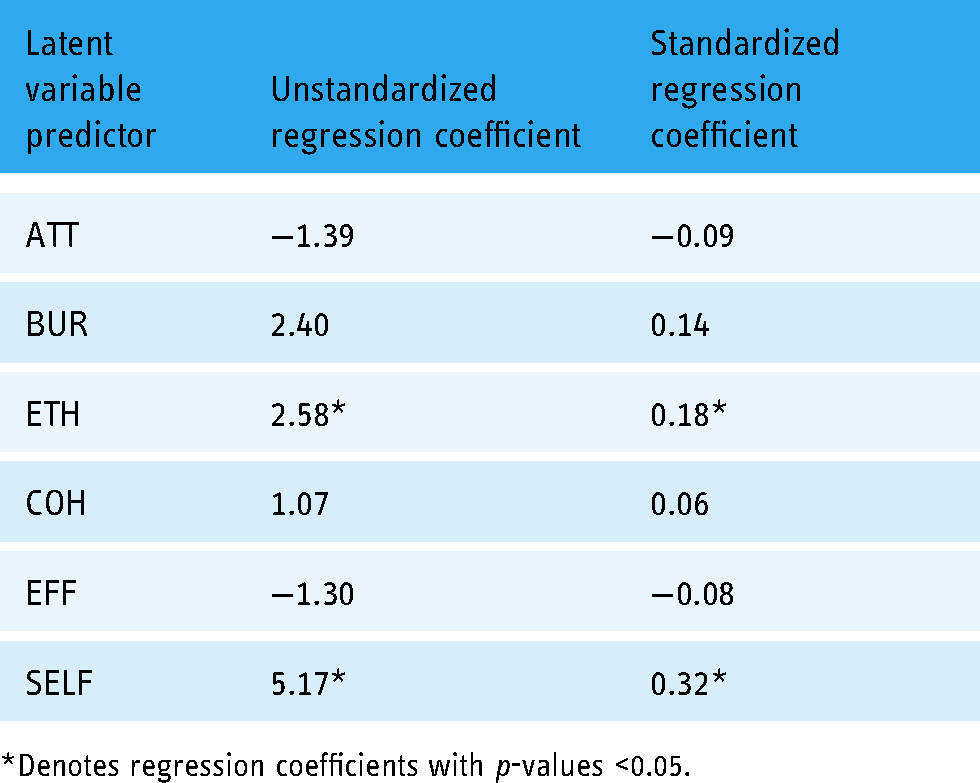
*Denotes regression coefficients with p-values <0.05.
Discussion
We developed and tested a 22-item scale to measure the acceptability of the Fooducate app among adolescents in grades 7 through 9 in North Carolina. This final acceptability scale had six domains, including attitude, burden, ethicality, intervention coherence, perceived effectiveness, and self-efficacy in alignment with previous acceptability research 11 and formative research completed by our research team with this specific adolescent population. Items that assessed three additional domains—opportunity costs, intervention expectations, and peer norms—did not appear in the final scale even though evidence from our formative research (Chen et al. 31 ) and other studies 11 suggested that these would be important domains. Our 22-item scale had strong reliability among our EFA and CFA samples with Cronbach's alphas of 0.91 and 0.90 respectively. Although the CFA results did not confirm the hypothesized higher-order factor model for the latent construct acceptability as indicated by EFA results, CFA results did confirm the six-factor model predicted from EFA results and confirmed that each of our six individual subscales (attitude, burden, ethicality, intervention coherence, perceived effectiveness, and self-efficacy) were single-factor models with good to great model fit. Of these six factors, SEM analyses showed that self-efficacy (β = 5.17, p < 0.05) and ethicality (β = 2.58, p < 0.05) were significant predictors of actual app usage in a one-week follow-up period.
Self-efficacy, operationalized as an individual's confidence in their ability to perform a specific behavior, is an important theoretical construct that is predictive of various health behaviors. Self-efficacy is included in several popular health behavior theories including the health belief model, 52 social cognitive theory (as human agency), 53 and the theory of planned behavior (as perceived behavioral control). 54 However, it is important to note that our scale items on self-efficacy were intended to assess participants’ confidence to use the health app (e.g. to track food calories) instead of their confidence to perform the health behavior (e.g. eat healthy). We found eHealth and mHealth studies among adolescents that measured self-efficacy for health behaviors 55 but not self-efficacy for intervention usage or adoption. Vandelanotte et al. 56 emphasized the need for eHealth and mHealth researchers to explicitly measure intervention self-efficacy (e.g. confidence to use a health app) or internet self-efficacy (e.g. confidence to use the internet) in addition to self-efficacy for health behaviors. In addition, Baker et al. 57 suggested that since technology is quickly and constantly evolving, eHealth and mHealth researchers should consider self-efficacy as an important outcome in and of itself because it can be quickly assessed and is a precursor for intervention adoption and future behavior change. Among eHealth studies that did assess self-efficacy to use interventions among adults, though, self-efficacy did not predict usage.58,59 Given our results, the self-efficacy to use the health app latent construct may be particularly salient among adolescents and should be explicitly measured in future mHealth studies.
Popular health behavior theories (e.g. health belief model and theory of planned behavior)52,54 have not explicitly included the construct of ethicality (the extent to which the intervention has a good fit with an individual's value system). However, it is possible that constructs from these theories impact ethicality and how much participants value a health app. For example, perceived susceptibility and perceived severity from the health belief model 52 and normative beliefs and subjective norms from the theory of planned behavior 54 are constructs from these theories that may relate to ethicality. Similarly, there is evidence that motivation to achieve a health outcome (e.g. to quit smoking) is predictive of mHealth intervention usage among adults.60,61 In exploring the relationship between ethicality and acceptability in the context of health apps it may also be useful to consider frames of reference that have intrinsic values-focused components, such as acceptance and commitment therapy-informed interventions 62 and intervention approaches proposed by self-determination theory. 63
Lastly, it is important for us to consider when to administer this scale in future research. We recommend that the acceptability scale be administered to adolescents during the app development phase so that adjustments can be made to improve acceptability. Moving forward we recommend assessing acceptability at multiple time points during the evaluation of health apps so that we can determine whether acceptability changes over time. By measuring the acceptability of health apps with the same instrument at multiple time points, we will also be able to consider acceptability as a predictor variable, a mediating variable, or an outcome variable, depending on the research question of future studies.
Strengths
This research offered a conceptual definition of AHAA, operationalized the domains of acceptability, and presented initial validation results. These two studies adhered to a structured scale development process. The results also provided evidence that ethicality and self-efficacy are two predictors of actual app usage among adolescents which is helpful for researchers as they design health apps for this population.
In addition, the reliability of the items in the AHAA scale (Cronbach's alpha = 0.91) is greater than the reliability of the items from the current gold standard, the SUS: Cronbach's alpha for SUS items was only 0.45 among the EFA sample and 0.60 among the CFA sample. Therefore this new AHAA scale may be more appropriate for adolescents than the SUS and can be used early and often and used in conjunction with other instruments such as the Mobile App Rating Scale to create apps that better meet the needs of their intended users. 64
Limitations and future research
While these studies had many strengths, there were also limitations. First, we were surprised that items from several acceptability domains (opportunity costs, intervention expectations, and peer norms) did not load well on factors in the EFA and were subsequently deleted from the proposed scale prior to data collection for EFA. It is possible that the items we drafted and included in earlier waves of data collection did not accurately measure the proposed latent constructs. Moving forward, we should conduct additional formative research with adolescents so the target population can write items to measure these three constructs.
We also noted differences between our EFA sample and our CFA sample. The largest difference was in rurality: 57% of participants in the EFA sample were recruited from rural schools whereas all (100%) participants in the CFA sample went to one rural school. There were differences with regard to race/ethnicity as well. Ideally, we would have recruited a sample for CFA with participant characteristics that were more similar to our EFA sample than our CFA sample. It is possible that the higher-order six-factor model would have been confirmed for a CFA sample more similar to the EFA sample. It is also possible that our sample size was not large enough to run CFA and SEM to test the higher-order model hypothesis given the number of parameters included in our final measurement models. 65
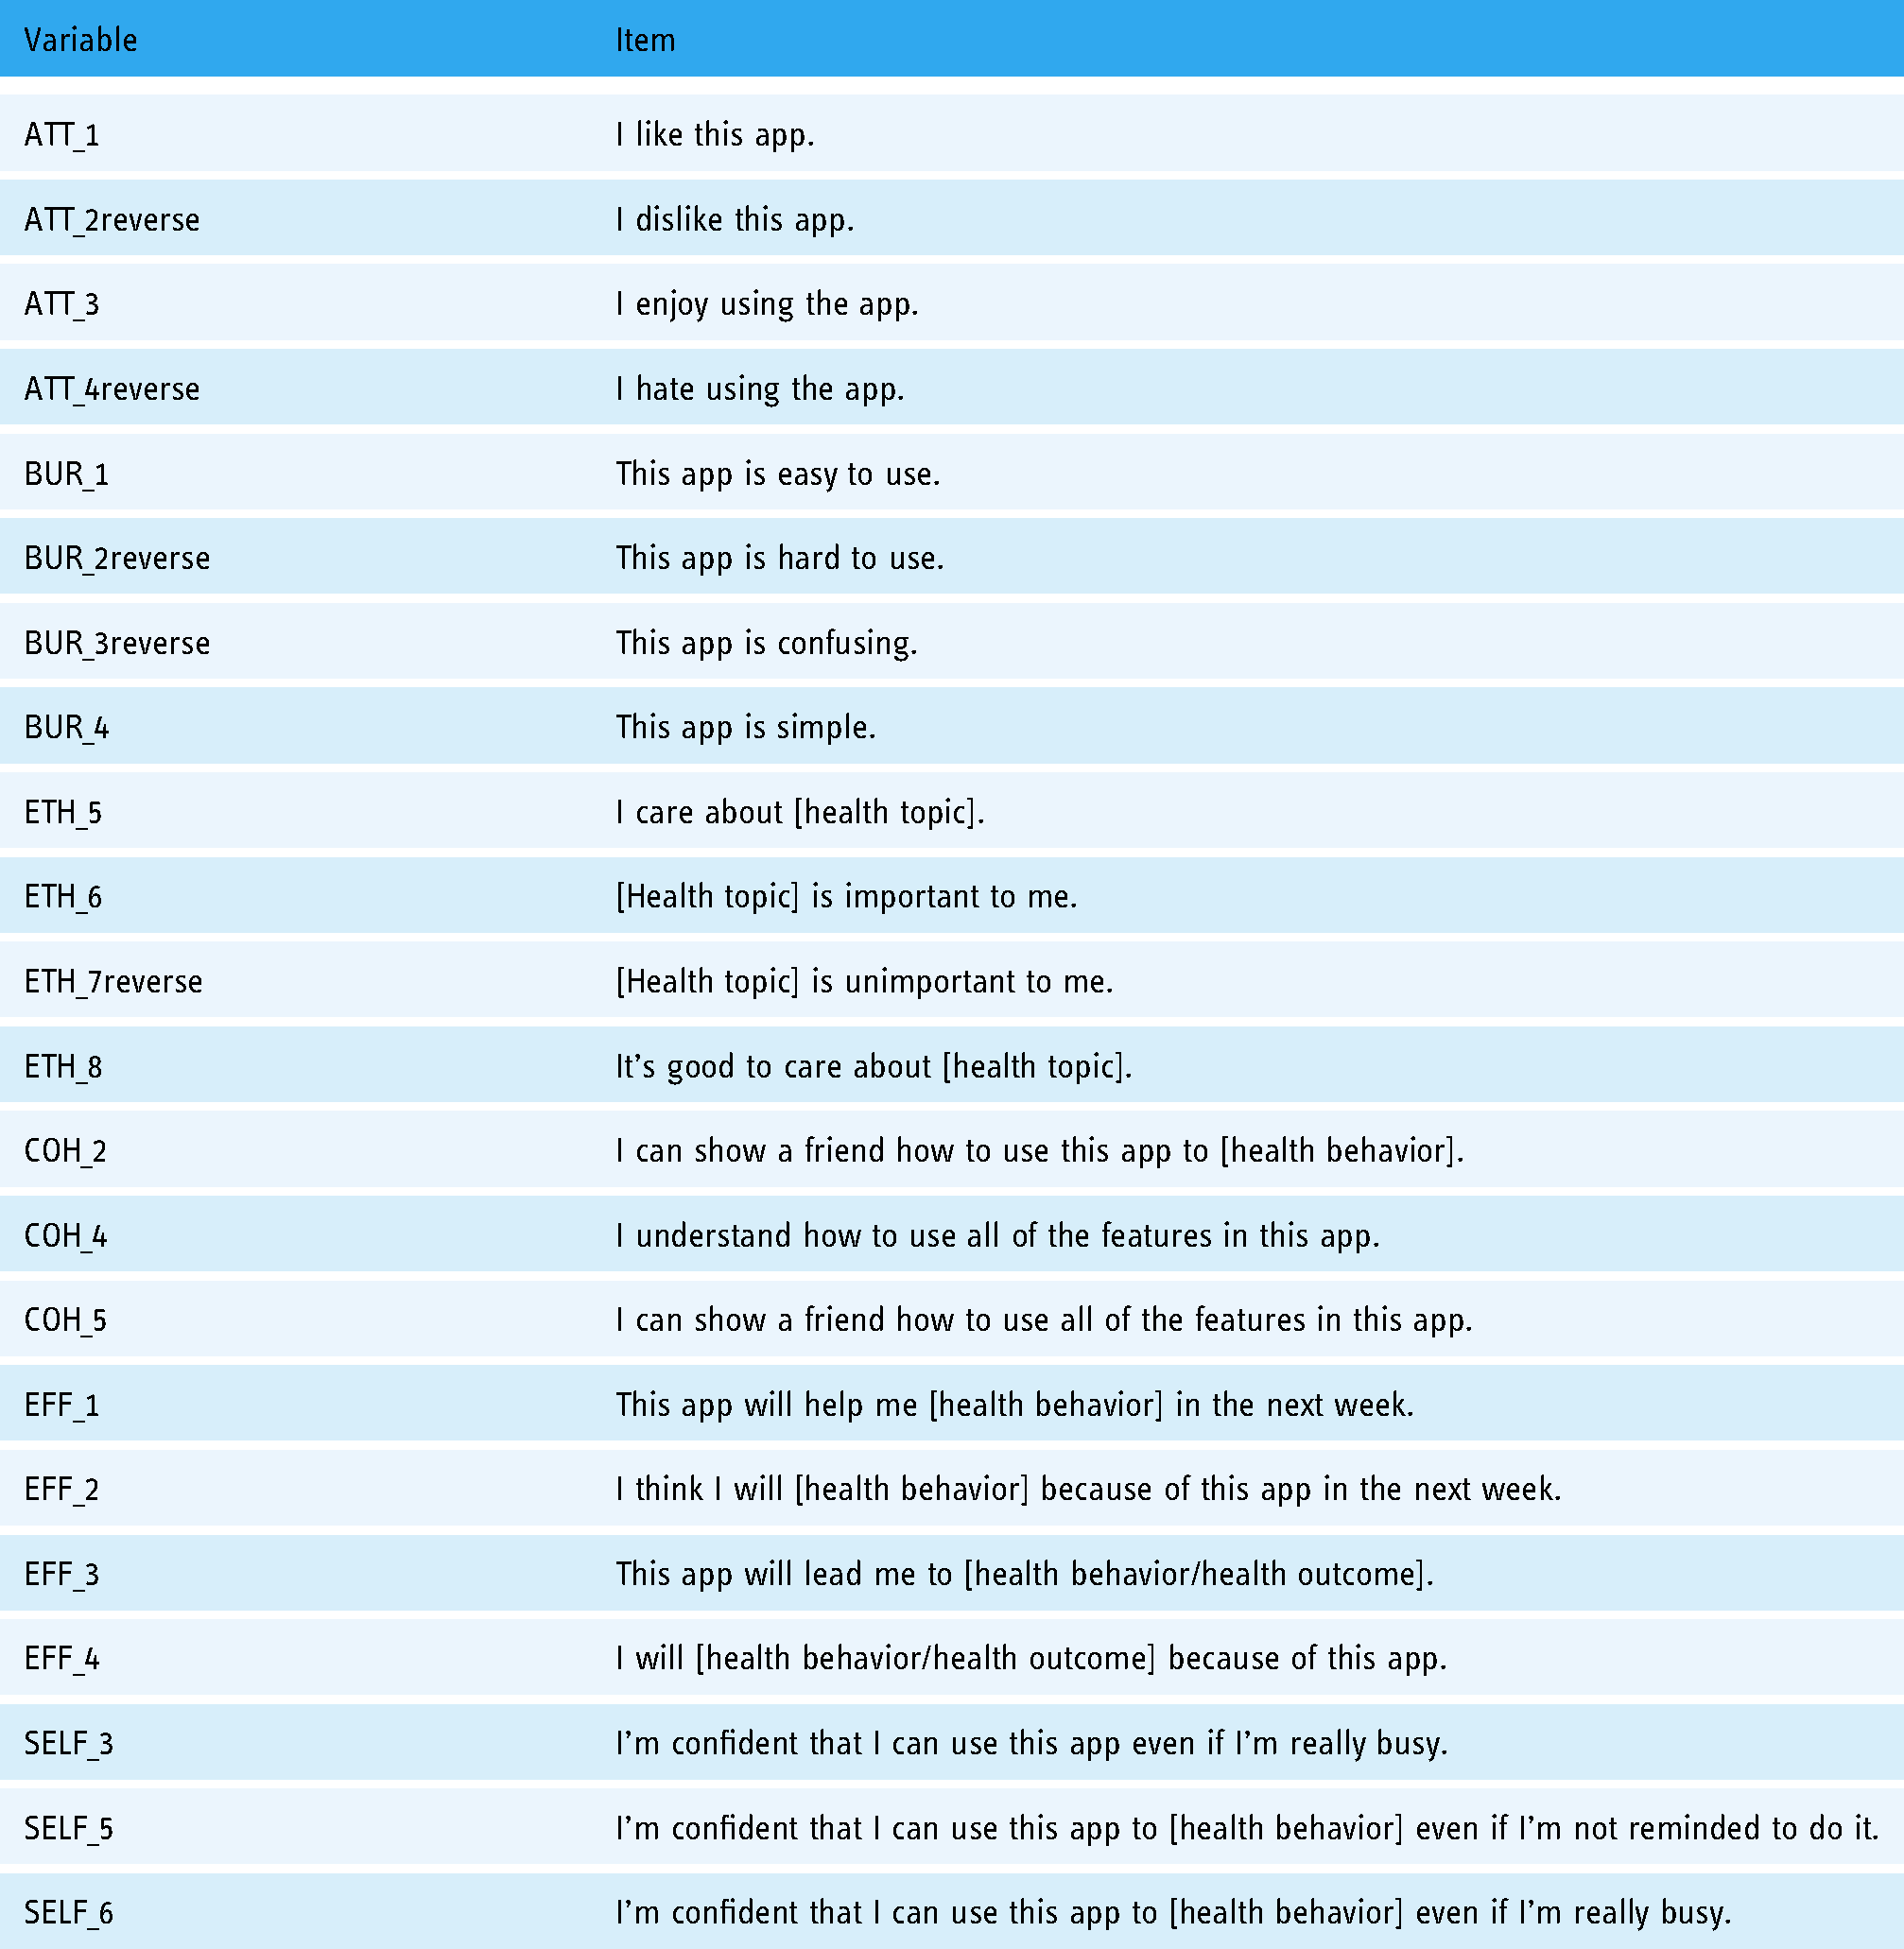
Moving forward, we also need additional testing of our 22-item AHAA scale (Table 10) that can be applied to other health apps for different health topics.
Acceptability of health apps among adolescents (AHAA) scale items.
These studies were the first of their kind to develop an acceptability scale specific to mHealth apps and were also unique because of their focus on adolescents. We encourage other researchers to use the full AHAA scale so that we can continue testing the scale to see if ethicality and self-efficacy continue to be consistent predictors of actual usage as we vary the health topics and the adolescent populations.
Footnotes
Acknowledgements
We would like to thank the American Association for University Women for supporting EC through their Dissertation Fellowship.
Contributorship
EC researched literature and conceived the study. EC, KEM, KK, KEM, and DFT were involved in protocol development, gaining ethical approval, and data analysis. EC led recruitment and data collection activities and wrote the first draft of the manuscript. All authors reviewed and edited the manuscript and approved the final version of the manuscript.
Ethical approval
The ethics committee of The University of North Carolina at Chapel Hill approved this study (IRB Number 17-295).
Guarantor
EC
Declaration of conflicting interests
The authors declared no potential conflicts of interest with respect to the research, authorship, and/or publication of this article.
Funding
The authors disclosed receipt of the following financial support for the research, authorship, and/or publication of this article: EC was supported by a dissertation fellowship from the American Association for University Women.
Appendix 1: Initial item pool
Appendix 2: Survey for cognitive interviews and pilot testing
Directions: Download the Fooducate app and use it for a few minutes before completing the questionnaire. How much do you agree or disagree with the following statements? Circle one response per row.
Strongly disagree
Disagree
Agree
Strongly agree
1
I like this app.
1
2
3
4
2
This app is easy to use.
1
2
3
4
3
I approve of this app.
1
2
3
4
4
I understand how to use this app to track my food calories.
1
2
3
4
5
If I use this app, I will miss out on doing other activities.
1
2
3
4
6
This app will help me
1
2
3
4
7
I’m confident that I can use this app.
1
2
3
4
8
This nutrition tracker app does what I think a nutrition tracker app
1
2
3
4
9
I’d be embarrassed if my friends saw me using this app.
1
2
3
4
10
I dislike this app.
1
2
3
4
Strongly disagree
Disagree
Agree
Strongly agree
11
This app is hard to use.
1
2
3
4
12
I disapprove of this app.
1
2
3
4
13
I can show a friend how to use this app to track their food calories.
1
2
3
4
14
Using this app will take time away from using other apps on my phone.
1
2
3
4
15
I think I will eat healthier because of this app in the next week.
1
2
3
4
16
I’m confident that I can use this app even if I’m not reminded about it.
1
2
3
4
17
This app does everything a nutrition tracker app
1
2
3
4
18
I have friends who would use this app.
1
2
3
4
19
I enjoy using this app.
1
2
3
4
20
This app is confusing.
1
2
3
4
Strongly disagree
Disagree
Agree
Strongly agree
21
This app helps me do something that I agree with.
1
2
3
4
22
I need to use this app more to figure out how the app works to track my food calories.
1
2
3
4
23
This app is a good use of my time.
1
2
3
4
24
This app will lead me to eat healthier.
1
2
3
4
25
I’m confident that I can use this app even if I’m really busy.
1
2
3
4
26
This app does everything I
1
2
3
4
27
Nobody I know would use this app.
1
2
3
4
28
I hate using this app.
1
2
3
4
29
This app is simple.
1
2
3
4
30
This app helps me do something that I’m against
1
2
3
4
Strongly disagree
Disagree
Agree
Strongly agree
31
I understand how to use all of the features in this app.
1
2
3
4
32
This app is a waste of my time.
1
2
3
4
33
I will eat healthier because of this app.
1
2
3
4
34
I’m confident that I can use this app to track my food calories.
1
2
3
4
35
This app does
1
2
3
4
36
My friends would think that it's cool I’m using this app.
1
2
3
4
37
This app makes me feel good.
1
2
3
4
38
It takes a lot of effort for me to use this app.
1
2
3
4
39
I care about eating healthy.
1
2
3
4
40
I can show a friend how to use all of the features in this app.
1
2
3
4
Strongly disagree
Disagree
Agree
Strongly agree
41
I’m confident that I can use this app to track my food calories even if I’m not reminded to do it.
1
2
3
4
42
This app does
1
2
3
4
43
This app makes me feel bad.
1
2
3
4
44
It takes little effort for me to use this app.
1
2
3
4
45
Eating healthy is important to me.
1
2
3
4
46
I’m confident that I can use this app to track my food calories even if I’m really busy.
1
2
3
4
47
When talking to a friend, I would describe this app as a nutrition tracker app.
1
2
3
4
48
Eating healthy is unimportant to me.
1
2
3
4
49
I can fit this app into my daily routine.
1
2
3
4
50
It's good to care about eating healthy.
1
2
3
4
Strongly disagree
Disagree
Agree
Strongly agree
51
It's bad to care about eating healthy.
1
2
3
4
52
This app helps me do something that I care about.
1
2
3
4
Appendix 3: Study 1 survey
Step 1
Take out your iPhone or Android phone and connect to the Guest network (no password required).
Step 2
Download the app Fooducate to your phone.
Step 3
Create a Fooducate account.
Step 4
Log into the app so that you can get to this colorful menu screen.
Step 5
Play with the app for 2 to 3 min. Try out as many features as you can before moving on to the questionnaire on the next page.
Appendix 4: Cronbach's alpha and inter-item correlations for each acceptability subscale
Subscale
# items
Cronbach's alpha
Inter-item correlation min
Inter-item correlation max
Attitude
6
0.83
0.30
0.63
Burden
6
0.67
0.06
0.46
Ethicality
10
0.81
0.03
0.59
Intervention coherence
5
0.65
−0.03
0.63
Opportunity costs
4
0.66
0.14
0.45
Effectiveness
4
0.88
0.59
0.66
Self-efficacy
7
0.86
0.29
0.60
Intervention expectations
6
0.40
0.09
0.51
Peer norms
4
0.56
0.06
0.40
Appendix 5: Factor loadings and communalities for a nine-factor model of 52 items included in the original acceptability scale
Note. *Indicates statistically significant factor loadings with p-values <0.05; bolded factor loadings indicate the item's largest factor loading.
Variable
Item
Factor 1
Factor 2
Factor 3
Factor 4
Factor 5
Factor 6
Factor 7
Factor 8
Factor 9
Communality
ATT_1
I like this app
0.03
0.39*
−0.04
0.17*
0.01
0.00
−0.08
−0.07
0.85
ATT_2reverse
I dislike this app
0.02
−0.03
0.28*
−0.08
−0.02
−0.03
0.15
0.11
0.74
ATT_3
I enjoy using the app.
0.17*
0.41*
0.13
0.04
0.11
0.02
−0.07
0.09
0.82
ATT_4reverse
I hate using the app.
0.35*
0.13
0.16
0.07
−0.10
−0.07
0.00
0.08
0.60
ATT_5
This app makes me feel good.
−0.07
0.09
0.06
0.08
−0.02
0.10
0.15*
0.22*
0.67
ATT_6reverse
This app makes me feel bad.
−0.02
0.11
0.28*
0.16*
0.08
0.06
−0.05
−0.01
0.76
BUR_1
This app is easy to use.
0.15
0.03
0.09
−0.02
−0.16*
0.10
−0.01
0.04
0.49
BUR_2reverse
This app is hard to use.
0.03
−0.01
0.11
0.02
0.03
−0.00
−0.01
−0.10
0.66
BUR_3
This app is confusing.
0.12
0.05
0.29*
−0.15
−0.02
−0.21
−0.04
−0.04
0.64
BUR_4
This app is simple.
−0.26
−0.04
−0.01
−0.09
0.02
0.52*
0.05
0.06
0.74
BUR_5reverse
It takes a lot of effort for me to use this app.
0.14
0.09
0.01
0.00
0.15
0.04
0.03
−0.27*
0.34
BUR_6
It takes little effort for me to use this app.
−0.21
0.04
0.04
0.08
−0.03
0.40*
−0.01
−0.02
0.42
ETH_1
I approve of this app.
−0.01
−0.04
0.11
0.01
−0.09
0.30*
0.03
0.03
0.73
ETH_2reverse
I disapprove of this app.
−0.02
0.04
0.36*
−0.01
0.03
0.02
0.11
−0.01
0.73
ETH_3
This app helps me do something that I agree with.
0.08
0.09
0.07
0.13
0.18*
0.20
0.03
−0.15
0.65
ETH_4reverse
This app helps me do something that I’m against
−0.03
−0.07
−0.10
0.05
0.30*
−0.12
0.08
−0.11
0.39
ETH_5
I care about healthy eating.
−0.05
0.01
0.36*
0.09
−0.01
0.02
0.07
0.04
0.83
ETH_6
Eating healthy is important to me.
0.04
−0.05
0.43*
0.07
−0.06
0.05
0.01
0.03
0.84
ETH_7reverse
Eating healthy is unimportant to me.
−0.01
−0.09
0.00
0.55*
−0.26*
−0.01
0.04
0.06
0.81
ETH_8
It's good to care about eating healthy.
0.11
−0.06
0.12
0.30*
0.02
0.31*
−0.01
−0.06
0.63
ETH_9reverse
It's bad to care about eating healthy.
−0.04
0.06
−0.07
0.44*
0.04
0.10
−0.05
−0.11
0.66
ETH_10
This app helps me do something that I care about.
0.01
0.11
−0.08
0.31*
0.25*
−0.06
−0.03
0.11
0.70
COH_1
I understand how to use this app to track my food calories.
0.32*
−0.00
−0.03
−0.02
0.22*
−0.05
0.10
0.02
0.40
COH_2
I can show a friend how to use this app to track their food calories.
−0.03
0.02
0.03
0.09
0.31*
0.02
0.45*
0.09
0.75
COH_3reverse
I need to use this app more to figure out how the app works to track my food calories.
−0.10
0.06
−0.16
0.1
−0.20*
−0.02
0.24*
−0.11
0.24
COH_4
I understand how to use all of the features in this app.
0.09
0.46*
0.01
−0.08
−0.05
−0.06
0.06
−0.02
0.69
COH_5
I can show a friend how to use all of the features in this app.
−0.03
0.39*
0.12
−0.01
0.14
0.10
0.02
0.02
0.74
OPP_1reverse
If I use this app, I will miss out on doing other activities.
0.09
0.01
−0.21
0.00
−0.13
0.05
0.06
0.05
0.42
OPP_2reverse
Using this app will take time away from using other apps on my phone.
0.20
−0.01
0.05
−0.27*
0.03
0.19
−0.08
0.05
0.42
OPP_3
This app is a good use of my time.
0.33*
−0.10
0.11
−0.10
0.25*
0.13
−0.03
0.07
0.68
OPP_4reverse
This app is a waste of my time.
0.20*
0.15
0.30*
−0.01
0.01
−0.04
−0.04
0.09
0.78
EFF_1
This app will help me eat healthier in the next week.
0.10
−0.05
−0.14*
0.03
−0.05
−0.04
0.01
−0.06
0.66
EFF_2
I think I will eat healthier because of this app in the next week.
−0.02
−0.03
0.01
−0.25*
0.00
0.07
0.12
0.04
0.75
EFF_3
This app will lead me to eat healthier.
0.00
−0.01
0.01
−0.09
−0.21*
0.02
0.03
−0.08
0.82
EFF_4
I will eat healthier because of this app.
−0.07
−0.02
−0.05
−0.03
−0.08
−0.01
0.04
−0.03
0.81
SELF_1
I’m confident that I can use this app.
0.18*
0.31*
0.01
−0.07
−0.00
0.05
0.08
0.12*
0.69
SELF_2
I’m confident that I can use this app even if I’m not reminded about it.
0.15
−0.03
0.17
0.10
−0.08
0.14
0.12
0.01
0.46
SELF_3
I’m confident that I can use this app even if I’m really busy.
0.29*
0.17*
0.05
−0.01
−0.02
−0.03
0.03
0.04
0.68
SELF_4
I’m confident that I can use this app to track my food calories.
−0.02
0.13
0.28*
0.07
0.09
−0.14
0.30*
0.22*
0.74
SELF_5
I’m confident that I can use this app to track my food calories even if I’m not reminded to do it.
0.18*
0.13
0.32*
−0.18*
0.19*
0.06
−0.03
0.14
0.71
SELF_6
I’m confident that I can use this app to track my food calories even if I’m really busy.
0.11
−0.03
−0.00
0.01
0.02
0.13
0.12
0.01
0.79
SELF_7
I can fit this app into my daily routine.
−0.02
0.03
0.36*
0.13
0.07
−0.17
−0.03
−0.06
0.59
EXP_1
This nutrition tracker app does what I think a nutrition tracker app should do.
0.31*
0.15*
0.10
−0.01
0.02
−0.01
0.21*
−0.15*
0.57
EXP_2
This app does everything a nutrition tracker app should do.
0.24*
0.12
0.10
0.15
0.02
0.05
0.22*
−0.04
0.52
EXP_3
This app does everything I want a nutrition tracker app to do.
0.34*
0.00
−0.05
−0.08
0.13
−0.01
0.35*
−0.02
0.65
EXP_4reverse
The app does more than a nutrition tracker app should do.
−0.07
−0.14
−0.18
0.08
−0.10
0.16
−0.01
−0.02
0.37
EXP_5reverse
This app does less than a nutrition tracker app should do.
−0.07
−0.05
0.02
−0.01
−0.16
0.19*
0.02
0.01
0.36
EXP_6
When talking to a friend, I would describe this app as a nutrition tracker app.
0.07
−0.14
0.14
0.16
0.17
0.19
0.18*
0.08
0.54
PEER_1reverse
I’d be embarrassed if my friends saw me using this app.
0.10
0.20
0.00
0.06
0.04
−0.31*
0.11
−0.07
0.34
PEER_2
I have friends who would use this app.
0.21
−0.26*
0.21*
0.05
−0.08
0.03
0.01
−0.02
0.46
PEER_3reverse
Nobody I know would use this app.
0.25
−0.07
0.03
−0.03
−0.03
−0.18*
0.39*
0.04
0.46
PEER_4
My friends would think that it's cool I’m using this app.
0.03
−0.00
−0.08
−0.04
0.28*
−0.14
0.21*
0.17
0.57
Appendix 6: Study 2 survey
Step 1
Take out your iPhone phone and connect to the Wi-Fi network.
Step 2
Download the app Fooducate to your phone. Be sure to download the app with this logo:
Step 3
Sign up for a Fooducate account as a new user.
Step 4
Log into the app.
Step 5
Play with the app for 2 to 3 min. Try out the Food Finder, Community, Tracker, Recipes, and Diet Tips features. Wait for further instructions.
Appendix 7: Factor loadings,R 2 values,and Cronbach’s alphas for higher-order six-factor acceptability model
Higher-order latent variable
Latent variables
Higher-order factor loadings
Higher-order R2
Items
Factor loading
R
2
Cronbach's alpha
ACCEPT
ATT
1.00
0.63
ATT_1
1.00
0.70
0.90
ATT_2reverse
0.82
0.47
ATT_3
1.10
0.85
ATT_4reverse
0.93
0.60
BUR
0.76
0.39
BUR_1
1.00
0.66
BUR_2reverse
1.08
0.77
BUR_3reverse
1.06
0.74
BUR_4
0.93
0.58
ETH
0.79
0.32
ETH_5
1.00
0.88
ETH_6
1.01
0.90
ETH_7reverse
0.83
0.60
ETH_8
0.87
0.66
COH
0.89
0.52
COH_2
1.00
0.68
COH_4
0.93
0.58
COH_5
1.07
0.78
EFF
0.82
0.46
EFF_1
1.00
0.64
EFF_2
1.14
0.83
EFF_3
1.15
0.85
EFF_4
1.18
0.89
SELF
0.95
0.55
SELF_3
1.00
0.73
SELF_5
0.97
0.68
SELF_6
1.00
0.73