
Abstract
Background:
Obesity has a major impact on health and health care, particularly in those with chronic kidney disease (CKD).
Objective:
The objective was to describe the prevalence, characteristics, and outcomes of people living with CKD and obesity (defined by a body mass index [BMI] ≥30 kg/m2) in Canada.
Design:
Population-based cohort study using linked administrative health data (ICES).
Patients:
Adults aged 18 year and older with CKD G1-5D who had a height and weight recorded during a visit to an academic hospital in London Ontario Canada, between January 2010 and December 2019.
Measures:
CKD as defined by CKD 3A or higher. BMI as defined by weight kg/m2.
Methods:
As a primary interest, we described the percentage of patients with CKD across different BMI categories (<25 kg/m2, BMI 25-29.9 kg/m2, and BMI ≥30 kg/m2), as well as their demographic and clinical profiles. As secondary interests, we followed patients until January 1, 2022 to summarize: (1) the percentage with CKD G3 who had kidney disease progression (50% decline from baseline estimated glomerular filtration rate [eGFR]) by BMI category, (2) the percentage with CKD G3-4 who developed kidney failure (initiation of maintenance dialysis or an eGFR of <15 mL/min/1.73 m2) by BMI category, (3) the percentage with CKD G4-G5D who received a kidney transplant by BMI category, and (4) post-transplant outcomes in those transplanted over the study period, by BMI category. We performed similar analyses across CKD risk categories.
Results:
Of the 198 151 patients included, the percentage with obesity defined by a BMI ≥30 kg/m2 increased from CKD G1 to CKD G4 (ie, 37% of those with CKD G1 had a BMI ≥30 kg/m2 vs 40.9% of CKD G4). In CKD G5D and CKD T, the prevalence of high BMI appeared to drop (only ~38% had a BMI ≥30 kg/m2 across groups). Across CKD categories, those with a BMI ≥30 kg/m2 appeared to have more comorbidities, use more health care resources, and have more socioeconomic disparities than those with lower BMIs. Although secondary outcome events were limited, those with G3-4 with a BMI ≥30 kg/m2 appeared to have a higher risk of CKD progression and those with CKD G5D with BMI ≥30 kg/m2 were less likely to receive transplant over the study period. Interestingly those transplanted with a BMI ≥30 kg/m2 appeared to have fewer post-transplant complications. We also observed an “obesity-paradox” in the risk of mortality, with high BMI appearing protective, particularly in the end stages of kidney disease.
Limitations:
We used BMI to capture obesity in this study but recognize its limitations as a measure of body composition. Secondary outcomes were descriptive and unadjusted due to small sample size and may have been subject to selection bias and confounding.
Conclusions:
Obesity defined by high BMI is highly prevalent in people with CKD, and patients have health, health care, and social disparity. Future studies to understand the impact of BMI on patients with CKD and how to individualize and manage BMI and obesity across the spectrum of CKD remain important.
Introduction
The prevalence of obesity is rising1-3 and has major health and health care implications.4-6 Obesity is associated with comorbidities including type 2 diabetes, cardiovascular disease, and kidney disease,5,6 can contribute to significant health care costs,4,6,7 and can reduce quality of life.5,6
The consequences of obesity can be particularly profound for people with chronic kidney disease (CKD).8,9 Obesity is not only a risk factor for CKD progression,10-12 but it can restrict access to optimal treatment including kidney transplantation.1,9,13,14 In some studies, obesity (typically defined by a body mass index or body mass index [BMI] ≥30kg/m2) has been associated with wound complications and delayed graft function,15,16 and for these reasons patients with high BMI are often excluded from kidney transplantlists.1,7,10,11
The treatment and prevention of obesity among people with CKD are thus essential. To foster well-conducted research in this theme, it is important to understand the epidemiology of obesity across the CKD spectrum. Descriptive studies can inform sample size calculations and assist researchers to develop targeted interventions (eg, based upon socioeconomic characteristics of patients). We thus examined the contemporary prevalence of obesity (as defined by a BMI ≥30 kg/m2) in people with CKD from our region (London, Ontario, Canada). We also examined their demographic and characteristics, and the potential impact of high BMI on kidney disease progression, kidney failure and transplant. We hypothesized that the prevalence of BMI ≥30kg/m2 would be the highest in those with more advanced CKD, that these individuals would have more socioeconomic challenges, and that they would be at a heightened risk of progressive kidney disease and have lower rates of kidney transplantation than individuals with a lower BMI.
Methods
Design and Setting
We conducted a population-based cohort study of adults who received care in London, Ontario, and Canada hospital (London Health Sciences Centre [LHSC] and St. Joseph’s Health Care London) between January 1, 2010 and December 31, 2019. The LHSC and St. Joseph’s Health Care London are large academic centers that provide in-patient and out-patient health services to residents from London Ontario (population with mean age 41 years, 51% female, median annual income $33 000) 17 as well as those from as far as Northern Ontario to Extreme Southwestern Ontario. Our hospitals catchment includes people followed within LHSC’s Renal Program, which offers comprehensive kidney services across the region. 18 We followed guidelines for the reporting of observational studies (Supplement Table 1). 19
Data Sources
We used data from ICES (an independent, non-profit research institute that houses hundreds of administrative datasets), linked with Oracle CERNER (database of local digital health information) as our data sources. 20 In Ontario, residents have universal access to hospital and physician services and diagnostic testing through Ontario’s Health Insurance Plan (OHIP). Those aged 65 years or older or using social assistance (eg, Ontario Disability Support Program) have access to most prescription medications (through the Ontario Drug Benefits Program or ODB). The use of ICES data in this project was authorized under section 45 of Ontario’s Personal Health Information Protection Act (PHIPA) which does not require review by a Research Ethics Board.
We used databases including the Registered Persons Database of Ontario which provided vital statistics such as age, sex, and death date; the Ontario Marginalization Index, which provides neighborhood measures of marginalization, including economic, ethno-racial, age-based, and social marginalization21; the Ontario Laboratory Information System (OLIS) for lab values including serum creatinine, estimated glomerular filtration rate (eGFR), albumin-creatinine ratio (ACR), glycated hemoglobin (HbA1c), and lipids 22 ; and the Canadian Organ Replacement Registry (CORR) and OHIP, to collect kidney transplantation and dialysis information. Oracle CERNER was used to present calculated BMIs (via in-hospital height and weight). For health care utilization, we used the Client Agency Program Enrolment database (contains information about “rostering” to primary care), the Home Care Database (home care services), the ICES Physician Database, and the OHIP Claims databases (physician billing codes and diagnostic testing). We used the ODB and Drug Identification Number (DIN) database to report medication usage, and the National Ambulatory Care Reporting System (NACRS) database, Canadian Institute for Health Information’s Discharge Abstract Database (CIHI-DAD), and the Same Day Surgery databases to present comorbidities coded during emergency department, hospital, and same day surgical visits, respectively. The Ontario Mental Health Reporting System, Congestive Heart Failure, Ontario Hypertension Dataset, Ontario Diabetes Dataset, Ontario Rheumatoid Arthritis dataset, and the Canadian Joint Replacement Registry are validated ICES cohorts used to present medical conditions and comorbidities (widely used in the literature).23-25 Lookback windows for baselines characteristics were (1) 5 years for comorbidities, (2) 1 year for health care utilization, (3) 1 year for lab values, and (4) 180 days for medications.
All databases were linked using unique, coded identifiers and analyzed at ICES. A detailed description of each dataset is provided in Supplement Table 2
Patients
We included adults aged 18 and older who had a height and weight recorded during a visit to LHSC or St. Joseph’s Health Care London between January 1, 2010, and December 31, 2019. We excluded (1) those with a missing or invalid identification number, missing or invalid age (>105 years), missing or invalid sex, and death on or before index date (or start time for follow-up which was defined as the date the height/weight was recorded for out-patient encounters, or the date of discharge from hospital for in-patient encounters). We also excluded non-Ontario residents (to facilitate followup), (2) those who did not have both a height and weight measured during the same hospital encounter, (3) those with an extreme BMI (>200 or <11 kg/m2), (4) encounters where the patient had been pregnant within a year prior to or on the index date, and (5) patients who did not have an eGFR value available in OLIS in the year prior to or on the index date (so that we could categorize their CKD). If there were multiple hospital encounters for a single individual, 1 encounter was selected at random after all exclusion criteria were applied.
We then stratified patients by CKD category. 26 We did this by grouping patients per KDIGO recommendations based upon their eGFR most proximal to the index date (eGFR ≥90 CKD G1, 60-90 CKD G2, 45-60 CKD G3A, 30-45 CKD G3B, 15-30 CKD G4, <15 mL/min/1.73 m2 CKD G5 ND). We placed those with evidence of maintenance dialysis (defined as a code for dialysis within 1 year of the index date using the CORR database) in their own category (CKD 5D), as well as those with a kidney transplant the 5 years prior to the index date using CORR (CKD T) within their own strata. Where patients had evidence of an eligible eGFR, and also used maintenance dialysis or received a kidney transplant prior to the index date, we followed a hierarchy to stratify them (transplant > dialysis > eGFR). In a subgroup who had an ACR available within 1 year of the index date, we also stratified them by CKD risk category for additional analyses (Supplement Table 3).
Exposures
Our primary exposure was CKD as defined by CKD 3A disease or higher. Our secondary exposure was BMI category (underweight to normal [BMI < 25 kg/m2], overweight [BMI 25-29.9 kg/m2], and obese [BMI ≥30 kg/m2]),27,28 with a special focus on those with a BMI ≥30 kg/m2. Where sample size allowed, we further stratified patients in the obese category to class 1 (BMI 30-34.9 kg/m2), class 2 (BMI 35-39.9 kg/m2), and class 3 obesity (BMI ≥40 kg/m2). Although we recognize that BMI has limitations,29-31 it remains widely used as an obesity measure in epidemiological studies and continues to be used across clinical practice guidelines.28,32
Outcomes
Our primary interest was to describe the BMI of patients across CKD categories alongside their characteristics (eg, medical, demographic, socioeconomic). As secondary interests, we followed patients from their index date until the end of the study (January 1, 2022) to summarize: (1) the percentage of those with CKD G3 who had kidney disease progression (50% decline from baseline eGFR) by BMI category, (2) the percentage with CKD G3-4 who developed kidney failure (initiation of maintenance dialysis or an eGFR of <15 mL/min/1.73 m2) by BMI category, (3) the percentage of those with G4, G5ND, and5D who received a kidney transplant by BMI category, and (4) post-transplant outcomes of transplant recipients over the study period. This included the percentage who developed graft failure any time following transplant (ie, graft failure date in CORR), return to maintenance dialysis following transplant (defined by receipt of an OHIP fee code for dialysis), or re-transplant (defined by OHIP fee code for kidney transplant) prior to the study end date.
Statistical Analysis
We used descriptive statistics to summarize baseline characteristics of included patients by CKD stage (and risk category) as well as BMI. We estimated 95% confidence intervals (CIs) using the Wilson score method. Given we expected events to be low in our secondary analyses, we a priori decided to provide crude, unadjusted results (number, %). We conducted all analyses at ICES using SAS version 9.4 (SAS Institute, Cary, North Carolina).
Results
Baseline Characteristics
Our cohort build is illustrated in Supplement Figure 1, and the characteristics of included patients by CKD category are provided in Table 1. As expected, those in higher CKD categories (ie, more advanced disease), had more comorbidities, and used more health care than those with more preserved kidney function. The characteristics of included patients by BMI category are summarized in Supplement Table 4. Those with a BMI ≥30 kg/m2 appeared to have more comorbidities, more often fell into lower income quintiles, and more often lived in rural areas. They also used more health care resources and medications.
Characteristics of Included Patients by CKD Stage.

Note. eGFRs expressed in mL/min/1.73 m2. Values for categorical variables are given as a number (percentage); for continuous variables, as mean ± standard deviation and median (inter-quartile range). For reasons of privacy, tables’ cell sizes less than 6 are not presented. ACEi = angiotensin-converting enzyme inhibitor; ACR = albumin to creatinine ratio; ARB = angiotensin-receptor blocker; CAD = coronary artery disease; CHF = congestive heart failure; CLD = chronic liver disease; CKD = chronic kidney disease; ED = emergency department; GLP-1RA = glucagon-like peptide 1 receptor agonist; HbA1c = glycated hemoglobin; HDL = high-density lipoprotein; LDL = low-density lipoprotein; PCP = primary care provider; RA = rheumatoid arthritis; SGLT-2i = sodium-glucose cotransporter-2 inhibitor; TG = triglycerides.
Rural signifies population <10 000 people.
Marginalization summary score is the average quintile of all 4 marginalization dimensions, a higher score correlates with a greater degree of marginalization.
Not mutually exclusive, patients can be on both peritoneal and hemodialysis.
Included visits to nephrologist, endocrinologist, or cardiologist.
Data from the past 1 year.
Low HDL (high-density lipoprotein) is defined as ≤ 1.3 mmol/L in females and ≤1.0 mmol/L in males.
Elevated TG (triglycerides) is defined as a value ≥ 1.7 mmol/L.
Maximum possible value of 6 (1 for each of: TG ≥ 1.7 mmol/L, HDL ≤ 1.3 mmol/L in females and ≤1.0 mmol/L in males, HbA1c ≥6.5%, diabetes, hypertension, coronary artery disease).
Outcomes
The prevalence of obesity defined using a BMI ≥30 kg/m2 appeared higher in those with CKD G3A category or higher and was particularly prevalent in those with CKD G3-4 (Figure 1). A similar trend was apparent by CKD risk category with the highest prevalence of obesity in the moderate and high-risk CKD categories (50.7% and 49.5% had a BMI ≥30 kg/m2 across groups) (Supplement Figure 2). In post-hoc analysis, we observed that some patients had multiple BMI measures taken over the study accrual period. However, when BMI was averaged per person (ie, mean/median BMI per person), and average values compared with their “index” value, there was no meaningfully difference in BMI measures (Supplement Table 5).
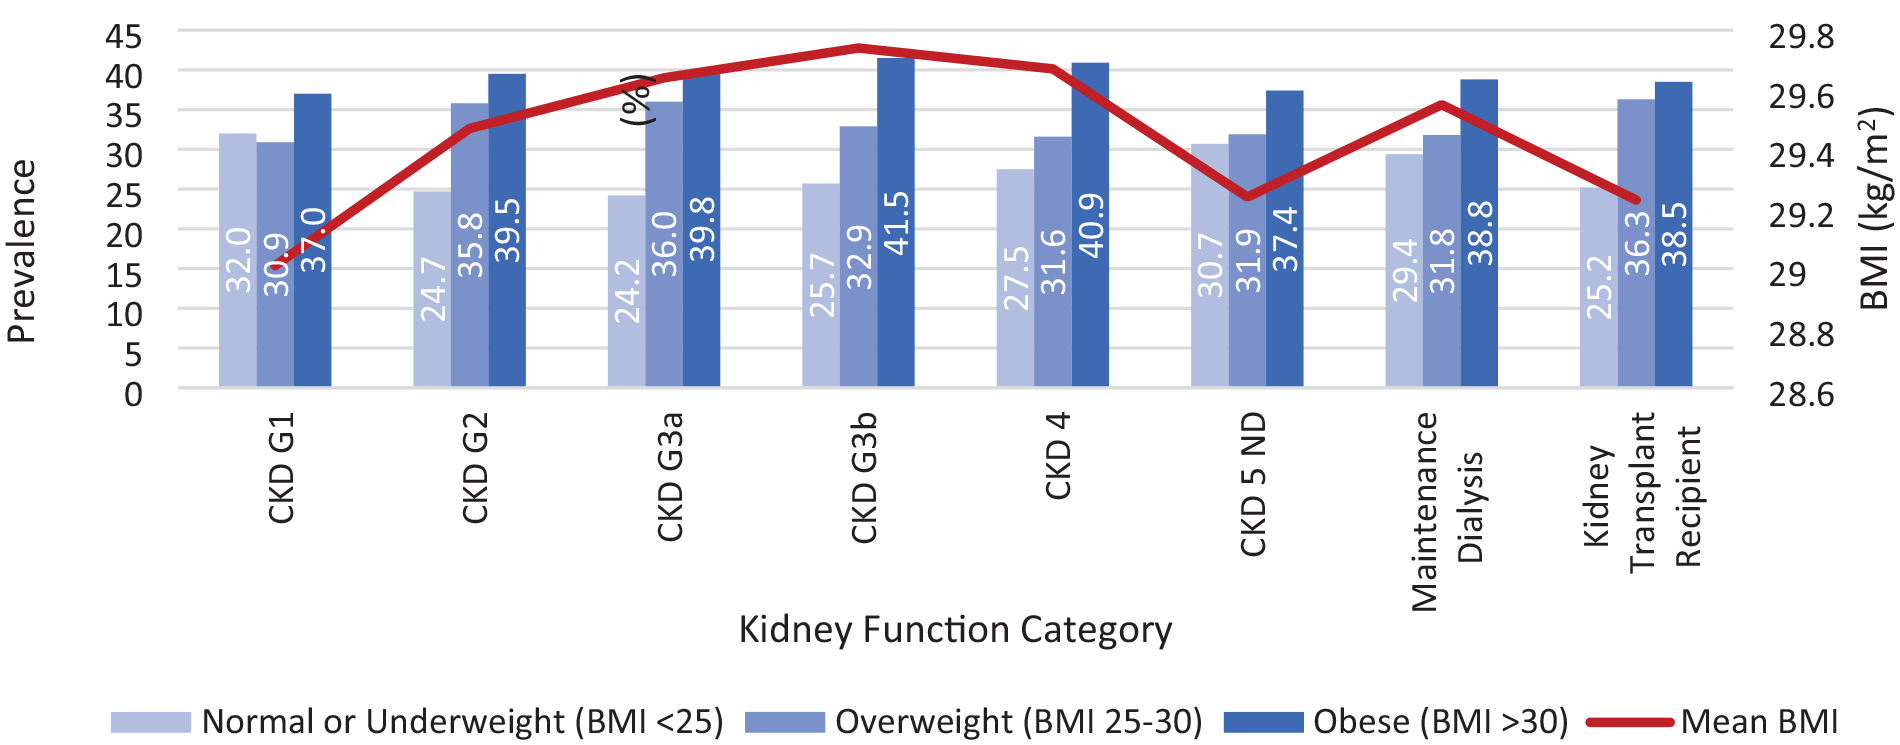
BMI across the kidney disease spectrum.
In secondary analyses (illustrated in Table 2, 3 and Figure 2), we found that in those with CKD G3-4 and BMI ≥30 kg/m2, kidney disease progression appeared more common than in those with lower BMI, particularly in higher obesity classes (Table 2). Those with CKD G5D and a BMI >30 kg/m2 also appeared to receive a transplant less often over the follow-up period (Table 3). Those transplanted with a BMI ≥30 kg/m2 however, appeared to have fewer post transplant complications (Figure 2).
Kidney Outcomes by BMI Category in CKD G3-4.
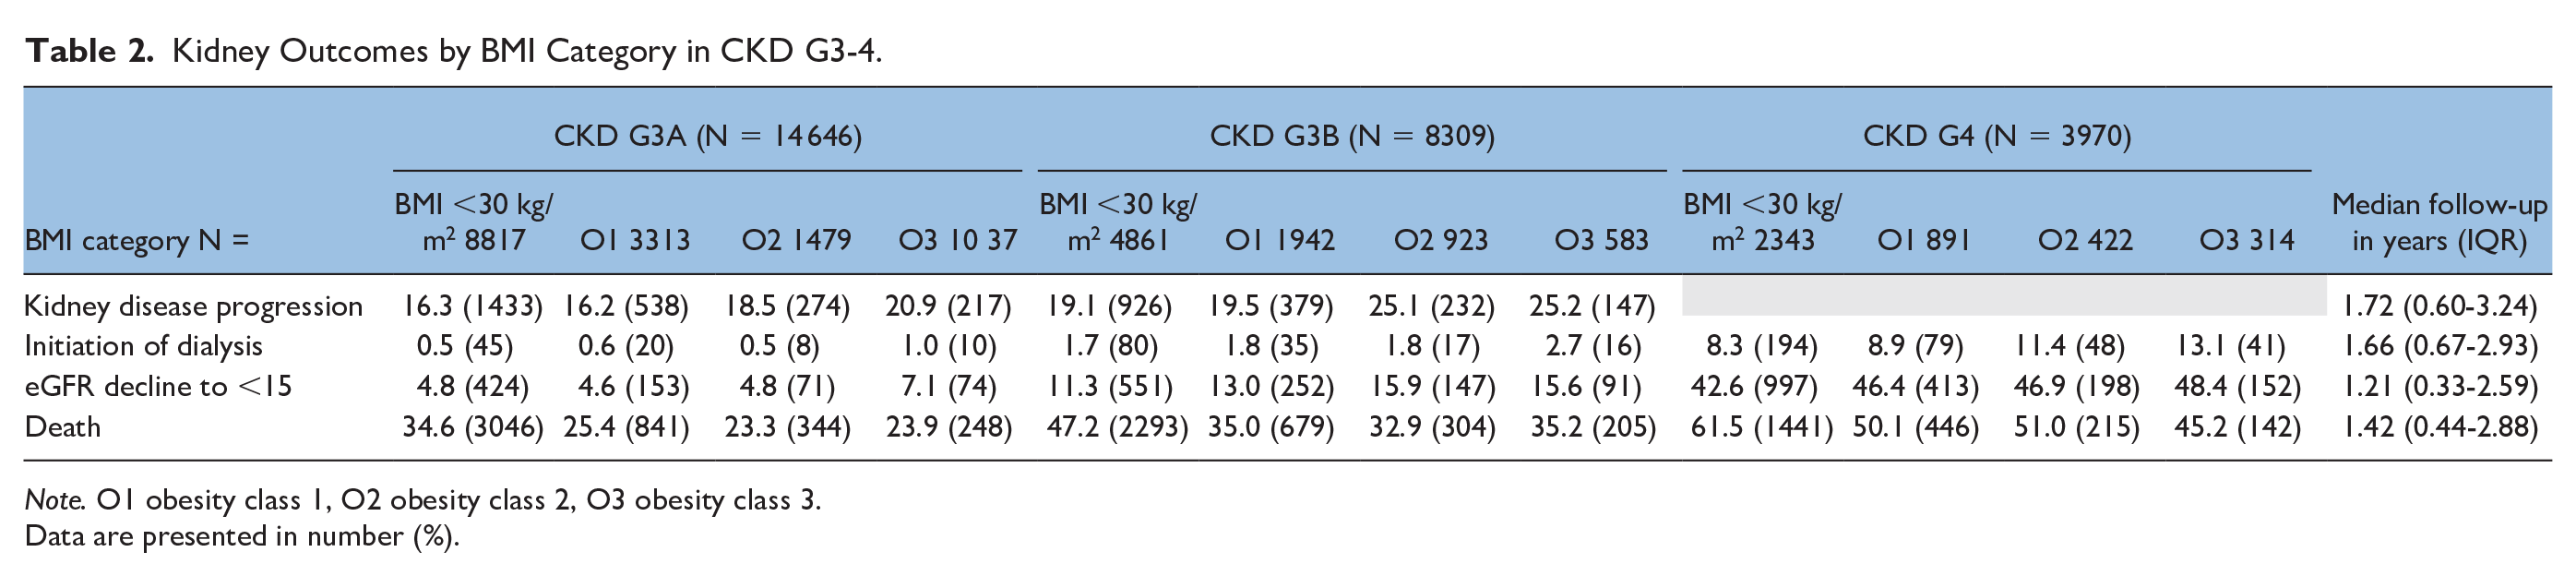
Note. O1 obesity class 1, O2 obesity class 2, O3 obesity class 3.
Data are presented in number (%).
Kidney Transplant Over Follow-up in CKD G4-5 and CKD 5D.

Note. Outcomes are reported as N (%). Patients were stratified into CKD categories using the CKD-EPI equation (2021) 12 to calculate estimated glomerular filtration rate (eGFR) and KDIGO to define CKD stages (ie, 3a: 45-60, 3b: 30-45, 4: 15-30 mL/min/1.73 m2). Although our sample size was small, we also found that in those transplanted over the follow-up period, post-transplant graft failure, return to dialysis, re-transplantation, and death appeared more common among those with a BMI <30 kg/m2 compared with a BMI ≥30 kg/m2.

Post-transplant outcomes in patients who received a new transplant over follow-up by BMI category (n = 459 with BMI <30 kg/m2, n = 287 with BMI ≥30 kg/m2).
In post-hoc analysis, we examined the percentage of patients with CKD G3, G4, G5ND, and CKD 5D who died over follow-up. The overall risk of death appeared to increase as CKD advanced (almost 70% of those with CKD G5ND died over follow-up, Table 2 and 3). Interestingly in our study, those with a BMI ≥30 kg/m2 appeared to have a lower risk of mortality than those with a BMI <30 kg/m2 across the spectrum.
Kidney function and transplant outcomes by BMI and CKD risk category are provided in Supplement Table 6. Findings appeared similar to our primary cohort.
Discussion
In this large cohort study of real-world patients, we observed that over 40% of people with CKD G3-4 have obesity as defined by a BMI ≥30 kg/m2, which was higher than those without CKD (CKD G1-2). This is consistent with prior non-Canadian studies which found that 13% to 53% of people with CKD had high BMI.3,33,34
It is known that people with CKD have concomitant comorbidities including diabetes and heart disease which could contribute to challenges with losing weight or maintaining a healthy weight (eg, limited exercise capacity). 35 In addition, they may have more non-adipose weight (ie, fluid overload, large kidney size in polycystic kidney disease or PCKD), which could increase BMI but not adipose related risk. Obesity itself has also been associated with the progression of CKD, and so reverse causality is a possibility.10,11,36,37 In our cohort, those receiving dialysis or with prior history of transplant appeared to have a lower BMI which could speak to having low muscle mass in CKD 5D which can influence BMI measures.38,39 Sarcopenic obesity occurs when patients have a high body fat percentage with low skeletal muscle mass and muscle function,39,40 and its presence can contribute to the misclassification of obesity when BMI is used as a measure.40,41 Transplant recipients also had a lower BMI, and this may have been due to selection bias (it is known that transplant programs exclude patients with high BMI from receiving a kidney transplant). 1
Additional expected findings were that people with high BMI across the CKD categories appeared to have more health and social challenges; they had a greater number of comorbid conditions, used more medications, and more often lived in lower income neighborhoods than those with a lower BMI. These findings align with the known association between socioeconomic status and obesity. A large epidemiological study in South Korea noted, for example, a relationship between low socioeconomic status and a greater number of comorbidities in those with obesity and CKD. 33 Results remind us of the importance of considering financial constraints and socioeconomic context when designing interventions to support patients with obesity. 42
As observed in other studies, in our secondary analyses of CKD progression across BMI categories, we found that obesity is likely a risk factor.10,11,43 This may be due to changes in renal hemodynamics, activation of the renin-angiotensin-aldosterone system, and the harmful effects of adipokines.9,12 Similar results were observed across CKD risk categories. In those with CKD approaching dialysis, BMI might have been influenced by volume overload which may have been an indication to transition to dialysis.
Following transplant, additional interesting trends were observed. There appeared to be less graft failure and return to dialysis among those with a higher BMI, out of keeping with prior studies.16,44,45 It could be that these patients were particularly well selected to receive a transplant (as physicians and surgeons were aware of the potential risks of offering a kidney to those with an already high BMI). Perhaps factors such as time on dialysis pre-transplant played a role. Those with a higher BMI, who were transplanted, may also have been at lower risk of sarcopenia which has also been associated with lower rates of graft survival.46-48
Although post-hoc analyses, it is important to draw attention to the mortality risk of patients with CKD across the BMI spectrum. Although we observed that the risk of mortality increased by CKD category (a well-described relationship), 49 high BMI actually appeared “protective” in our study. This “obesity-paradox” has been described in other studies, particularly in end-staged kidney disease. The exact mechanism is unclear, but several have been postulated by Kovesdy et al 43 and Hung et al. 50 Higher BMI might be associated with better nutrition (those with advanced CKD and dialysis are prone to malnutrition). A higher BMI may reflect greater muscle mass, which is associated with better outcomes in those with CKD. Those with obesity may have lower metabolic rates, which may be protective in the catabolic state often seen in advanced CKD. In advanced CKD, higher BMI has been associated with higher hemoglobin levels, which may contribute to better outcomes. These secondary and post-hoc analyses, however, do need to be interpreted cautiously as analyses were not adjusted and limited by sample size.
Larger studies are needed to explore all findings and in end-staged kidney disease and dialysis, we need more understanding of whether reducing BMI is appropriate for all patients. We conducted a large cohort study using linked hospital, administrative, and laboratory data. We provide a contemporary view on the epidemiology and outcomes associated with high BMI in people with CKD as defined by both eGFR and CKD risk category. We do recognize that in this study, we used BMI as an obesity measure; it has limitations, especially in people with CKD. The BMI may have missed an obesity diagnosis for a significant proportion of patients. 29 Thus, our prevalence estimates of “true obesity” could have been underestimated. However, in routine care, BMI remains a widely used tool for counseling and clinical decision-making (eg, listing patients for transplant). Other anthropometric measurements, especially those that consider central fat distribution, may have a better association with morbidity and mortality risk and could be helpful to examine more rigorously in this patient population.30,31 Furthermore, as we relied upon heights and weight captured in routine care, we could not examine whether some patients had weight measured before or after their dialysis session (dry weight measurements are suggested). We also acknowledge that some causes of CKD such as autosomal dominant PCKD can cause patients to have very large kidneys, which can significantly contribute to their weight. 51 Although we used a single eGFR measure to stratify patients into CKD categories, this method allowed for us to include a larger cohort of patients and is still acceptable and well validated. 52 As we also chose the eGFR most proximal to the hospital encounter, we do not expect any misclassification across CKD categories. We do recognize that the study was conducted during the pandemic, and so the outcomes of those who were followed from March 2020 onward could have been affected. Finally, our outcome estimates were not adjusted due to small sample sizes, and event rates were impacted by death as a competing interest (particularly in dialysis).
Conclusions
Obesity is highly prevalent in people with CKD. The results of this study heighten awareness of this comorbidity, the characteristics of those with CKD and obesity, and obesity’s potential consequences on disease progression and transplant access. Our work highlights that obesity needs to be a focus of conversation. This study may assist care providers in providing counseling about BMI, transplant clinics, and policymakers in resource planning in a public health care system (ie, potential need for clinical supports for a growing population), and may be valuable to researchers who can use results to help design and tailor obesity interventions.
Supplemental Material
sj-docx-1-cjk-10.1177_20543581241293199 – Supplemental material for Prevalence, Characteristics, and Outcomes of People With A High Body Mass Index Across the Kidney Disease Spectrum: A Population-Based Cohort Study
Supplemental material, sj-docx-1-cjk-10.1177_20543581241293199 for Prevalence, Characteristics, and Outcomes of People With A High Body Mass Index Across the Kidney Disease Spectrum: A Population-Based Cohort Study by Gurleen Sahi, Jennifer Reid, Louise Moist, Michael Chiu, Amanda Vinson, Saverio Stranges, Kyla Naylor, Yunxu Zhu and Kristin K. Clemens in Canadian Journal of Kidney Health and Disease
Footnotes
Acknowledgements
The authors thank the team at London Health Sciences Centre and St. Joseph’s Health Care for providing access to the Cerner database. The authors also thank IQVIA Solutions Canada Inc, for use of their Drug Information File. The authors also thank the Toronto Community Health Profiles Partnership for providing access to the Ontario Marginalization Index.
Ethics Approval and Consent to Participate
The use of ICES data in this project was authorized under section 45 of Ontario’s Personal Health Information Protection Act (PHIPA) which does not require informed consent or review by a Research Ethics Board.
Consent for Publication
Consent for publication was obtained from all authors.
Availability of Data and Materials
Not applicable.
Author Contributions
G.S. helped to design the study, draft the protocol, interpret results, and she prepared the manuscript. M.C., L.M., S.S., K.N., and A.V. assisted with the design of the study review of the manuscript. J.R. assisted with the design of the study, the analysis, the interpretation of data and manuscript preparation. Y.Z. assisted with the presentation of results, interpretation of data, and the drafting of the manuscript. K.K.C. conceptualized and helped design the study and protocol, interpreted results and drafted and reviewed the manuscript, and provided student supervision.
Declaration of Conflicting Interests
The author(s) declared the following potential conflicts of interest with respect to the research, authorship, and/or publication of this article: K.K.C. and L.M. have received honoraria for delivering certified medical education from the CPD Network and the Canadian Medical and Surgical Knowledge Translation Research Group. There are no other conflicts of interest to disclose.
Funding
The author(s) disclosed receipt of the following financial support for the research, authorship, and/or publication of this article: This study was supported by ICES, which is funded by an annual grant from the Ontario Ministry of Health (MOH) and the Ministry of Long-Term Care (MLTC). This study also received funding from a Collaborative Research Seed Grant (Schulich School of Medicine and Dentistry). G.S. received support to conduct this research from the Summer Research Training Program (Schulich School of Medicine and Dentistry). This document used data adapted from the Statistics Canada Postal CodeOM Conversion File, which is based on data licensed from Canada Post Corporation, and/or data adapted from the Ontario Ministry of Health Postal Code Conversion File, which contains data copied under license from Canada Post Corporation and Statistics Canada. Parts of this material are based on data and information compiled and provided by the Ontario Ministry of Health and the Canadian Institute of Health Information. The analyses, conclusions, opinions, and statements expressed herein are solely those of the authors and do not reflect those of the funding or data sources; no endorsement is intended or should be inferred.
Supplemental Material
Supplemental material for this article is available online.
References
Supplementary Material
Please find the following supplemental material available below.
For Open Access articles published under a Creative Commons License, all supplemental material carries the same license as the article it is associated with.
For non-Open Access articles published, all supplemental material carries a non-exclusive license, and permission requests for re-use of supplemental material or any part of supplemental material shall be sent directly to the copyright owner as specified in the copyright notice associated with the article.