
Abstract
Background:
Eligible patients with kidney failure should have equal access to kidney transplantation. Transplant referral is the first crucial step toward receiving a kidney transplant; however, studies suggest substantial variation in the rate of kidney transplant referral across regions. The province of Ontario, Canada, has a public, single-payer health care system with 27 regional chronic kidney disease (CKD) programs. The probability of being referred for kidney transplant may not be equal across CKD programs.
Objective:
To determine whether there is variability in kidney transplant referral rates across Ontario’s CKD programs.
Design:
Population-based cohort study using linked administrative health care databases from January 1, 2013, to November 1, 2016.
Setting:
Twenty-seven regional CKD programs in the province of Ontario, Canada.
Patients:
Patients approaching the need for dialysis (advanced CKD) and patients receiving maintenance dialysis (maximum follow-up: November 1, 2017).
Measurements:
Kidney transplant referral.
Methods:
We calculated the 1-year unadjusted cumulative probability of kidney transplant referral for Ontario’s 27 CKD programs using the complement of Kaplan-Meier estimator. We calculated standardized referral ratios (SRRs) for each CKD program, using expected referrals from a 2-staged Cox proportional hazards model, adjusting for patient characteristics in the first stage. Standardized referral ratios with a value less than 1 were below the provincial average (maximum possible follow-up of 4 years 10 months). In an additional analysis, we grouped CKD programs according to 5 geographic regions.
Results:
Among 8641 patients with advanced CKD, the 1-year cumulative probability of kidney transplant referral ranged from 0.9% (95% confidence interval [CI]: 0.2%-3.7%) to 21.0% (95% CI: 17.5%-25.2%) across the 27 CKD programs. The adjusted SRR ranged from 0.2 (95% CI: 0.1-0.4) to 4.2 (95% CI: 2.1-7.5). Among 6852 patients receiving maintenance dialysis, the 1-year cumulative probability of transplant referral ranged from 6.4% (95% CI: 4.0%-10.2%) to 34.5% (95% CI: 29.5%-40.1%) across CKD programs. The adjusted SRR ranged from 0.2 (95% CI: 0.1-0.3) to 1.8 (95% CI: 1.6-2.1). When we grouped CKD programs according to geographic region, we found that patients residing in Northern regions had a substantially lower 1-year cumulative probability of transplant referral.
Limitations:
Our cumulative probability estimates only captured referrals within the first year of advanced CKD or maintenance dialysis initiation.
Conclusions:
There is marked variability in the probability of kidney transplant referral across CKD programs operating in a publicly funded health care system.
Introduction
A kidney transplant is the best treatment option for eligible patients with kidney failure.1 -4 However, many patients with kidney failure are never considered for transplantation. 5 The transplant process involves multiple steps, beginning with transplant education, consideration of eligibility by the health care team, transplant referral, evaluation, final disposition, wait-listing or approval for living donor kidney transplantation, and eventual transplantation. Each step of a patient’s journey to transplant can be affected by health system–level barriers, resulting in inefficiencies and inequity in access to transplantation.6 -8
In the Canadian province of Ontario, there are 27 regional chronic kidney disease (CKD) programs that care for more than 15 000 patients approaching the need for dialysis (ie, end-stage kidney disease [ESKD]) and 12 500 patients receiving maintenance dialysis. 9 Each CKD program refers patients for transplant to 1 of 6 adult kidney transplant centers. A key step in the process to receiving a transplant is transplant referral, which is largely under the influence of health care providers at CKD programs. Regional variability in transplant referral rates has been found in countries with private and publicly funded health care systems.10 -12 For example, Patzer et al. reported substantial variation in kidney transplant referral rates across dialysis facilities in Georgia, United States, ranging from 0% to 75%. 12 In Canada, transplant referral rates have been found to vary more than 3-fold across provinces, with Ontario and Atlantic provinces having the lowest rates of referral. 10 As provinces in Canada each organize and deliver care independently, activities that evaluate the quality of care and adopt solutions to improve it are done at the provincial level. Transplant referral rates have not been evaluated across CKD programs within an individual Canadian province. Building upon our previous work that demonstrated variability in kidney transplant rates across CKD programs in Ontario, 8 we conducted this study to determine whether there is variation in kidney transplant referral rates across Ontario’s 27 CKD programs.
Methods
Design and Setting
We conducted a population-based cohort study using administrative health care databases held at ICES (ices.on.ca) (Ontario, Canada). These data sets were linked using unique encoded identifiers and analyzed at ICES. The use of data in this project was authorized under section 45 of Ontario’s Personal Health Information Protection Act, which does not require review by a Research Ethics Board. We received research ethics board approval to use linked Trillium Gift of Life Network data, described below (Western University’s Research Ethics Board Institutional Review Board Approval No 108408). The reporting of this study followed the REporting of studies Conducted using Observational Routinely collected health Data guidelines for observational studies (RECORD) (Supplemental Table S1). 13
Data Sources
We used several linked databases to assess baseline characteristics and outcomes. The Ontario Renal Network’s Ontario Renal Reporting System identifies patients approaching the need for dialysis (ie, advanced CKD) and patients receiving maintenance dialysis. The Ontario Laboratories Information System records serum creatinine and urine albumin-to-creatinine ratio measurements. The Trillium Gift of Life Network database records kidney transplant referrals (Trillium Gift of Life Network is Ontario’s organ and tissue donation agency).
Vital status and demographics are recorded in the Registered Persons Database, and solid organ transplant recipients in the Canadian Organ Replacement Register. Information on procedural and diagnostic events that occur in hospitals is available through the Canadian Institute for Health Information Discharge Abstract Database and Same Day Surgery, while information on emergency department visits is contained in the National Ambulatory Care Reporting System. The Ontario Health Insurance Plan database records claims for physician health services. Supplemental Table S2 contains further information on the databases and coding definitions used. The only reason for loss to follow-up in our databases is emigration from the province (<0.5% annually). 14
Study Populations
Advanced CKD
We included individuals who received kidney health services from one of Ontario’s 27 regional CKD programs’ Multi-Care Kidney Clinics (MCKCs) (ie, clinics that provide care to patients with advanced CKD) from January 1, 2013, to November 1, 2016, and had laboratory measurements indicating they were at high risk of requiring kidney replacement therapy. Kidney function criteria used in Ontario to define high-risk patients who should be considered for kidney transplant referral were 15 (1) evidence of at least 2 estimated glomerular filtration rate (eGFR) values ≤15 mL/min/1.73 m2 separated by at least 2 weeks but not more than 12 months (to ensure stability of kidney function) or (2) two 2-year kidney failure risk equation (KFRE) measures ≥25% separated by at least 2 weeks and no more than 12 months. 16 The eGFR was calculated using the CKD Epidemiology Collaboration equation; 17 all patients were assumed to not be Black (Black Ontarians represent 4.7% of the population). 18 At the time of this study, clinicians were making decisions based on this equation.
We defined the index date (cohort entry date) as the MCKC visit date (ie, laboratory criteria were satisfied before the MCKC visit) or the second qualifying laboratory date (ie, laboratory criteria satisfied after MCKC visit). Multi-Care Kidney Clinic visits had to be within 18 months of satisfying the laboratory criteria to ensure the patient was receiving care within a CKD program. We excluded the following individuals: aged <18 or ≥80 years (pediatric patients frequently have different health care providers and it is rare for a patient ≥80 years to receive a kidney transplant), evidence of maintenance dialysis 30 days to 6 months prior to cohort entry (including evidence of inclusion in the maintenance dialysis cohort, described below), prior solid organ transplant (including kidney transplant) and receipt of a kidney transplant on or within 90 days after cohort entry, a history of a kidney transplant referral, or evidence of a major recorded contraindication to kidney transplant (ie, living in a long-term care residence, a diagnosis of dementia, or home oxygen use).
Maintenance dialysis
We included individuals who received maintenance dialysis in Ontario from January 1, 2013, to November 1, 2016. The index date was the date of dialysis initiation date + 30 days to ensure individuals remained dialysis-dependent and dialysis use was not temporary for acute kidney injury. We used the same exclusion criteria as described in the advanced CKD cohort.
Referral for Kidney Transplantation
Our primary outcome was referral for kidney transplantation within 1 year of cohort entry. Although there is no national benchmark for the optimal timing of recipient referral, it is generally accepted that most referrals should occur within 1 year of a patient developing ESKD to ensure timely access to appropriate care.12,19 In Ontario, kidney transplant referral is defined as the date 1 of the 6 Ontario kidney transplant centers acknowledges receipt of an individual’s complete transplant referral package from the CKD program.
To ensure we were not missing any referrals, our outcome definition included individuals who received a kidney transplant without evidence of a kidney transplant referral during follow-up; we defined the referral date in these patients as the kidney transplant date minus 90 days. Unlike in the United States, a portion of the evaluation for kidney transplantation (eg, cardiac testing) in Ontario patients must be completed by the CKD programs prior to the transplant referral (a comprehensive set of clinical information and testing that must be completed for a referral to be accepted is shown in Supplemental Table S3). Therefore, the date of referral does not indicate the date that the evaluation for kidney transplantation started; rather, it indicates the date the transplant center receives the referral along with a set of completed tests. After they receive a referral, the transplant center organizes additional testing and consultations to help determine whether the patient is eligible for kidney transplantation, and if so, prepares the patient to receive a living kidney donor transplant or to be placed on the deceased donor kidney transplant waiting list.
CKD Programs
The Ontario Renal Network (part of Ontario Health) is a provincial government agency responsible for managing the delivery of kidney services across Ontario (population 14.6 million). 20 There are 27 CKD Programs overseeing 27 MCKCs, 27 home dialysis programs, and more than 100 hemodialysis units. We stratified our results by the 27 CKD programs, assigning a random number in lieu of the program name to ensure anonymity. Prior to April 2018, there were 26 CKD programs; however, in 2018 one of the programs became two (Orillia Soldier’s Memorial and Royal Victoria Hospital separated into 2 CKD programs) and they are evaluated separately in this study. We assigned patients to the CKD program where they initiated advanced CKD/dialysis care. Previous work found that <10% of patients switched CKD programs over the first year of follow-up. 8 To further understand potential variability in transplant access across the province, we completed 2 additional analyses. We grouped the 27 CKD programs by 5 geographic regions (North, East, West, Central, and Toronto) in Ontario that provide integrated health care services and by tertile of patient volume (ie, lowest, middle, and highest number of patients cared for within the CKD program).21,22
Statistical Analysis
We presented baseline characteristics as medians (25th, 75th percentile) for continuous variables and as counts and proportions for categorical variables. We calculated the 1-year unadjusted cumulative probability (95% confidence interval [CI]) of kidney transplant referral using the complement of the Kaplan-Meier product limit estimator. We censored the follow-up time of patients when they died, became 80 years of age, recovered kidney function, or reached 1 year of follow-up (maximum follow-up date: November 1, 2017). In the advanced CKD cohort, we also censored the follow-up time when they initiated maintenance dialysis. For the advanced CKD cohort, if a patient entered the cohort through eGFR criteria, kidney function recovery was defined as 2 eGFR measurements > 25 mL/min/1.73 m2 that were separated by at least 2 weeks and no more than 12 months. If a patient entered the cohort through KFRE criteria, kidney function recovery was defined as 2 KFRE measures <10%, separated by at least 2 weeks but no more than 12 months. For both the advanced CKD and maintenance dialysis cohorts, recovered kidney function was also recorded in the Ontario Renal Reporting System. To compare baseline characteristics across programs, we categorized CKD programs into tertiles based on the 1-year cumulative probability of transplant referral. We used the Kruskal-Wallis test and the χ2 test to compare continuous and categorical variables across tertiles, respectively.
We calculated standardized referral ratios (SRRs) to compare the observed number of kidney transplant referrals with the expected number of referrals for the average Ontario patient approaching the need for dialysis (ie, advanced CKD) or patients receiving maintenance dialysis. We calculated the expected number of referrals in each program using a 2-staged Cox proportional hazards model.12,23 -25 In the first stage, the Cox model was stratified by CKD program and adjusted for patient-level covariates. Stratification was included to ensure that the baseline survival probabilities accounted for the program-level differences. 24 In the second stage, the predicted values from the first stage were included as an offset in an unstratified Cox model. The program’s expected number of referrals was then calculated by summing the Martingale residuals from the second stage. Finally, the SRR was then estimated using a ratio of the observed to expected referrals in each program. An SRR of 1.0 indicates the program has the same referral rate as the provincial rate; a value above 1.0 means the referral rate is higher than the provincial rate, and a value below 1.0 means the referral rate is below the provincial rate. We calculated unadjusted and adjusted SRRs (95% CI). 24 Censoring events are as described above; however, patients in this analysis could be followed for more than 1 year with a maximum possible follow-up of 4 years 10 months (maximum available follow-up based on data availability at the time of analysis). We followed patients for more than 1 year in the SRR analysis as several CKD programs had fewer than 6 referrals during follow-up and small numbers could disproportionately affect the estimate of the expected number of referrals. We excluded any CKD program that had <6 incident patients per year. For the adjusted SRRs, the first-stage model accounted for the following patient characteristics: age, sex, calendar year (2013, 2014, 2015, and 2016), race (information is collected by data leads in each CKD program based on clinical staff charting who may ask a patient to self-identify their ethnicity but were not mandated to do so; White, Asian, Black, Other/Multiracial, unknown/missing), diabetes, Charlson comorbidity score, body mass index, average neighborhood income quintile, and rural residence (ie, population <10 000). In the maintenance dialysis cohort, we also adjusted for cause of ESKD (glomerulonephritis/autoimmune, cystic kidney disease, diabetes, renal vascular disease, other, missing) and dialysis modality (hemodialysis, peritoneal dialysis), whereas in the advanced CKD cohort we also adjusted for the eGFR and the KFRE estimate. 24
Data were complete except for the following variables: income quintile (<0.5%; imputed quintile 3), rural residence (<0.5%; imputed urban residence), race (7.0% advanced CKD, 2.5% dialysis; kept the missing category), body mass index (7.1% advanced CKD, 3.0% dialysis; imputed age- and sex-weighted median), and cause of ESKD (8.8%; kept the missing category). All analyses were conducted using SAS version 9.4 (SAS Institute, Cary, North Carolina). As this study was descriptive in nature, we did not adjust P values or CIs widths for multiple testing. 26
Results
We included 8641 patients in the advanced CKD cohort (Supplemental Figure S1) and 6852 patients in the maintenance dialysis cohort (Supplemental Figure S2). Table 1 displays the baseline characteristics for both groups. In the advanced CKD cohort, the median age was 65 years, 39% were women, and 64% had diabetes. In the maintenance dialysis cohort, the median age was 64 years, 36% were women, and 63% had diabetes.
Baseline Characteristics for Advanced CKD and Maintenance Dialysis Cohorts.

Note. Data presented as number (percentage) or median (25th, 75th percentile). CKD = chronic kidney disease.
Income was characterized according to fifths of average neighborhood income.
Rural residence defined as a population <10 000.
Comorbidities were assessed 5 years prior to the date of cohort entry unless otherwise indicated.
Patients with a Charlson comorbidity index of 0 were given a score of 2 and patients with a score of 1 were given a score of 3; presence of kidney disease is a variable in the Charlson that automatically results in all patients in our cohort receiving a score of 2.
Hypertension and diabetes defined as the presence of either 2 Ontario Health Insurance Plan codes or 1 hospitalization with a diagnosis of hypertension or diabetes, in the 3 years prior to entry.
One-Year Cumulative Probability of Kidney Transplant Referral
Advanced CKD cohort
During the 1-year study follow-up period, in the advanced CKD cohort, 552 (6.4%) patients were referred for transplant, 433 (5.0%) patients died, 238 (2.8%) patients turned 80 years of age, 280 (3.2%) patients recovered kidney function and 1782 (20.6%) patients transitioned to maintenance dialysis. The overall 1-year cumulative probability of kidney transplant referral in the advanced CKD cohort was 7.6% (95% CI: 7.0%-8.2%) and varied widely across CKD programs, ranging from 0.9% (95% CI: 0.2%-3.7%) to 21.0% (95% CI: 17.5%-25.2%) (Figure 1). When analyzed by the 5 Ontario regions, patients with advanced CKD residing in Northern Ontario had the lowest 1-year cumulative probability of kidney transplant referral (2.5%; 95% CI: 1.5%-4.3%) compared with patients residing in Eastern Ontario which had the highest (9.4%; 95% CI: 8.2%-10.9%) (Table 2). When analyzed by CKD program patient volume, patients with advanced CKD in programs with the highest patient volume had the highest 1-year cumulative probability of referral (9.3%; 95% CI: 8.5%-10.3%) (Table 3).
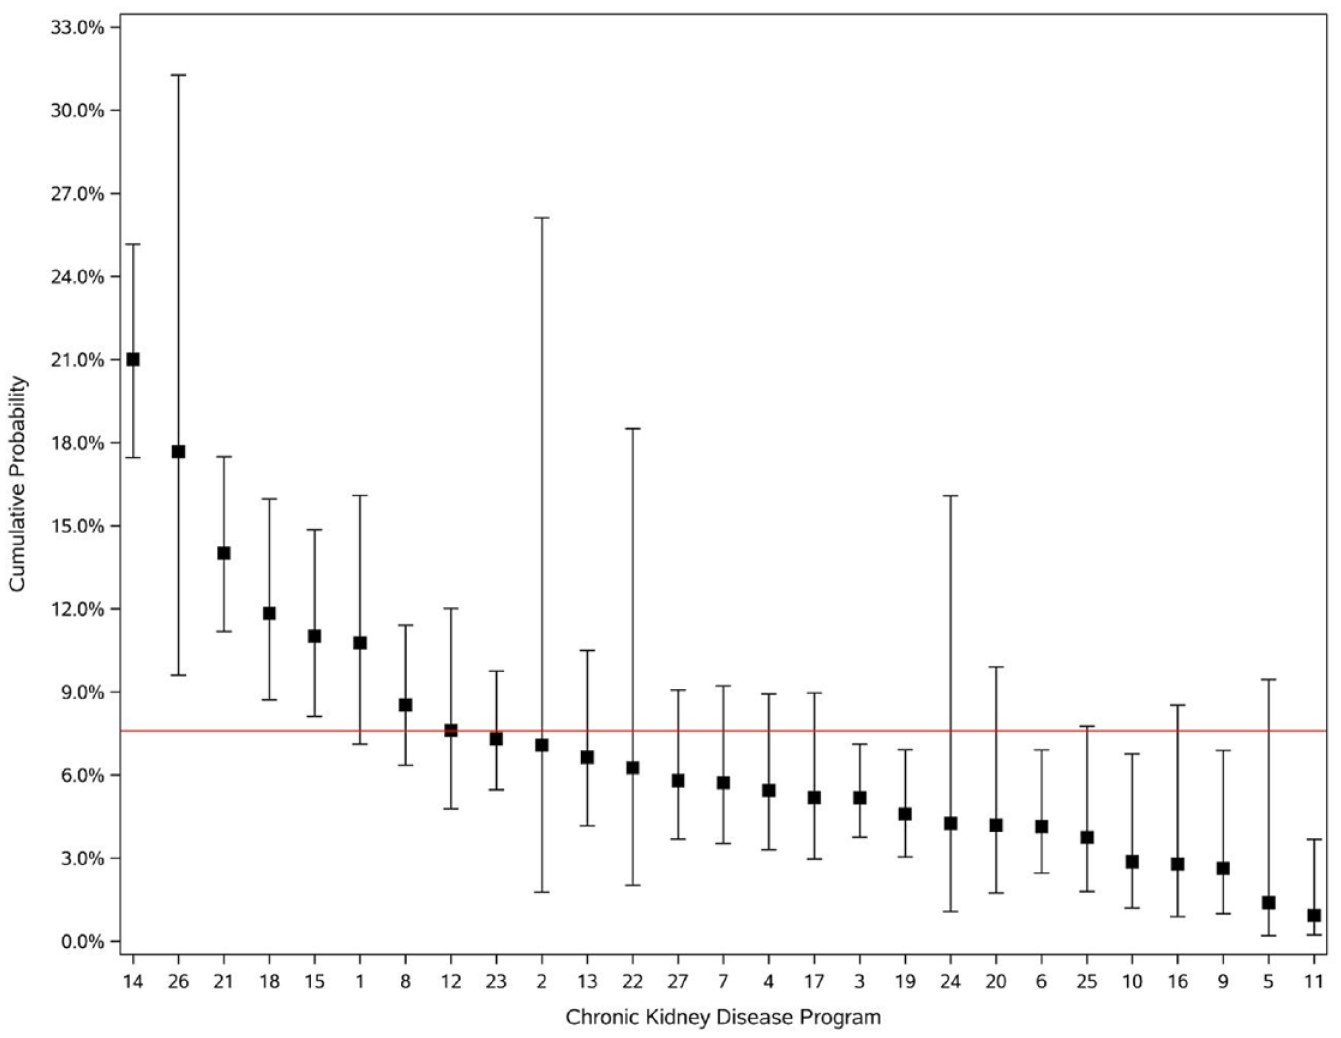
One-year cumulative probability of kidney transplant referral in the advanced chronic kidney disease cohort (n = 8641) displayed by chronic kidney disease program.
One-Year Cumulative Probability of Kidney Transplant Referral and Adjusted Standardized Referral Ratios in Patients With Advanced CKD According to 5 Ontario Geographic Regions.

Note. CKD = chronic kidney disease; CI = confidence interval.
One-Year Cumulative Probability of Kidney Transplant Referral and Adjusted Standardized Referral Ratios in Patients With Advanced CKD According to CKD Program Patient Volume.

Note. CKD = chronic kidney disease; CI = confidence interval.
Number in bracket represents the average number of patients in each group.
Maintenance dialysis cohort
During the 1-year study follow-up period, in the maintenance dialysis cohort, 1432 (20.9%) patients were referred for transplant, 810 (11.8%) died, 192 (2.8%) turned 80 years of age, and 337 (4.9%) recovered kidney function. The overall 1-year cumulative probability of kidney transplant referral in the maintenance dialysis cohort was 24.0% (95% CI: 23.0%-25.1%) and varied widely across CKD programs from 6.4% (95% CI: 4.0%-10.2%) to 34.5% (95% CI: 29.5%-40.1%) (Figure 2). When analyzed by the 5 Ontario regions, patients receiving maintenance dialysis residing in Northern Ontario had the lowest 1-year cumulative probability of kidney transplant referral (11.1%; 95% CI: 8.7%-14.0%) compared with Toronto that had the highest (27.5%; 95% CI: 24.4%-30.8%) (Table 4). When analyzed by CKD program patient volume, patients receiving maintenance dialysis in CKD programs with the highest patient volume had the highest 1-year cumulative probability of referral (Table 5). Less than 3% of all transplant referrals in the advanced CKD and maintenance dialysis cohorts came from patients who received a transplant without any evidence of a transplant referral.

One-year cumulative probability of kidney transplant referral in the maintenance dialysis cohort (n = 6852) displayed by chronic kidney disease program.
One-Year Cumulative Probability of Kidney Transplant Referral and Adjusted Standardized Referral Ratios in Patients Receiving Maintenance Dialysis According to 5 Ontario Geographic Regions.

Note. CI = confidence interval.
One-Year Cumulative Probability of Kidney Transplant Referral and Adjusted Standardized Referral Ratios in Patients Receiving Maintenance Dialysis According to CKD Program Patient Volume.

Note. CKD = chronic kidney disease; CI = confidence interval.
Number in bracket represents the average number of patients in each group.
Baseline Characteristics for CKD Programs With the Lowest, Middle, and Highest 1-Year Cumulative Probability of Transplant Referral
When we categorized CKD programs into tertiles of lowest, middle, and highest transplant referral (Table 6 for advanced CKD and Table 7 for maintenance dialysis), we found several differences in patient characteristics across tertiles. However, the absolute differences were often small. There was a substantial difference across tertiles for patients living in a rural location (population less than 10 000). For example, in the advanced CKD cohort, the proportion of individuals who lived in a rural location was 26.7% in the lowest tertile CKD programs compared with 10.9% in the highest tertile CKD programs (P < .001).
Baseline Characteristics in the Advanced CKD Cohort for CKD Programs With the Lowest, Middle, and Highest 1-Year Cumulative Probability of Transplant Referral.

Note. Data presented as number (percentage) or median (25th, 75th percentile). CKD = chronic kidney disease.
Kruskal-Wallis test to compare continuous variables and the χ2 test for categorical variables.
Income was characterized according to fifths of average neighborhood income. Missing values (<0.5%) were categorized as quintile 3.
Rural residence defined as a population <10 000.
Comorbidities were assessed 5 years prior to the date of cohort entry.
Patients with a Charlson comorbidity index of 0 were given a score of 2 and patients with a score of 1 were given a score of 3; presence of kidney disease is a variable in the Charlson that automatically results in all patients in our cohort receiving a score of 2.
Hypertension and diabetes defined as the presence of either 2 Ontario Health Insurance Plan codes or 1 hospitalization with a diagnosis of hypertension or diabetes, in the 3 years prior to entry.
Baseline Characteristics in the Maintenance Dialysis Cohort for Chronic Kidney Disease Programs With the Lowest, Middle, and Highest Cumulative Probability of Transplant Referral.

Note. Data presented as number (percentage) or median (25th, 75th percentile).
Kruskal-Wallis test to compare continuous variables and the χ2 test for categorical variables.
Income was characterized according to fifths of average neighborhood income. Missing values (<0.5%) were categorized as quintile 3.
Rural residence defined as a population < 10 000.
Comorbidities were assessed 5 years prior to the date of cohort entry.
Patients with a Charlson comorbidity index of 0 were given a score of 2 and patients with a score of 1 were given a score of 3; presence of kidney disease is a variable in the Charlson that automatically results in all patients in our cohort receiving a score of 2.
Hypertension and diabetes defined as the presence of either 2 Ontario Health Insurance Plan codes or 1 hospitalization with a diagnosis of hypertension or diabetes, in the 3 years prior to entry.
Standardized Referral Ratio
Over a median (25th, 75th percentile) follow-up of 1.3 years (0.6, 2.3), the adjusted SRR in the advanced CKD cohort ranged from 0.2 (95% CI: 0.1-0.4) to 4.2 (95% CI: 2.1-7.5) across CKD programs (Figure 3). Over a similar follow-up period, the adjusted SRR in the maintenance dialysis cohort ranged from 0.2 (95% CI: 0.1-0.3) to 1.8 (95% CI: 1.6-2.1) across CKD programs (Figure 4). When examined by the 5 Ontario regions, the adjusted SRR in patients with advanced CKD was lowest in Northern Ontario (0.46, 95% CI: 0.31-0.65) and highest in Eastern Ontario (1.37, 95% CI: 1.21-1.55) (Table 2). In patients receiving maintenance dialysis, the adjusted SRR was lowest in Northern Ontario (0.42, 95% CI: 0.34-0.51) and highest in Western Ontario (1.12, 95% CI: 1.02-1.22) (Table 4). When examined by CKD program patient volume, the adjusted SRR in patients with advanced CKD was highest in programs with the highest patient volume (SRR: 1.22, 95% CI: 1.13-1.32) (Table 3). Similarly, in patients receiving maintenance dialysis, the adjusted SRR was highest in programs with the highest patient volume (SRR: 1.14, 95% CI: 1.08-1.21) (Table 5).

Adjusted standardized referral ratios in the advanced chronic kidney disease cohort (n = 8641) displayed by chronic kidney disease program.

Adjusted standardized referral ratio in the maintenance dialysis cohort (n = 6852) displayed by chronic kidney disease program.
Discussion
Across 27 CKD programs in the province of Ontario, Canada, where universal health care is publicly funded, we found substantial variation in the 1-year cumulative probability of kidney transplant referral in the advanced CKD and maintenance dialysis populations, which persisted even after adjusting for patient demographics and comorbidities. We found that patients residing in Northern Ontario consistently had a substantially lower probability of referral.
There are several potential reasons for the observed variability in transplant referral rates across CKD programs. At the provider level, transplant knowledge and familiarity with eligibility criteria could affect referral practices.27,28 Providers may find it challenging to prioritize transplant discussions among competing priorities in caring for patients with kidney failure. At the CKD program level, varying levels of support for managing transplant referrals may impact the timeliness of referrals. For example, some programs may have a dedicated referral coordinator that initiates the referral and organizes referral testing, while others may rely on the nephrologist or nursing staff. The effectiveness of transplant education may differ across programs. Some programs may benefit from consistent and dedicated health professional transplant champions, whereas others may have difficulties with staff turnover. At the provincial level, government policies defining compensation for transplant-related activity may prevent CKD program administrators from advancing initiatives to increase referral rates. Finally, it is possible that there are unmeasured patient-level factors that affect transplant referral, such as smoking, or ethnocultural beliefs about transplantation.29,30
We categorized CKD programs into tertiles of referral and demonstrated that the characteristics of patients cared for in programs with the lowest incidence of transplant referral were mostly like those in programs with the highest incidence of transplant referral. Although many patient characteristics were statistically different between highest, middle, and lowest tertile CKD programs, the absolute differences were small. However, there was a striking difference in the proportion of patients who lived in a rural location. For example, in the maintenance dialysis cohort, 29.5% of patients in the lowest tertile CKD programs lived in a rural location compared with 5.9% in the highest tertile CKD programs. This suggests that patients living in rural locations in Ontario may have reduced access to transplant referral. This was further supported by our additional analyses that grouped patients by geographic region. In our analysis that grouped patients by geographic region, we found that patients in Northern Ontario had a substantially lower cumulative probability of referral compared with the 4 other Ontario regions. Interestingly, we also found that patients in CKD programs with the highest patient volumes had the highest incidence of transplant referral and adjusted SRR. Larger CKD programs with highest patient volumes are in urban locations, not within the Northern region of Ontario. Patients living in the North may be facing several health system barriers to kidney transplant referral such as greater travel and accommodation costs, fewer options for public transportation, and less access to specialist testing or consultations. Kim et al.also found that across Canadian provinces, the likelihood of transplant referral was lower for patients treated at a dialysis facility greater than 100 km from the transplant center. 19 Conversely, a study in Georgia, United States found no association between distance to the transplant center and early referral for kidney transplantation. However, patients in that study only traveled a median distance of 61 km and a maximum distance of 272 km, much less than those traveling from Northern Ontario.31,32 For example, patients living in Sault St Marie, Ontario, complete their transplant evaluation 700 km away in Toronto, Ontario. Also, it is important to point out that Northern Ontario has a large indigenous population. The incidence and prevalence of kidney disease are higher in Indigenous populations compared with nonindigenous populations and patients who are Indigenous travel further to receive care compared with patients who are not Indigenous. 33 Across Canada, patients who are Indigenous have been shown to have reduced access to kidney transplantation.32,34,35 Although some of these factors have been cited as barriers to transplant rates, additional research, in collaboration with patients and providers from Northern Ontario, to understand the full spectrum of health care system–related barriers, social determinants of health, and intersectionality that lead to poor access to transplant faced by patients from Northern Ontario should be undertaken.10,27,36 With this future research, effective solutions could be generated that address the identified root causes.
Using the SRR as a transplant referral metric may be advantageous compared with the cumulative incidence of transplant referral as it allows one to adjust for patient characteristics and potentially identify programs that may be underperforming. Based on the SRRs for both the advanced CKD and maintenance dialysis cohorts, we classified CKD programs into 3 groups: higher-performing (SRR greater than 1), average-performing (SRR not different than 1 as the CIs included 1), and lower-performing (SRR less than 1). In the advanced CKD cohort, there were 5 higher-performing, 17 average-performing, and 4 lower-performing CKD programs in Ontario. In the maintenance dialysis cohort, there were 6 higher-performing, 15 average-performing, and 5 lower-performing CKD programs in Ontario. We found moderate concordance in the classification of program performance in both cohorts. For example, the same 3 programs were higher-performing in both the advanced CKD and maintenance dialysis cohorts. When examining the SRR according to geographic region, programs within Northern Ontario were below the provincial average in both cohorts. Our study highlights a potential opportunity to share best practices across CKD programs and geographic regions.
As in many other jurisdictions, Ontario has focused on implementing strategies to enhance access to kidney transplantation and living donation, delivering a quality improvement intervention to CKD programs initiated in 2017. 37 In 2021, when leadership at the Ontario Renal Network became aware of data demonstrating higher transplant rates at CKD programs with a dedicated referral coordinator, they provided additional funding to all programs to establish this role. Our work to demonstrate variability in transplant referral rates across Ontario CKD programs guides activities related to performance measurement, substantiates current efforts to improve access, and provides an actionable opportunity to focus on patients living rurally and those receiving care in Northern Ontario.
Limitations of our study are noted. First, our cumulative probability estimates only captured referrals within the first year of advanced CKD or maintenance dialysis initiation. There may be providers at CKD programs who intentionally do not refer patients who do not have a living donor early on because they anticipate that the patient will spend many years on the waiting list before receiving a deceased donor kidney transplant (average wait time for a deceased donor transplant in Ontario is 5 years). 38 A referral too early may result in increased testing while on the waiting list and a longer period of oversight by the transplant center. Second, although we excluded individuals with a recorded contraindication to kidney transplant (ie, long-term care residence, home oxygen use, and dementia) and restricted our cohort to individuals <80 years of age, it is possible our methods are not identifying all patients eligible for transplant referral. Since doing this work, we have further refined our definition of no recorded contraindication to transplant, including some additional variables (eg, malignancy); 39 however, our results are still valid with variation persisting after adjusting for several patient characteristics. Third, for some analyses we had smaller numbers of referrals that created wider CIs. Fourth, some analyses (eg, SRR) may be limited by residual confounding.
Our study demonstrates variability in transplant referral rates across CKD programs in Ontario, Canada. Many patients across Ontario who may benefit from transplantation are not reaching the crucial first step of referral to a transplant center. Chronic kidney disease program, provincial renal and transplant leadership should continue to work to remove health system–level barriers and prioritize innovative referral strategies to ensure equitable access to transplant.
Supplemental Material
sj-docx-1-cjk-10.1177_20543581231169608 – Supplemental material for Variation in Kidney Transplant Referral Across Chronic Kidney Disease Programs in Ontario, Canada
Supplemental material, sj-docx-1-cjk-10.1177_20543581231169608 for Variation in Kidney Transplant Referral Across Chronic Kidney Disease Programs in Ontario, Canada by Seychelle Yohanna, Kyla L. Naylor, Bin Luo, Stephanie N. Dixon, Sarah E. Bota, S. Joseph Kim, Peter G. Blake, Lori Elliott, Rebecca Cooper, Gregory A. Knoll, Darin Treleaven, Carol Wang and Amit X. Garg in Canadian Journal of Kidney Health and Disease
Footnotes
Acknowledgements
A.X.G. was supported by the Dr. Adam Linton Chair in Kidney Health Analytics and a CIHR (Canadian Institutes of Health Research) Clinician Investigator Award. This study was supported by ICES, which is funded by an annual grant from the Ontario Ministry of Health (MOH) and the Ministry of Long-Term Care (MLTC). The study was completed at the ICES Western site, where core funding is provided by the Academic Medical Organization of Southwestern Ontario, the Schulich School of Medicine and Dentistry, Western University, and the Lawson Health Research Institute. This study was conducted with funding and the support of the Ontario Renal Network (ORN) (a division of Ontario Health [OH]). Parts of this material are based on data and information compiled and provided by the Ontario Ministry of Health. This document used data adapted from the Statistics Canada Postal CodeOM Conversion File, which is based on data licensed from Canada Post Corporation, and/or data adapted from the Ontario Ministry of Health Postal Code Conversion File, which contains data copied under license from ©Canada Post Corporation and Statistics Canada. The analyses, conclusions, opinions, and statements expressed herein are solely those of the authors and do not reflect those of the funding or data sources; no endorsement is intended or should be inferred. Parts of this material are based on data and/or information compiled and provided by Canadian Institute for Health Information (CIHI). However, the analyses, conclusions, opinions, and statements expressed in the material are those of the author(s), and not necessarily those of CIHI. The authors acknowledge that the data used in this study were provided by the Trillium Gift of Life Network (Ontario Health) (2010-2017), Toronto, Ontario. The researcher’s interpretations and statements in this publication are those of the researcher only and not those of Trillium Gift of Life Network (OH). Parts of this material are based on data and information provided by OH. The opinions, results, view, and conclusions reported in this paper are those of the authors and do not necessarily reflect those of OH. No endorsement by OH is intended or should be inferred. We thank ORN for their content advice.
Ethics Approval and Consent to Participate
ICES is a prescribed entity under section 45 of Ontario’s Personal Health Information Protection Act. Section 45 authorizes ICES to collect personal health information, without consent, for the purpose of analysis or compiling statistical information with respect to the management of, evaluation or monitoring of the allocation of resources to or planning for all or part of the health system. Projects conducted under section 45, by definition, do not require review by a Research Ethics Board. This project was conducted under section 45 and approved by ICES’s Privacy and Compliance Office.
Consent for Publication
All authors consent to the publication of this study.
Availability of Data and Materials
The data set from this study is held securely in coded form at ICES. While data sharing agreements prohibit ICES from making the data set publicly available, access can be granted to those who meet prespecified criteria for confidential access, available at ![]() . The full data set creation plan and underlying analytic code are available from the authors upon request, understanding that the programs may rely upon coding templates or macros that are unique to ICES and are therefore either inaccessible or may require modification.
. The full data set creation plan and underlying analytic code are available from the authors upon request, understanding that the programs may rely upon coding templates or macros that are unique to ICES and are therefore either inaccessible or may require modification.
Author Contributions
S.Y., K.L.N., and A.X.G. contributed to the concept and design of the study. B.L. was involved in the analysis. All authors were involved in the analysis and interpretation of the data. K.L.N and S.Y. drafted the methods section of the manuscript and S.Y. drafted the remainder of the manuscript. All authors were involved in critical revision of the manuscript. All authors provided the final approval of the version to be published and agreed to be accountable for all aspects of the work.
Declaration of Conflicting Interests
The author(s) declared the following potential conflicts of interest with respect to the research, authorship, and/or publication of this article: A.X.G. received an investigator-initiated grant from Astellas Pharma Canada, Inc, which featured as a partnership fund in CIHR-funded research. All other authors declare no conflicts of interest.
Funding
The author(s) disclosed receipt of the following financial support for the research, authorship, and/or publication of this article: This study was conducted with funding and the support of the Ontario Renal Network (ORN), a division of Ontario Health (OH). The opinions, results, view, and conclusions reported in this paper are those of the authors and do not necessarily reflect those of OH. No endorsement by OH is intended or should be inferred.
Supplemental Material
Supplemental material for this article is available online.
References
Supplementary Material
Please find the following supplemental material available below.
For Open Access articles published under a Creative Commons License, all supplemental material carries the same license as the article it is associated with.
For non-Open Access articles published, all supplemental material carries a non-exclusive license, and permission requests for re-use of supplemental material or any part of supplemental material shall be sent directly to the copyright owner as specified in the copyright notice associated with the article.