
Abstract
Background:
Post-transplant diabetes mellitus (PTDM) encompasses new-onset and previously unrecognized type 2 diabetes. Kidney failure masks type 2 diabetes. Branched-chain amino acids (BCAA) are closely associated with glucose metabolism. Therefore, understanding BCAA metabolism both in kidney failure and after kidney transplantation may inform PTDM mechanisms.
Objective:
To understand the impact of present or absent kidney function on plasma BCAA concentrations.
Design:
Cross-sectional study of kidney transplant recipients and kidney transplant candidates.
Setting:
Large kidney transplant center in Toronto, Canada.
Measurements:
We measured plasma BCAA and aromatic amino acid (AAA) concentrations in 45 pre-kidney transplant candidates (15 with type 2 diabetes, 30 without type 2 diabetes) and 45 post-kidney transplant recipients (15 PTDM, 30 non-PTDM), along with insulin resistance and sensitivity by 75 g oral glucose loading for those in each group without type 2 diabetes.
Methods:
Plasma AA concentrations were analyzed using MassChrom AA Analysis and compared between groups. The insulin sensitivity for oral glucose tolerance tests or Matsuda index (a measure of whole-body insulin resistance), Homeostatic Model Assessment for Insulin Resistance (a measure of hepatic insulin resistance), and Insulin Secretion-Sensitivity Index-2 (ISSI-2, a measure of pancreatic β-cell response) was calculated from fasting insulin and glucose concentrations, and compared with BCAA concentrations.
Results:
Each BCAA concentration was higher in post-transplant subjects than pre-transplant subjects (P < .001 for leucine, isoleucine, valine). In post-transplant subjects, each BCAA concentration was higher in PTDM versus non-PTDM (odds ratio for PTDM 3-4 per 1 SD increase in BCAA concentration, P < .001 for each). Tyrosine concentrations were also higher in post-transplant subjects than pre-transplant subjects, but tyrosine did not differ by PTDM status. By contrast, neither BCAA nor AAA concentrations were different in pre-transplant subjects with or without type 2 diabetes. Whole-body insulin resistance, hepatic insulin resistance, and pancreatic β-cell response did not differ between nondiabetic post-transplant and pre-transplant subjects. Branched-chain amino acid concentrations correlated with the Matsuda index and Homeostatic Model Assessment for Insulin Resistance (P < .05 for each) only in nondiabetic post-transplant subjects—not in nondiabetic pre-transplant subjects. Branched-chain amino acid concentrations did not correlate with ISSI-2 in either pre-transplant or post-transplant subjects.
Limitations:
The sample size was small, and subjects were not studied prospectively for the development of type 2 diabetes.
Conclusions:
Plasma BCAA concentrations are higher post-transplant in type 2 diabetic states, but do not differ by diabetes status in the presence of kidney failure. The association of BCAA with measures of hepatic insulin resistance among nondiabetic post-transplant patients is consistent with impaired BCAA metabolism as a characteristic of kidney transplantation.
Introduction
Post-transplant diabetes mellitus (PTDM) is an important cardiovascular risk factor in kidney transplant recipients (KTR), developing in about 10% to 20% of patients. 1 The term PTDM replaced new-onset diabetes after transplantation (NODAT) to acknowledge unrecognized type 2 diabetes present before transplantation. 2 It is recognized that end-stage kidney disease (ESKD) can mask a new diagnosis of type 2 diabetes through multiple mechanisms, including impaired kidney gluconeogenesis, kidney insulin clearance, and impaired insulin breakdown by the kidney, liver, and muscle. 3 When KT restores kidney function, PTDM can manifest at any time, resulting in an adverse post-transplant prognosis similar to KTR with known type 2 diabetes. 4
Clinical risk factors for PTDM are well known and involve both insulin resistance and β-cell dysfunction. 5 However, little is known about how the restored kidney function per se that KT provides contributes to PTDM occurrence. Studying plasma branched-chain amino acid (BCAA) concentrations both before and after kidney transplantation may assist in this regard. In the general population without kidney failure, the BCAA profile links to new-onset type 2 diabetes, 6 and high BCAA concentrations associate with insulin resistance independent of β-cell function. 7 However, BCAA metabolomic signatures for predicting type 2 diabetes in the general population do not reproduce in hemodialysis patients. 8 On the other hand, high-plasma BCAA concentrations when first measured a year post-transplant associate with subsequent PTDM development. 9 Branched-chain amino acid profiles in kidney transplant candidates (KTC) with kidney failure and KTR with restored kidney function have not been directly compared. Assessing BCAA profiles in pre-transplant KTC with advanced chronic kidney disease (CKD) stage 5 or on dialysis (stage 5D) 10 both with and without known type 2 diabetes, post-transplant KTR (CKD stage 5T) both with and without PTDM, and comparing BCAA profiles with glucose and insulin responses in the nondiabetic subgroups may provide further insights into PTDM mechanisms that include the role of absent and restored kidney function to glucose metabolism. We therefore tested the hypothesis that plasma BCAA concentrations would be higher in type 2 diabetes independent of the kidney function.
Materials and Methods
St. Michael’s Hospital is an urban tertiary care medical-surgical hospital that performs approximately 120 adult single-organ KT procedures annually and provides long-term post-transplant care to approximately 1800 KTR. There are also approximately 300 ESKD patients on the KT waiting list. We performed a cross-sectional observational study of plasma AA concentrations in pre-transplant KTC and in post-transplant KTR who were at least 3 months post-transplant. Pre-transplant patients with estimated glomerular filtration rate (eGFR) ≥15 mL/min/1.73m2 and KTR with eGFR ≤30 mL/min/1.73m2 were excluded to ensure clear separation of the 2 groups. Other exclusions included unstable kidney function in the opinion of the investigators, dialysis patients unlikely to be transplanted as determined by the investigator as they are less comparable to post-transplant patients in many respects, type 1 diabetes where insulin resistance is not the major contributor to glucose metabolism, and hepatitis B, hepatitis C, or HIV infection, all of which are significant risk factors for PTDM. Post-transplant diabetes mellitus was defined according to 2013 Canadian Diabetes Association guidelines. 11 Diabetic and nondiabetic participants were matched 1:2 within each of the 2 groups by age ±10 years. Pre-transplant subjects were recruited from pre-transplant assessment clinics and post-transplant subjects from post-transplant clinics, and each subject attended 1 research study visit.
The primary objective was to compare fasting BCAA concentrations (leucine, isoleucine, valine) and 2 control non-BCAA (phenylalanine, tyrosine) profiles between pre-transplant subjects and post-transplant subjects. Secondary objectives included comparing BCAA profiles between nondiabetic and diabetic subjects within each group, and whole-body insulin resistance (measured by the insulin sensitivity index for oral glucose tolerance tests [OGTT], or ISOGTT, otherwise called the Matsuda index) and hepatic insulin resistance (measured by the Homeostatic Model Assessment for Insulin Resistance [HOMA-IR]), 12 as well as pancreatic β-cell response (measured by the Insulin Secretion-Sensitivity Index [ISSI-2]) 13 between nondiabetic pre-transplant and post-transplant subjects. After providing informed consent, each post-transplant subject provided approximately 20 mL of fasting morning blood samples for measuring AA concentrations, with all nondiabetic subjects providing in addition 1- and 2-hour insulin and glucose concentrations through a standard 75 g OGTT. In the case of pre-transplant subjects on dialysis, testing was performed on a nondialysis day.
Plasma AA concentrations were analyzed using the MassChrom AA Analysis (item no. 75111; Chromsystems, Munich, Germany). Calibrator, quality control (QC), and internal standards were reconstituted and prepared according to the manufacturer’s instructions. Calibrators, QC, and patient samples were pipetted (25 µL) into micro-centrifuge tubes, and 50 µL of internal standard mix solution was added. A 400-µL aliquot of the precipitating reagent was added to each sample and vortex-mixed for 10 seconds. Samples were centrifuged at 16 000g for 5 minutes to precipitate proteins. A 200-µL aliquot of supernatant was transferred to ultra-high-performance liquid chromatography (UHPLC) auto-sampler vials containing a limited-volume glass insert, and a 5-µL aliquot was analyzed by liquid chromatography tandem mass spectrometry. The analytical system consisted of a Sciex 5500 QTRAP mass spectrometer and a Shimadzu UHPLC. Mass spectrometry was performed in positive electrospray ionization mode. Scheduled multiple reaction monitoring acquisition consisted of specific ion transitions to monitor each AA and its respective isotope-labeled internal standard. Chromatography consisted of a binary gradient of mobile phases. The AA analytical column was maintained at 25°C.
The ISOGTT or Matsuda index was defined by the following formula: 10 000 Gluc0 × Ins0 × mean glucose × mean insulin, and the HOMA-IR was defined as (Gluc0 × Ins0)/22.5. 12 The ISSI-2 was defined as the ratio of the area-under-the-insulin-curve to the area-under-the-glucose curve, multiplied by the Matsuda index. 13
Continuous variables were compared between groups using student paired or unpaired t test, whereas categorical variables were compared by χ2 or Fisher exact test as appropriate. Bivariate logistic regression analyses were used to compare relationships between AA profiles and the presence of type 2 diabetes. Relationships among AA and insulin sensitivity indices were compared by Pearson correlation coefficient. In all cases, a P value <.05 was taken as statistically significant. SAS version 9.4 (Cary, North Carolina) was the statistical software used. The study was approved by the Research Ethics Board at St. Michael Hospital (REB 15-030).
Results
A total of 90 subjects with ESKD who were either awaiting kidney transplantation (pre-transplant, N = 45) or had already received a kidney transplant (post-transplant, N = 45) were recruited. Within each group of 45 participants, there were 15 with established type 2 DM and 30 without known DM. All diabetic post-transplant subjects had newly recognized PTDM of at least 3 months’ duration. Demographic and comparable baseline metabolic comparisons among these 4 groups are shown in Table 1. Four subjects received pre-emptive transplants. All post-transplant subjects received mycophenolate except 2 subjects who received sirolimus instead, and all received prednisone therapy. There was no difference in statin use between the PTDM and non-PTDM post-transplant subjects (2 vs 12 subjects, P = .66) or between the diabetic and nondiabetic pre-transplant subjects (4 vs 13 subjects, P = .27).
Demographic Comparisons Between the Post- Transplant and Pre-Transplant Subjects.

Note. PTDM = post-transplant diabetes mellitus; HDL = high-density lipoprotein.
Specific to the post-transplant subjects, the urine albumin-to-creatinine ratio was 13.5 ± 27 mg/mmol in PTDM versus 7.2 ± 14 mg/mmol in those without PTDM (P = 0.36), serum creatinine was 103.0 ± 32 versus 109.7 ± 26 µmol/L (P = .46), eGFR was 62.8 ± 17 versus 61 ± 16 mL/min/1.73m2 (P = .23), time post-transplant was 9.4 ± 8 versus 5.6 ± 6 years (P = .06), and 5 of 15 (33%) versus 15 of 30 (50%) received living donor transplants (P = .28). Time-to-PTDM was 4.9 ± 6.0 years. There were 12 of 15 (80%) patients with PTDM and 28 of 30 (93%) without PTDM who received tacrolimus; the remainder received cyclosporine. Trough tacrolimus concentration was 6.48 ± 3.8 versus 6.57 ± 2.8 ng/mL (P = 0.56), and C2 cyclosporine concentration was 365 ± 80 versus 543 ± 97 ng/mL (P = .15).
Specific to the pre-transplant subjects, among the type 2 diabetes group, 10 of 15 (67%) received hemodialysis and 5 of 15 (33%) received peritoneal dialysis, whereas in the nondiabetic group the corresponding numbers were 16 of 30 (53%) and 10 of 30 (33%), with 4 of 30 (14%) being pre-dialysis CKD5. Three patients had previously failed transplants. Dialysis duration was 3.54 ± 5.0 years in the diabetic group and 2.74 ± 2.2 years in the non-diabetic group (P = .88).
Plasma AA concentrations are shown in Table 2. The BCAA (leucine, isoleucine, valine) concentrations were consistently higher in PTDM than in non-PTDM post-transplant subjects, but aromatic AA concentrations did not differ. Branched-chain amino acid and tyrosine concentrations, but not phenylalanine concentrations, were higher in post-transplant than pre-transplant subjects. By contrast, BCAA concentrations did not differ between diabetic and nondiabetic pre-transplant subjects (Table 2). Branched-chain amino acid concentrations trended higher when subjects with type 2 diabetes were combined across the post-transplant and pre-transplant groups compared with nondiabetic subjects, while aromatic AA concentrations were similar.
Plasma Amino Acid Concentrations in Post-Transplant and Pre-Transplant Subjects.
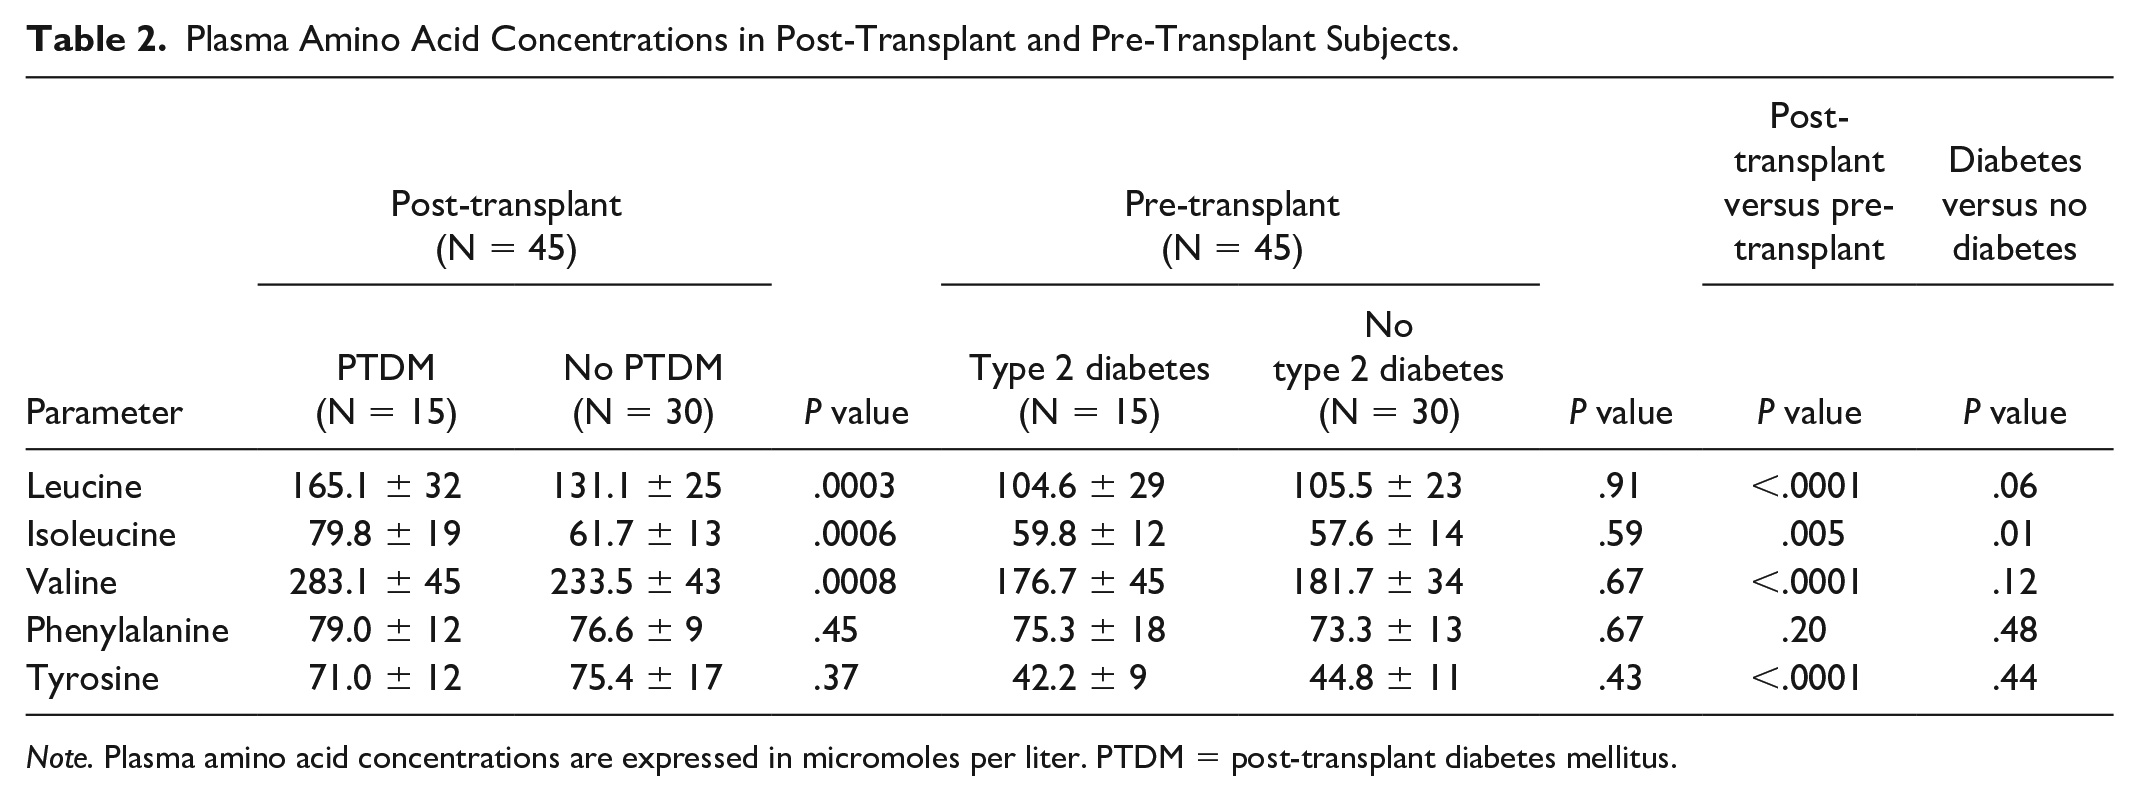
Note. Plasma amino acid concentrations are expressed in micromoles per liter. PTDM = post-transplant diabetes mellitus.
When PTDM subjects were assessed as diabetes events in a bivariate case-control comparison, each of the 3 BCAA was significantly associated with the presence of type 2 diabetes, with odds ratios varying between 1.02 and 1.08 per 1 µmol/L increase in AA concentration and between 3 and 4 for each standard deviation increase, as shown in Table 3. Combining AA concentrations did not provide additional predictive value (data not shown). Odds ratios for the aromatic AA concentrations were insignificant. In pre-transplant subjects, there was no significant relationship between any AA concentration (BCAA or aromatic AA) and the presence of type 2 diabetes.
Bivariate Analysis for the Presence of Type 2 Diabetes in Post-Transplant and Pre-Transplant Subjects.
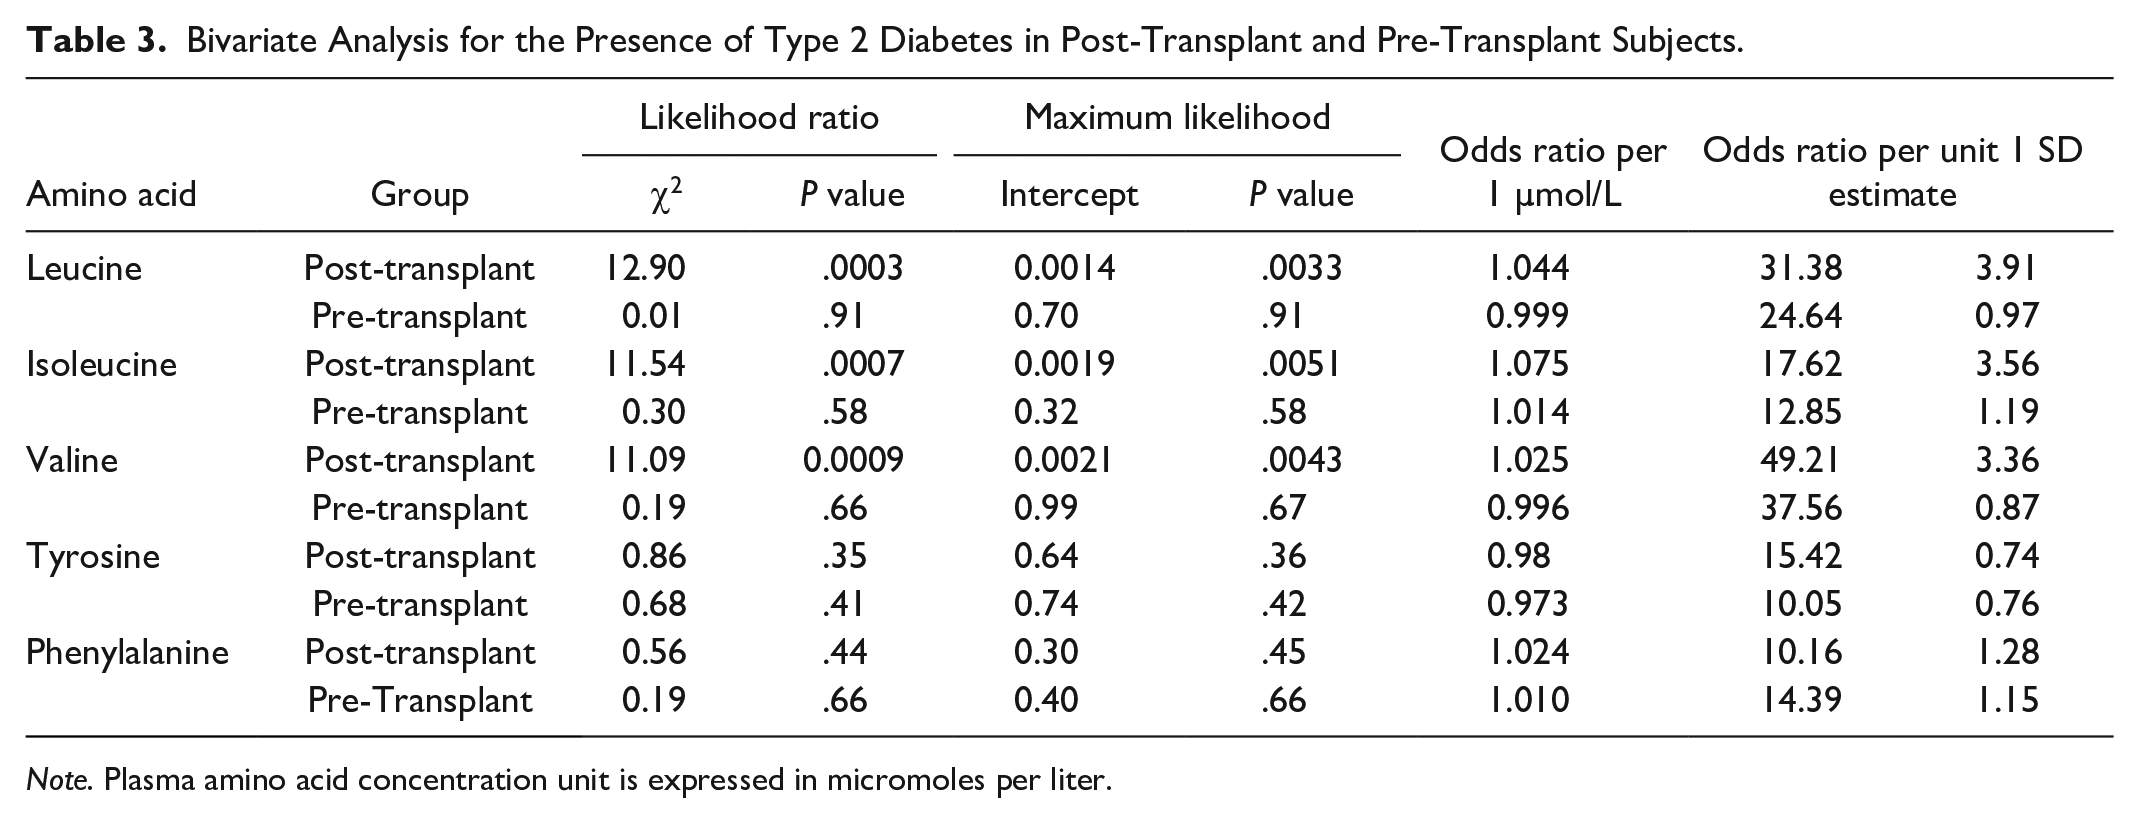
Note. Plasma amino acid concentration unit is expressed in micromoles per liter.
Table 4 provides the results from OGTT in the nondiabetic post-transplant and pre-transplant subjects. There was no significant difference in glucose or insulin concentrations between these 2 groups. Similarly, there was no difference in the derived ISOGTT, HOMA-IR, and ISSI-2 scores between them. Table 5 provides a series of Pearson correlation coefficients in nondiabetic post-transplant and pre-transplant subjects, calculated between each AA and the other AA, as well as between each AA and ISOGTT, HOMA-IR, and ISSI-2 scores. In post-transplant subjects, each BCAA concentration positively correlated with each other and with phenylalanine, but not with tyrosine. Each of these 4 AA (3 BCAA and phenylalanine) negatively correlated with the ISOGTT and positively with the HOMA-IR, but not with the ISSI-2. There was no additive correlative value to combining AA with any of the indices (data not shown). In pre-transplant subjects, correlations among the AA themselves were generally similar to post-transplant subjects, other than some correlations seen with tyrosine. By contrast however, in pre-transplant subjects there was no correlation between BCAA or aromatic AA with ISOGTT, HOMA-IR, or ISSI-2 apart from one positive correlation between phenylalanine and HOMA-IR (Table 5). Taken together, the greatest consistency of correlations was seen among the BCAA.
Indices of Glucose Homeostasis in Nondiabetic Post-Transplant and Pre-Transplant Subjects.

Note. PTDM = post-transplant diabetes mellitus; ISOGTT = insulin sensitivity index for oral glucose tolerance tests; HOMA-IR = Homeostatic Model Assessment for Insulin Resistance; ISSI-2 = Insulin Secretion-Sensitivity Index.
Pearson Correlation Coefficients Between Plasma Amino Acid Concentrations and Indices of Glucose Homeostasis in Nondiabetic Post-Transplant and Pre-Transplant Subjects.
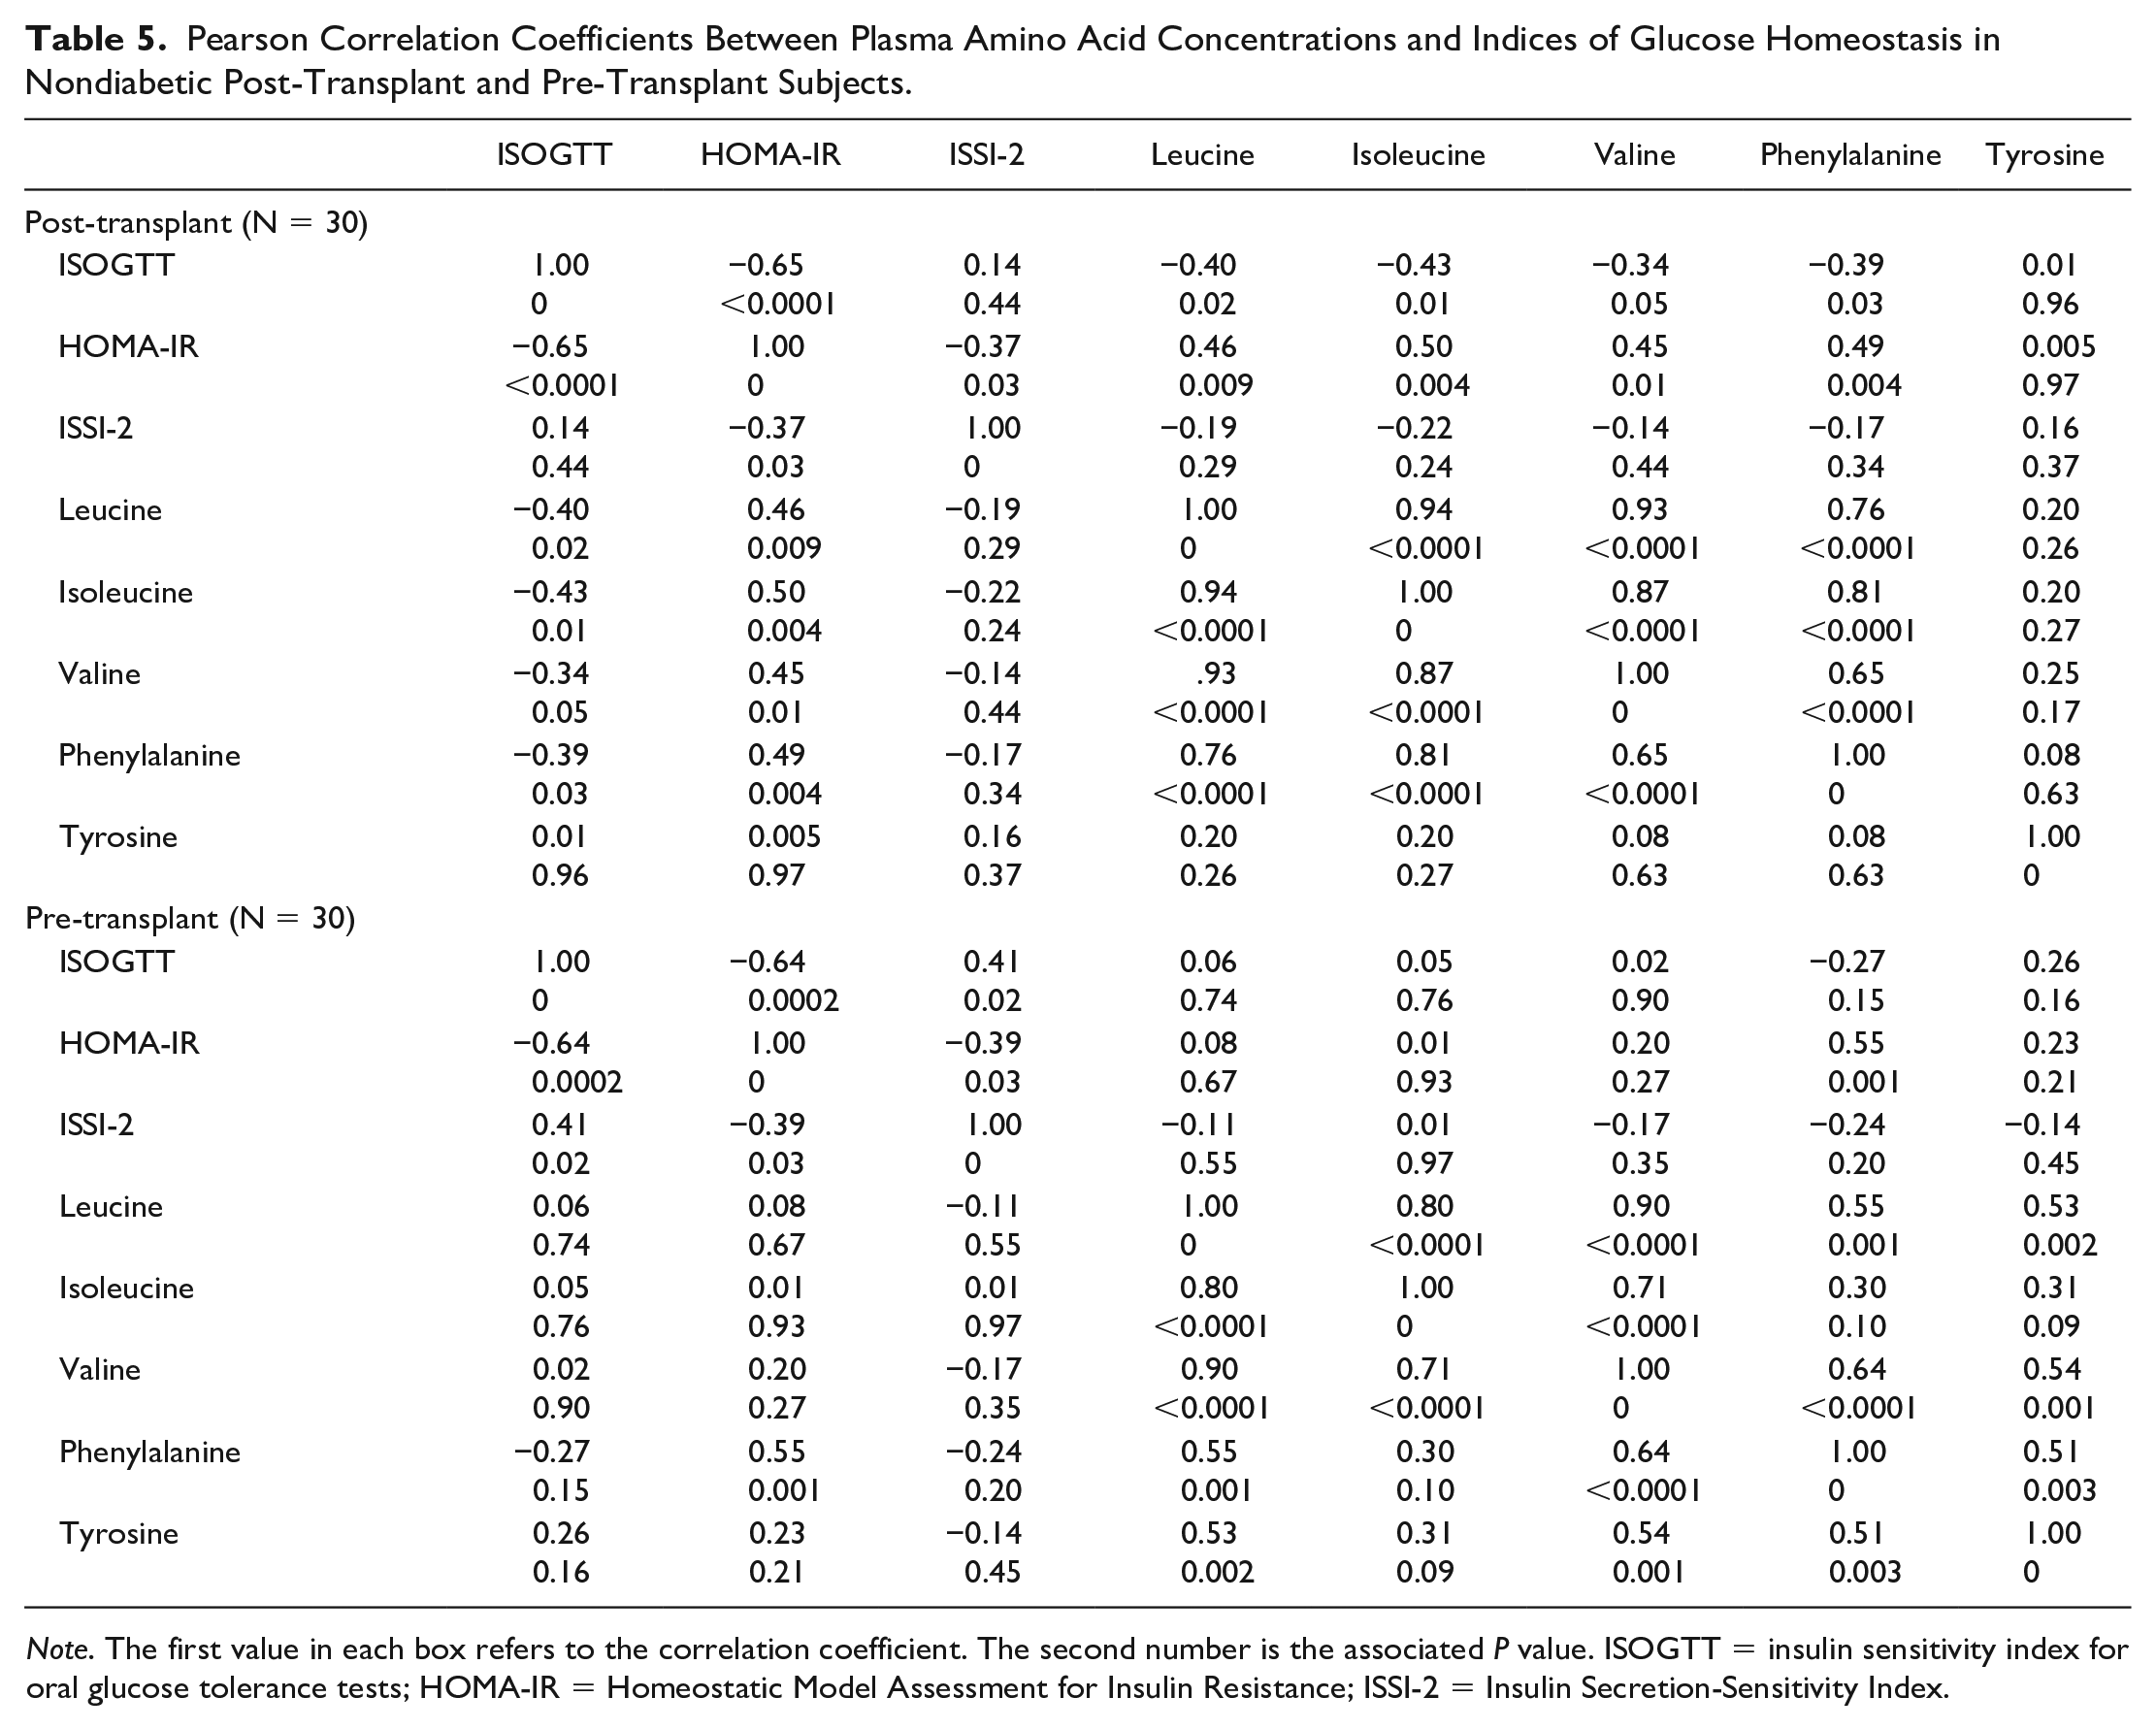
Note. The first value in each box refers to the correlation coefficient. The second number is the associated P value. ISOGTT = insulin sensitivity index for oral glucose tolerance tests; HOMA-IR = Homeostatic Model Assessment for Insulin Resistance; ISSI-2 = Insulin Secretion-Sensitivity Index.
Discussion
This study demonstrates that plasma BCAA concentrations significantly correlate with the ISOGTT, a measure of whole-body insulin sensitivity, and the HOMA-IR, a measure of hepatic glucose metabolism, when a functional kidney is present. These correlations are not significant for subjects with kidney failure. Branched-chain amino acid concentrations in PTDM do not differ from known type 2 diabetes in the general population, although PTDM often appears suddenly and its occurrence can be reasonably predicted through pre-transplant and early post-transplant clinical risk factors. Pre-transplant BCAA concentrations are unlikely to predict PTDM because of the lost relationship to glucose metabolism in the environment of kidney failure, indicating that PTDM causality may relate less to the pre-transplant environment and more to the post-transplant environment, in which any of the BCAA concentrations may serve as a better marker.
As both the ISOGTT and the HOMA-IR correlate with BCAA concentrations in nondiabetic post-transplant subjects, it is clear that BCAA affect post-transplant glucose and insulin metabolism. In the presence of PTDM, higher BCAA concentrations could indicate a resultant impaired glucose and insulin metabolism, although the direction of causality remains to be established. In this regard, PTDM does not metabolically differ from type 2 diabetes in the presence of intact native kidney function. As the ISSI-2 score does not correlate with BCAA metabolism in either the presence or absence of kidney function, this study does not provide evidence of a role for insulin secretion (or β-cell compensation) in PTDM.
The 5 selected AA in this study strongly correlated with the prediction of type 2 diabetes as early as 12 years prior to onset in the Framingham Offspring Study that consisted of healthy, normoglycemic individuals. 14 Odds ratios adjusted by insulin measures for future type 2 diabetes development varied from 1.5 to 2, and associations persisted even after adjusting for standard type 2 diabetes risk factors. 14 These odds ratios are very similar to the findings in this study. Stimulating the insulin axis through the OGTT did not elicit differential AA changes between post-transplant and pre-transplant subjects. We were able to measure only baseline AA concentrations, and we were unable to assess patients longitudinally for the development of PTDM. Nonetheless, this study confirms that further analysis of BCAA profiles in nondiabetic post-transplant patients with adequate kidney function may help identify those at risk of subsequent PTDM, as has been shown in a previous cross-sectional analysis, 9 whereas measuring BCAA concentrations is unlikely to be helpful in pre-transplant patients with ESKD. While the post-transplant BCAA profile was consistent with that of the general population, the aromatic AA profile was less so, with only pre-transplant tyrosine concentrations lower than post-transplant concentrations similar to the BCAA and only phenylalanine concentrations correlating with the BCAA in nondiabetic post-transplant subjects.
Branched-chain amino acid concentrations are higher in overweight and obese subjects, playing a role in type 2 diabetes development once insulin resistance develops. 15 It was shown previously that BCAA correlate with PTDM only before prediabetes develops. 9 Adiponectin, an adipokine whose plasma concentration is lower in those at risk for type 2 diabetes, decreases circulating BCAA and is low in insulin-resistant states. 16 Decreased adiponectin concentrations have been demonstrated in KTR who are ethnically already at higher risk of type 2 diabetes. 17 Adiponectin gene variants also associate with PTDM. 18 Conversely, adjusting for adiponectin did not alter the relationship between BCAA and insulin resistance in 70 subjects. 19 Adiponectin concentrations decrease after successful KT. 20 Therefore, restored BCAA concentrations from restored kidney function in the early post-transplant period may lead to PTDM once insulin resistance develops from other mechanisms such as corticosteroid administration and weight gain. Although not studied here, correlating BCAA to adiponectin concentrations may help further understanding of the mechanisms of adiponectin involvement in diabetes development.
We measured apolipoprotein levels and the lipid panel to understand whether cardiovascular risk profiles were similar, and the groups therefore comparable, to add clinical context to any BCAA differences found. Apolipoprotein levels are also associated with late PTDM, but these were not analyzed further because there was no difference between the PTDM and non-PTDM groups, likely due to statin therapy. The hemoglobin was measured to understand large differences, if any, in glycosylated hemoglobin. There were no differences beyond what was expected, and so these were not analyzed further.
Despite similar HbA1c, indicating a similar range of diabetes control, BCAA are elevated in post-transplant but not pre-transplant subjects. Current therapeutic modalities are insufficient to address a major component of aberrant AA metabolism in patients with PTDM, in whom a functioning kidney is associated with increased BCAA. This finding suggests that the liver-alpha cell axis includes kidney function. Future studies should test the hypothesis that the liver-alpha cell-kidney network results in impaired BCAA metabolism. This could be due to, but not limited to, differences in the handling of urea generated by hepatic AA metabolism. In the absence of additional investigation, the role of both adiponectin and urea metabolism in connection with BCAA metabolism in ESKD must remain speculative at this time.
The liver and muscle have an important role in BCAA metabolism as it relates to type 2 diabetes. Mammals do not synthesize BCAA. Branched-chain amino acids enter the circulation directly from the gut, bypassing the liver due to the absence of hepatic branched-chain aminotransferase. Branched-chain amino acid affect both energy metabolism and glycolysis. Patients with type 2 diabetes have high BCAA concentrations in their skeletal muscle, favoring accumulation of fatty acids and contributing to insulin resistance. Insulin resistance relates to excess BCAA catabolites and partially esterified lipids in muscle tissue, eventually leading to type 2 diabetes. Type 2 diabetes in turn may alter BCAA gene transcription. 21
This study has some limitations. The sample size was based on convenience rather than calculation, and so the study must be considered hypothesis-generating at this time. We did not assess associations of BCAA with adiponectin or urea, as well as apolipoprotein concentrations that are associated with PTDM. 22 As this was a cross-sectional study, subjects were not studied prospectively from the pre-transplant to post-transplant stage of their CKD and could not be standardized by time elapsed post-transplant. Certain subgroups (eg, subjects on peritoneal dialysis or classified by levels of adiposity) were especially small, precluding their separate analysis.
In summary, the utility of measuring pre-transplant plasma BCAA concentrations to predict PTDM is impaired by kidney failure, but plasma BCAA concentrations may become useful again post-kidney transplantation. Kidney function is required to demonstrate the relationship of BCAA to glucose metabolism. Kidney transplantation provides the opportunity to further evaluate the role of BCAA in type 2 diabetes development in CKD patients, knowing that BCAA metabolism mediates PTDM through insulin resistance. Studying pre-transplant BCAA concentrations as a predictor of future PTDM is unlikely to be rewarding, but BCAA measurement may again become helpful in the post-transplant period.
Footnotes
Acknowledgements
The authors would like to thank Lindita Rapi for her assistance in the conduct of the study.
Ethics Approval and Consent to Participate
Ethics approval was obtained from the Research Ethics Board at St. Michael’s Hospital. Informed consent was obtained from all participants.
Consent for Publication
All authors reviewed the final manuscript and provided consent for publication.
Availability of Data and Materials
Data and materials may be made available upon written request to the corresponding author. Reasonable requests for data access will be assessed in consultation with the appropriate Research Ethics Board.
Declaration of Conflicting Interests
The author(s) declared no potential conflicts of interest with respect to the research, authorship, and/or publication of this article.
Funding
The author(s) disclosed receipt of the following financial support for the research, authorship, and/or publication of this article: This study was funded partly by the Dr. Mary Papantony Research Fund, St. Michael’s Hospital, Toronto, Canada and an investigator-initiated research grant from Astellas Canada.