
Abstract
Background:
Central aortic blood pressures and arterial stiffness are better indicators of cardiovascular outcomes than brachial blood pressures. However, their response to renal denervation (RDN) in patients with Stage 3 and Stage 4 chronic kidney disease (CKD) has not yet been examined.
Objective:
To evaluate the impact of RDN on central blood pressures (CBP), brachial (office and ambulatory) blood pressures, arterial stiffness, glomerular filtration rate (GFR), 24-hour urine protein, and selective cardiac parameters observed on echocardiograms.
Design:
Single-center, single-arm with pre-/post-RDN follow-up.
Setting:
Patients were recruited from the multidisciplinary CKD clinic, Regina General Hospital, Canada.
Patients:
About 25 consecutive patients with Stage 3 or Stage 4 CKD and resistant hypertension, with no radiological or laboratory evidence of secondary causes of hypertension.
Measurements:
The key measurements were CBP, pulse wave velocity, ambulatory 24-hour blood pressure, office blood pressures on BP Tru, GFR, 24-hour urine protein and sodium, dose and number of blood pressure medication and doses.
Methods:
The primary outcome measure was the change in CBP from baseline to 6 months post-RDN. Secondary outcome measures included changes in CBP, office blood pressure, 24-hour ambulatory pressures, pulse wave velocity, kidney function (eGFR and 24-hour protein excretion), and the change in the number and dose of medications during the 2-year follow-up period. The primary outcome and the secondary outcomes were evaluated using a Friedman’s analysis of variance (ANOVA) and Wilcoxon signed-rank test for changes from post RDN procedure. Bonferroni correction was used to adjust P values for multiple testing. A two-sided alpha of .05 was used.
Results:
Median central blood pressures (mm Hg) were 127/75 at baseline versus 118/70 at 6 months and 118/67 at 24 months (P = .13). Median office blood pressures (mm Hg) were 148/76 at baseline versus 135/75 at 6 months and 133/75 at 24 months (P ≤ .001). Median ambulatory 24-hour day (mm Hg) was 148/64 at baseline and 146/68 at 6 months and 152/67 at 24 months (P = .60). Median pulse wave velocity (m/s) at baseline was 13.8 at baseline versus 13.3 m/s at 6 months and 12.3 at 12 months’ time (P = .62). Estimated glomerular filtration rate (mL/min/1.73m2) at baseline was 37, at 6 months was 36 and 34 at 24 months (P = .33).
Limitations:
Single-center study, with no sham arm.
Conclusions:
Our study demonstrates that there was a significant improvement in office blood pressures from baseline to 6 months, maintained to 24 months. There was a numerical improvement in central pressures, and pulse wave velocity at 6 and 24 months, with no sustained changes noted in 24-hour blood pressure. Kidney function remained at or near baseline throughout the 24 months of observation.
Trial registration:
ClinicalTrials.gov (NCT01832233).
What was known before
In selected patients, there is an improvement in brachial blood pressures post-RDN. However, no published studies have yet examined the improvement in central blood pressure post-RDN in patients with CKD.
What this adds
The study adds new insights to the effects of RDN on blood pressure in patients with CKD.
Introduction
Increased afferent sympathetic activation is an early event in chronic kidney disease (CKD). 1 Various forms of kidney damage lead to a heightened sympathetic drive via central integrative pathways in the hypothalamus.2,3 The ensuing efferent response leads to increase in renin activity, sodium retention and eventually vasoconstriction, which contribute to development and propagation of hypertension. 4 While reducing office brachial blood pressure (OBP) has been associated with improved cardiovascular outcomes, clinical studies have indicated that central BP (CBP) may have predictive value independent of traditional risk factors and particularly independent of the corresponding OBP.5-8
The vasculature of patients with CKD is exposed to chronic damage from medial calcification, aging, hypertension, and diabetes, which result in stiffer blood vessels. Vessel stiffness, as measured by pulse wave velocity (PWV), is an independent predictor of cardiovascular structural damage and all-cause mortality.5,6 The sympathetic nervous system has been linked to all aspects of arterial distensibility and compliance. 9 Interruption of the sympathetic system through renal denervation (RDN) using radiofrequency energy to ablate the afferent and efferent nerve signaling reduces sympathetic activity, leading to a decrease in BP 10 and cardiac outcomes. 11
There is paucity of data examining the relation of CBP and arterial stiffness in patients with CKD12,13 and no data on changes in arterial stiffness and CBP in CKD patients who undergo RDN. Moreover, there is very little published data on the longitudinal effects of RDN on kidney function. Despite contrast delivery and endothelial exposure to thermal energy, 10 RDN appears to be well tolerated by the kidney in the short term. To assess the impact of renal catheter ablation on CBP and PWV in patients with CKD we conducted a single center study in which treatment resistant hypertensive participants with stages 3 and 4 CKD underwent RDN and were followed for 2 years post procedure. During this period, we measured changes in CBP, OBP, 24-hour ambulatory blood pressure, vascular stiffness (PWV), and renal biochemical parameters (eGFR, and 24-hour urine protein), along with monitoring the dose and number of antihypertensive medications in our cohort.
Methods
Study Design and Patients
Totally, 25 consecutive stage 3 and stage 4 CKD participants with resistant hypertension from the Regina General Hospital (RGH) multidisciplinary CKD clinic agreed to undergo RDN and are included in the study. Participants underwent the procedure from Feb 2013 to October 2014. Eligible participants were >18 years of age with systolic OBP of > than 140 mm Hg despite maximal doses of 3 agents (1 being a diuretic). Participants were excluded if there was: functional adrenal adenoma, renal artery length (on both sides) of < 20 mm and diameter of < 4 mm, pregnant or planning pregnancy during the study period, moderate to severe aortic stenosis, cardiac event necessitating introduction of clopidogrel during the prior 12 months, current Warfarin use and history of cerebrovascular accident (CVA) 6 months prior to the procedure. Once identified as having resistant hypertension based on chart review, participants underwent evaluation for eligibility to participate in the study (Figure 1). The protocol was approved by the Research Ethics Board (Institutional Review Board; REB-12-73) and all participants provided written informed consent. Patients on clonidine and other sympatholytic agents were not excluded from the study, ClinicalTrials.gov (NCT01832233).
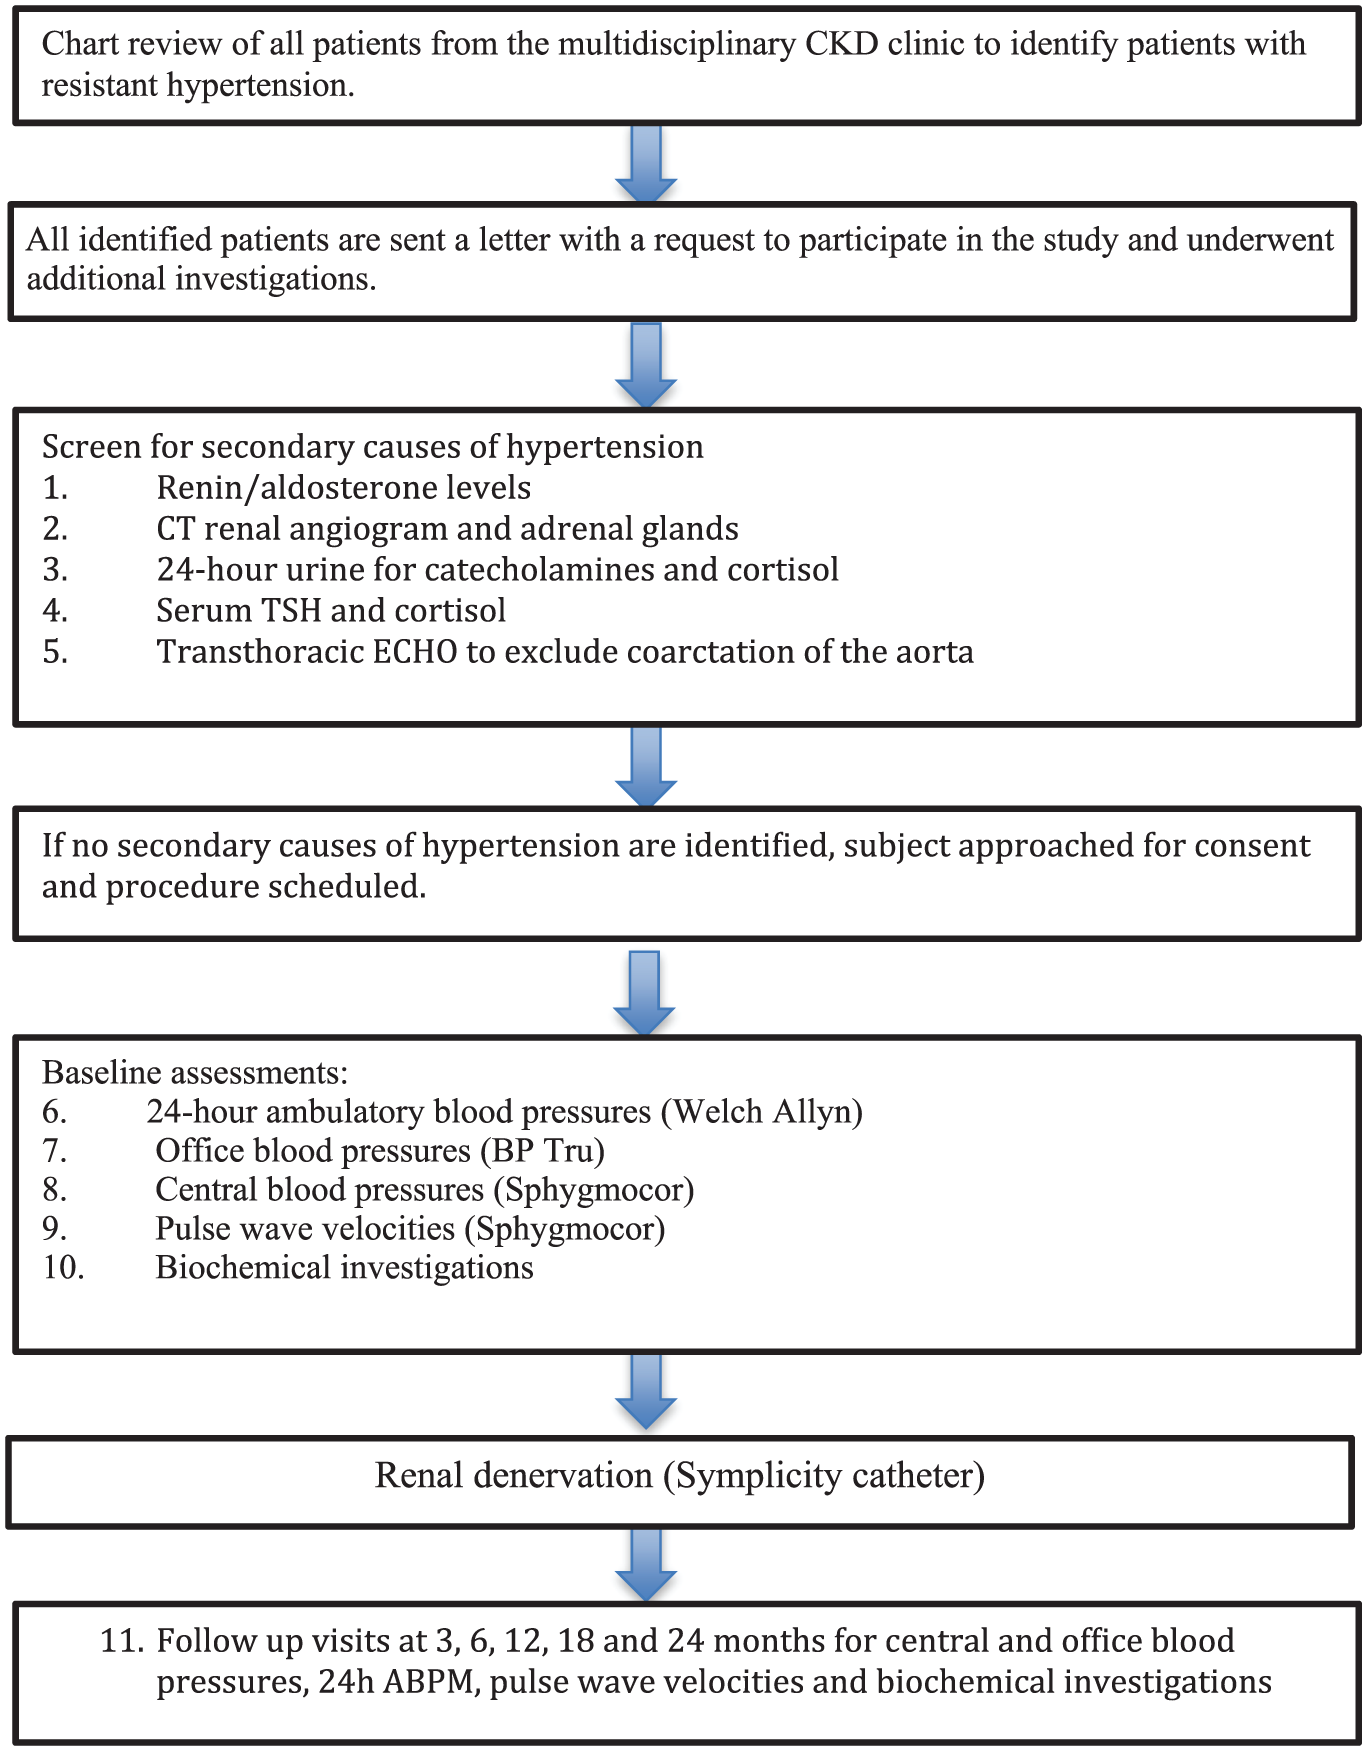
Study flowchart.
Demographic information
The patient’s age, height, weight, waist circumference, gender, current medications, and current medical conditions (peripheral artery disease, diabetes mellitus, coronary heart disease, cerebrovascular disease) were recorded prior to the procedure (Table 1).
Testing Strategy in All RDN Participants.

Note. Table 1: List of investigations at baseline and at follow-ups at 3, 6, 12, 18, and 24 months after the procedure (within ±1 month), participants underwent repeat testing as shown in Table 1. RDN = renal denervation; CBC= complete blood count; HbA1c= hemoglobin A1c.
Baseline laboratory measures
Lab testing within 1 month preceding the renal denervation which included serum fasting glucose and insulin, fasting lipid panel, e-GFR (as per modification of diet in renal disease [MDRD] formula), electrolytes, complete blood count and 24-hour urine collection for protein and an albumin/creatinine ratio. These measurements were repeated at 3, 6, 12, 18, and 24 months (Table 1).
Procedure
During renal nerve ablation, a catheter connected to a Medtronic radiofrequency generator was inserted percutaneously through the groin via the femoral artery and advanced up the aorta to the renal arteries as reported in prior investigations. 14 A total of 4 to 6 discrete radiofrequency ablations lasting up to 2 minutes, of 8 watts or less each, were performed, separated both longitudinally and rotationally within each renal artery. 15 The number of successful ablations in each renal artery was also recorded. The procedures were performed by three Interventional Radiologists. One of them performed majority of the procedures (n = 15), while the other 2 radiologists performed (n = 5) each. All adverse events and complications were recorded during each study visit. Specific interventional-related safety data included bleeding or a femoral pseudoaneurysm requiring intervention, renal artery dissection, myocardial infarction, stroke, and death.
Follow-up schedule
About 7 days after the ablation procedure, the patient received a phone call from the study coordinator to assess his/her clinical condition. Following appropriate orientation to home BP monitoring, he or she was encouraged to continue to check his or her blood pressure routinely at home (2 times/week) and inform the attending physician if his or her blood pressure fell below 100 mm Hg systolic or remained higher than 180/90 mm Hg.
Ambulatory blood pressures and office blood pressures
Participants underwent 24-hour blood pressure monitoring (Welch Allyn, Skaneateles Falls, NY, USA). Blood pressures were recorded every half an hour during the day (8 AM to 10 PM) and every 1 hour during the night (10 PM to 8 AM) and the following information was documented: daytime systolic pressure (mm Hg), daytime diastolic pressure (mm Hg), night-time systolic pressure (mm Hg) and night-time diastolic pressure (mm Hg). The following day, the monitor was removed, and participants sat in a quiet room for 10 minutes before the study coordinator took peripheral blood pressure measurements using BP Tru (BPM 100, BP Tru medical devices, Coquitlam, BC, Canada) on the nondominant arm, (6 consecutive blood pressures, the first was excluded, and the average of the last 5 readings were documented as per current Hypertension guidelines. 16
Central blood pressure
After recording the mean of the 5 BP readings, radial artery waveforms were recorded with a high-fidelity micromanometer from the wrist of the dominant arm (supine) and calibrated to the previously measured BP readings. Waveforms were processed with dedicated software (Sphygmocor CPV [EM3] software version 9; AtCor Medical). The integral system software was used to derive a corresponding central aortic pressure waveform using a previously validated generalized transfer function.17,18 Aortic waveforms were subject to further analysis using the SphygmoCor software to identify the time to the peak/shoulder of the first and second pressure wave components (T1, T2) during systole. The pressure at the peak/shoulder of the first component will be identified as the P1 height, and the pressure difference between this point and the maximal pressure during systole (Δ P, or augmentation) will be identified as the reflected wave during systole. The augmentation index (AIx), defined as the ratio of augmentation to the central pulse pressure, is expressed as a percentage: AIx: (Δ P/PP) × 100, where P is pressure, and PP is pulse pressure. At least 2 consecutive radial pressure wave samplings were recorded for each patient, and the mean was used for analysis.
PWV
The carotid to femoral PWV was measured in all patients during every clinic visit. PWV was determined immediately after the CBP. This parameter is determined by measurement of arterial pressure waves at the carotid and femoral arteries with a pressure transducer as previously reported. 12 The surface distance from the suprasternal notch to the distal (femoral) recording site was measured, and the pressure wave transit time was calculated by dividing the distance to the distal site by the pressure wave transit time. The default for capture time was 10 seconds and the PWV algorithm used was intersecting tangents (the other options were pulse height percent, maximum dP/dt, and maximum 2nd derivative, but we used intersecting tangents, the default method of the software). Operator index calculated by the software was used to determine validity of reports. Inclusion resulted from an Operator Index of 75 or higher with the range being 77 to 100 and the median value being 92. A single trained coordinator (RJ) performed all the measurements, and the mean of 2 PWV measurements was recorded for each participant using the Sphygmocor CPV (EM3) device and software.
Outcome Measures
The primary outcome measure was the change in CBP from baseline to 6 months post-RDN. Secondary outcome measures included changes in CBP, OBP, 24-hour ABPM, PWV, kidney function (eGFR and 24-hour protein excretion), and the change in the number and dose of medications during the 2-year follow-up period.
Sample Size
No power calculation was performed. We elected to enroll a convenience sample of 25 participants.
Statistical Analyses
Baseline data are summarized descriptively as mean, standard deviation median and interquartile range (IQR). The primary outcome and the secondary outcomes were evaluated using a Friedman’s analysis of variance (ANOVA) and Wilcoxon signed-rank test for changes from post RDN procedure. Bonferroni correction was used to adjust P values for multiple testing. A two-sided alpha of .05 was used. All statistical analysis was performed using SPSS Statistics for Windows, Version 22.0 (SPSS Inc., Chicago, IL) and R statistical software, Version 3.4.1 (Foundation for Statistical Computing, Vienna, Austria).
Results
Baseline Characteristics
About 13 patients were on 4 antihypertensives, 7 patients were taking 5 antihypertensives, 3 patients were on 6 antihypertensives, 2 were on 7 antihypertensives and one patient was on 8 medications. The distribution of different medication classes based on doses is also attached (Appendix). Totally, 4 of the 25 patients underwent unilateral denervation due to renal artery length of < 2 cm and/or early bifurcation on the contralateral side. Patients received a minimum of 4 ablations and maximum of 6 on each side. The mean (± SD) age was 62.9 (±12.2) years, with a mean body mass index (BMI) of 33.5 (± 6.0), and mean waist circumference (cm) of 114.6 (± 14.6). The mean brachial blood pressure (Bp Tru) was: 154.5/77.7 (±13.9/15.5) mm Hg, with a mean central blood pressure of 128.6/78.1 (±22.3/15.6) mm Hg. The mean PWV was 15.7 (±13.4) m/s. There were 18 stage 3 and 7 stage 4 patients. The mean eGFR (MDRD) was 37.0 (± 12.3) mL/min/1.73m2 (Table 2).
Baseline Characteristics of Patients Predenervation (N = 25).

Note. Table 2: Baseline characteristics of patients pre RDN (n = 25). IQR = interquartile range; BMI = body mass index; BP = blood pressure; CKD = chronic kidney disease; RDN = renal denervation; MDRD = modification of diet in renal disease..
Office, Ambulatory, Central Blood Pressure, Pulse Wave Velocities and Renal Outcomes
The office systolic (Bp Tru) BP (mm Hg) median (IQR) was 148 (145-163) at baseline, 135 (128-149) at 6 months, 138 (129-155) at 12 months, and 133 (125-143) at 24 months, (P ≤ .001). (Figure 2a) The central systolic blood pressure (mm Hg) median (IQR) was 127 (115-141) at baseline, 118 (116-134) at 6 months, 123 (117-135) at 12 months, and 118 (107-127) at 24 months, (P = .13). (Figure 2b) The daytime ambulatory systolic blood pressures (mm Hg) median (IQR) were 143 (143-159) at baseline, 144 (138-160) at 6 months, 141 (123-151) at 12 months, and 150 (137-168) at 24 months, (P = .27). (Figure 2c) The night-time ambulatory systolic blood pressure (mm Hg) median (IQR) was 143 (123-153) at baseline, 141 (133-151) at 6 months, 141 (123-153) at 12 months, and 143 (153-169) at 24 months, (P = .03). (Figure 2d) The PWV pressure (m/s) median (IQR) was 13.8 (10.0-15.8) at baseline, 13.3 (10.2-16.2) at 6 months, 12.3 (10.0-17.3) at 12 months, and 15.6(10.2-17.6) at 24 months, (P = .18) (Figure 3 and Table 3).

Mean Office BP Tru Blood pressures at baseline, 3, 6, 12, 18 and 24 months. (b) Mean Central blood pressures at baseline, 3, 6,12,18, and 24 months. (c) Mean day time ambulatory blood pressures at baseline, 3, 6, 12, 18, and 24 months. (d) Mean night-time ambulatory pressure at baseline, 3, 6, 12, and 24 months.
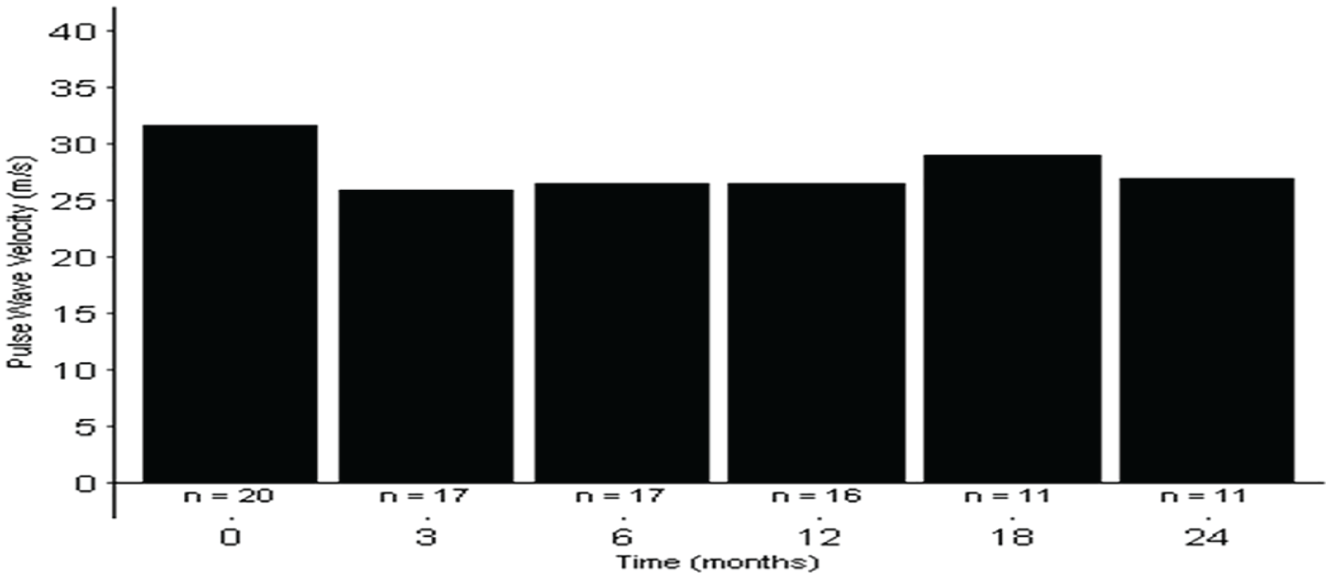
Pulse wave velocity at baseline, 3, 6, 12, 18 and 24 months.
Blood Measures (Office, Ambulatory, Central) and Pulse Wave Velocities at Baseline, Three, 6, 12, 18, and 24 Months After Renal Denervation Compared to Baseline.
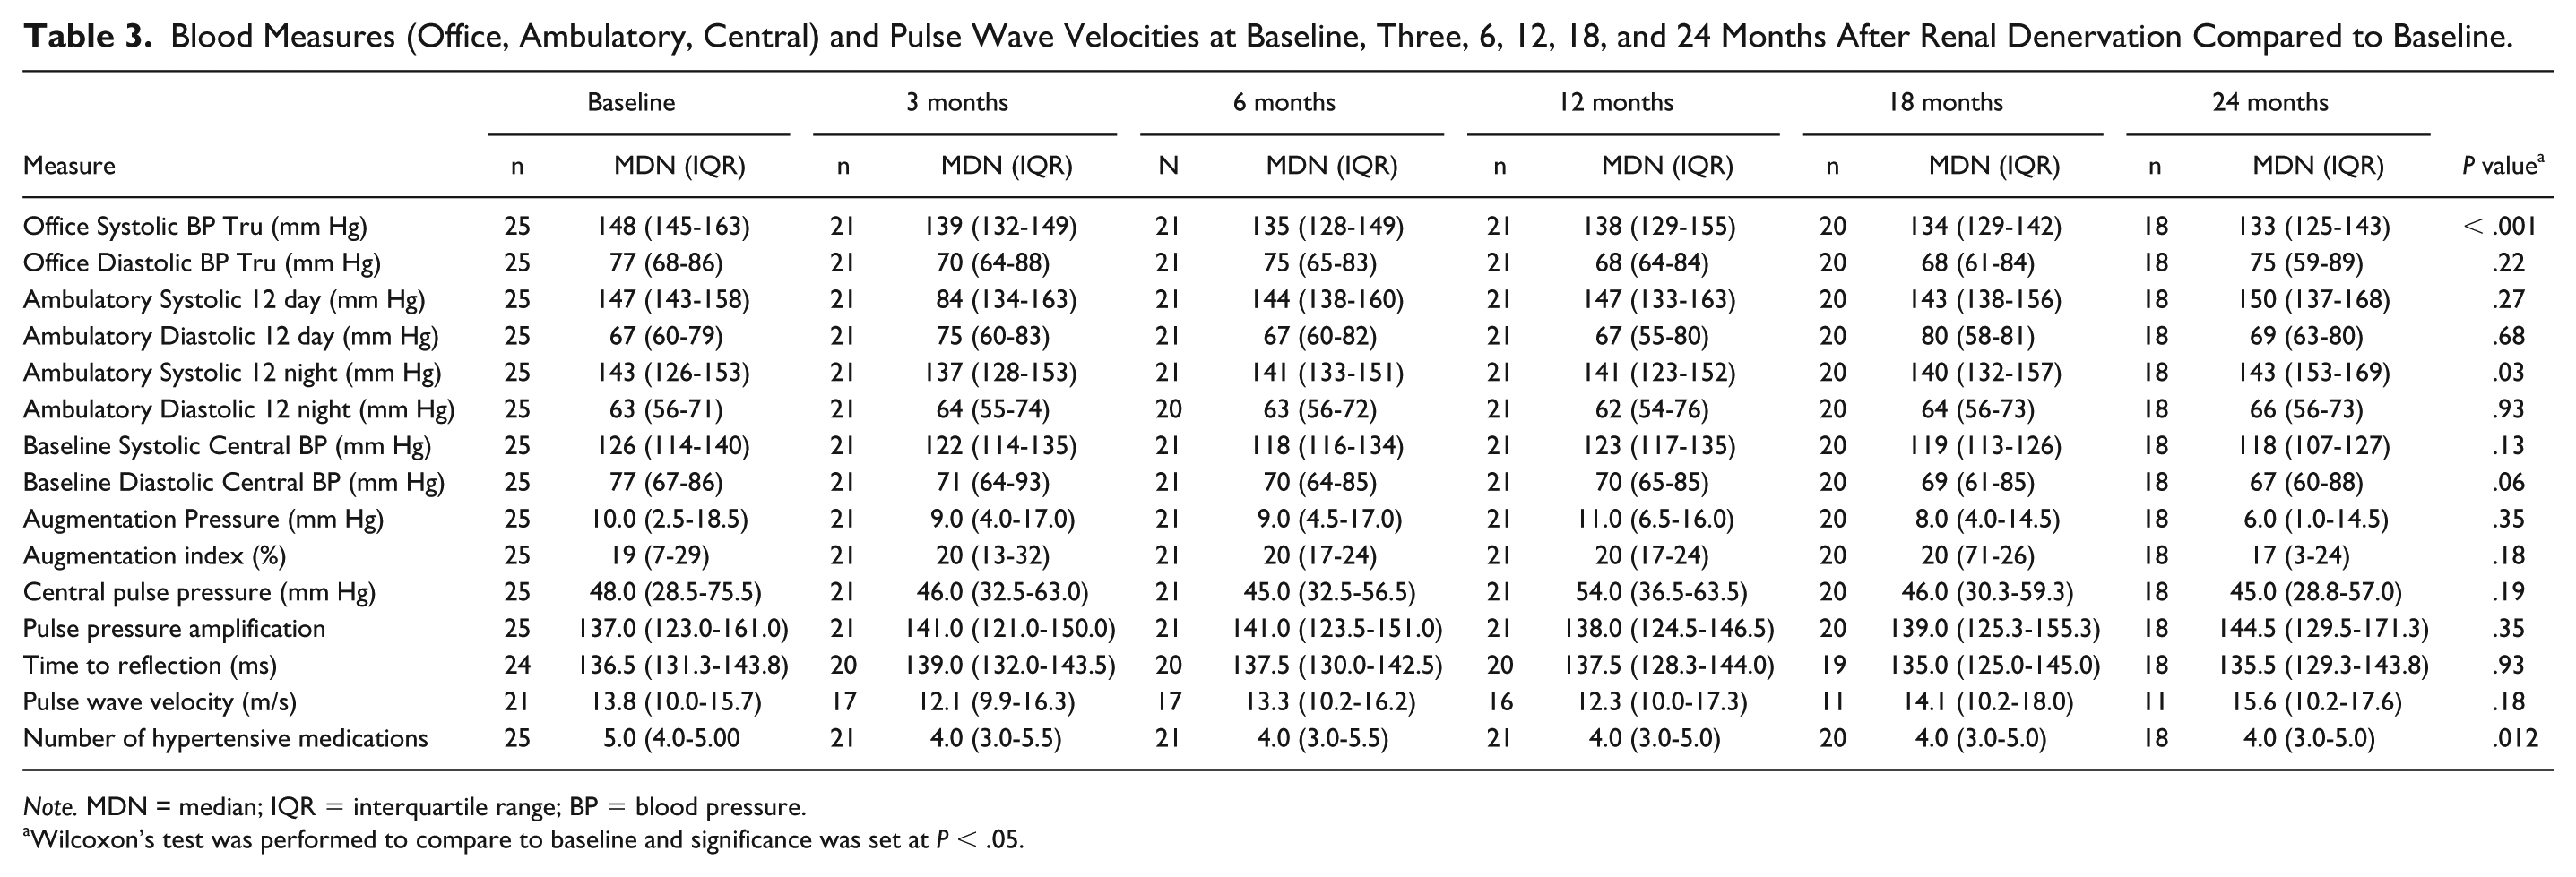
Note. MDN = median; IQR = interquartile range; BP = blood pressure.
Wilcoxon’s test was performed to compare to baseline and significance was set at P < .05.
The median GFR (IQR) (MDRD) was 37 (28.5-47.5) at baseline, 39.0 (25.5-55.0), at 6 months, 39.0 (23.5-48.5) at 12 months, and 34.0 (18.0-55.5) at 24 months, (P = .33). ACR (mg/mmol) was 49.9 (9.4-137.2) at baseline, 16.1 (2.2-118.4) at 6 months, 45.9 (5.4-130.7) at 12 months, and 81.8 (5.4-189) at 24 months, (P = .064) (Table 4). The number of medications was 5 (4.5-5.0) at baseline, 4.0 (3.5-5.0) at 6 months, 4.0 (3.0-5.0) at 12 months, and 4.0 (3.0-5.0) at 24 months, (P = .012). During the RDN intervention, participants received Isovue (Iopamidol) 300 (Bracco Imaging, Princeton, USA) mL (mean ± SD) (71.0 ± 52.5) and the delivery of thermal energy (mean ablations ± SD) (8.3±2.3).
Renal Median Measures at Baseline, Three, 6, 12, 18, and 24 Months After Renal Denervation Compared to Baseline.

Note. MDN = median; IQR = interquartile range.
Wilcoxon’s test was performed to compare to baseline and significance was set at P < .05.
MDN= median; MDRD = modification of diet in renal disease.
Discussion
In this single center, single-arm prospective study involving 25 patients pre/post RDN, we observed an improvement in office blood pressures post RDN lasting up to 24 months. Similarly, CBP declined consistently over the course of 24 months and although it did not meet statistical significance. While there was a numerical decline in ambulatory blood pressures for up to 12 months, it did not meet statistical significance. PWVs were reduced, but also failed to reach statistical significance. Importantly, we observed a stable eGFR for up to 24 months. Although, there was a short-term improvement in urine protein excretion rates, this did not persist for 24 months.
Hering et al 19 conducted RDN (Symplicity catheter) in 15 participants with stages 3 and 4 CKD and presented follow-up data at 3 and 6 months. The baseline eGFR (MDRD) was 31.2 (±8.9), at 3 months were 32.6 (8.9), and at 6 months were 29.0 (±7.3), P = .22). There was a reduction in 24-hour urine protein from 1.4 (±0.52) g/day, to 0.82 (±0.36) g/day at 3 months, and 0.81 (±0.76) g/day, at 6 months. There was an impressive reduction in office blood systolic pressures from baseline: 174 (±22) mm Hg, to 147 (±29) mm Hg at 3 months and 145 (±18) mmHg at 6 months. However, as with our study, they observed no significant improvement in ambulatory blood pressures comparing baseline with 6 months. Hering et al were the first to observe that percutaneous RDN appeared to be safe in patients with stages 3 and 4 CKD and was associated with an improvement in office blood pressures.
Ott et al 20 performed RDN (Symplicity unipolar catheter) on 27 participants with stages 3 and 4 CKD. The mean office baseline blood pressures were 156/82 (±12/13) mm Hg. About 12 months post procedure; the mean office blood pressure was lowered 20/8 (±8/14) mm Hg. They also observe a stable eGFR at 12 months post procedure. These results add to the safety of RDN from a renal perspective and improvement in office blood pressure readings. Kiuchi et al 21 reported on 27 patients with CKD (stages 2 to 4) who underwent RDN (Symplicity catheter) and were followed for 12 months. They were divided into 2 groups (responders vs. nonresponders). The responders whose eventual office BP was <140/90 mm Hg at 12 months had an improvement in the median ACR (mg/mmol) from 84.3 to 47.4 and in the nonresponders (eventual office BP>140/90 at 12 months), the ACR (mg/mmol) was elevated from a median of 84.3 to 154.4. There was no difference of eGFR in the responders and nonresponders. The authors did not specify the outcome of 9 of the 27 patients who were in stages 3 and 4, and it’s hard to specifically extrapolate their renal outcomes at 12 months. Our study supports the safety of RDN in CKD and extends the observation period up to 24 months.
We failed to see a significant improvement in PWV post RDN. It may be that arterial stiffening in CKD patients involves factors more akin to CKD, such as medial calcification, volume overload, endothelial dysfunction, increased extracellular matrix, and intimal fibroelastic thickening. While percutaneously administered RDN leads to a decline in the sympathetic drive, the lack of success in seeing an associated reduction in PWV may mean that factors other than sympathetic drive are more dominant in arterial stiffness in CKD.
Despite these exposures to contrast media and ablation, our participants with CKD stages 3 and 4 appeared to tolerate the procedure well and demonstrated long term safety in kidney function. We also did not notice any periprocedural complications (excessive bleeding, pseudoaneurysms, and dissections). This study highlights how clinical management in a community dwelling provided long-term safety data for this invasive procedure over 2 years of follow-up. The number of ablations to achieve better denervation has now been seen as an important variable in attaining clinical success. In contrast to the recently published SPYRAL HTN 3 study, where mean (± SD) of 43.8 (±13.1) were used bilaterally, 8.3 (±2.3) ablations were used in our study. Anatomical barriers led to 4 of 25 patients underwent unilateral denervation, which also likely contributed to lack of long-term success. Also, the mean office systolic blood pressure was in the 150s and lower than the Hering study but similar to the Ott group.
Limitations
There are several limitations to our study. There was no control group, and we recruited a relatively modest convenience sample of 25 participants of whom 4 were lost to follow-up. Medication changes were not protocolized and individual nephrologists were enabled to make their own choices in contrast to more regulated multicenter studies. 22 We are the only study that used the Bp Tru for our office BP, but it’s commonly used in Physician offices in Canada. Our study was conducted in a community dwelling and while we checked compliance on Pharmaceutical Information Program (PIP) which allows physicians access medication profile of all provincial residents, we did not conduct any questionnaires regarding compliance/adherence, and the study coordinator did not monitor intake of BP-medication prior to BP-measurements. Similarly screening for drug metabolites in plasma or urine was not performed in the study and it might have played a role in the outcome of the study.
Conclusion
In summary, we found that RDN was effective in office blood pressure reduction, and importantly it appeared to be safe in participants with NKF stages 3 and 4 kidney disease for up to 2 years. The recent success of the OFF-MED RDN trial provides some evidence that RDN will continue to be a potential tool in the management of hypertension, and long-term safety data will be valuable in discussing this option with potential patients.
Footnotes
Appendix
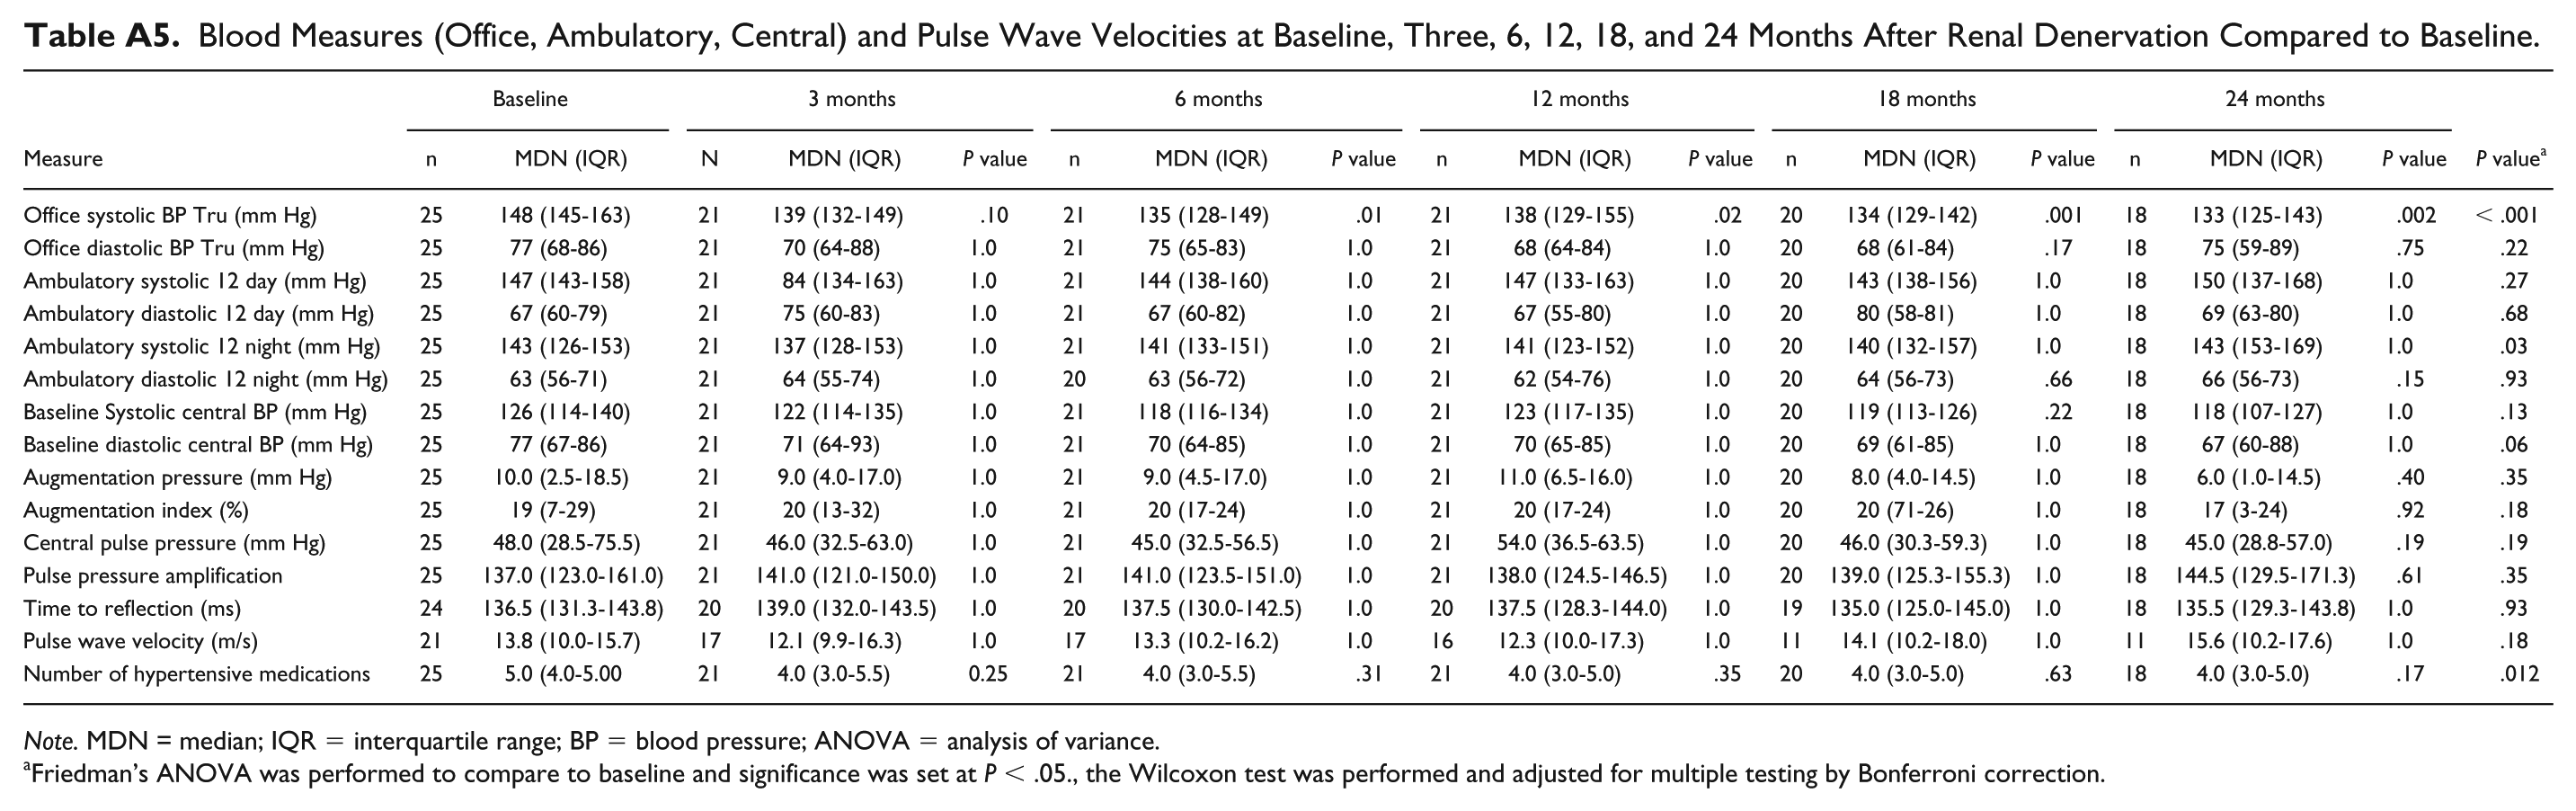
Blood Measures (Office, Ambulatory, Central) and Pulse Wave Velocities at Baseline, Three, 6, 12, 18, and 24 Months After Renal Denervation Compared to Baseline.
| Measure | Baseline |
3 months |
6 months |
12 months |
18 months |
24 months |
P value
a
|
|||||||||||
|---|---|---|---|---|---|---|---|---|---|---|---|---|---|---|---|---|---|---|
| n | MDN (IQR) | N | MDN (IQR) | P value | n | MDN (IQR) | P value | n | MDN (IQR) | P value | n | MDN (IQR) | P value | n | MDN (IQR) | P value | ||
| Office systolic BP Tru (mm Hg) | 25 | 148 (145-163) | 21 | 139 (132-149) | .10 | 21 | 135 (128-149) | .01 | 21 | 138 (129-155) | .02 | 20 | 134 (129-142) | .001 | 18 | 133 (125-143) | .002 | < .001 |
| Office diastolic BP Tru (mm Hg) | 25 | 77 (68-86) | 21 | 70 (64-88) | 1.0 | 21 | 75 (65-83) | 1.0 | 21 | 68 (64-84) | 1.0 | 20 | 68 (61-84) | .17 | 18 | 75 (59-89) | .75 | .22 |
| Ambulatory systolic 12 day (mm Hg) | 25 | 147 (143-158) | 21 | 84 (134-163) | 1.0 | 21 | 144 (138-160) | 1.0 | 21 | 147 (133-163) | 1.0 | 20 | 143 (138-156) | 1.0 | 18 | 150 (137-168) | 1.0 | .27 |
| Ambulatory diastolic 12 day (mm Hg) | 25 | 67 (60-79) | 21 | 75 (60-83) | 1.0 | 21 | 67 (60-82) | 1.0 | 21 | 67 (55-80) | 1.0 | 20 | 80 (58-81) | 1.0 | 18 | 69 (63-80) | 1.0 | .68 |
| Ambulatory systolic 12 night (mm Hg) | 25 | 143 (126-153) | 21 | 137 (128-153) | 1.0 | 21 | 141 (133-151) | 1.0 | 21 | 141 (123-152) | 1.0 | 20 | 140 (132-157) | 1.0 | 18 | 143 (153-169) | 1.0 | .03 |
| Ambulatory diastolic 12 night (mm Hg) | 25 | 63 (56-71) | 21 | 64 (55-74) | 1.0 | 20 | 63 (56-72) | 1.0 | 21 | 62 (54-76) | 1.0 | 20 | 64 (56-73) | .66 | 18 | 66 (56-73) | .15 | .93 |
| Baseline Systolic central BP (mm Hg) | 25 | 126 (114-140) | 21 | 122 (114-135) | 1.0 | 21 | 118 (116-134) | 1.0 | 21 | 123 (117-135) | 1.0 | 20 | 119 (113-126) | .22 | 18 | 118 (107-127) | 1.0 | .13 |
| Baseline diastolic central BP (mm Hg) | 25 | 77 (67-86) | 21 | 71 (64-93) | 1.0 | 21 | 70 (64-85) | 1.0 | 21 | 70 (65-85) | 1.0 | 20 | 69 (61-85) | 1.0 | 18 | 67 (60-88) | 1.0 | .06 |
| Augmentation pressure (mm Hg) | 25 | 10.0 (2.5-18.5) | 21 | 9.0 (4.0-17.0) | 1.0 | 21 | 9.0 (4.5-17.0) | 1.0 | 21 | 11.0 (6.5-16.0) | 1.0 | 20 | 8.0 (4.0-14.5) | 1.0 | 18 | 6.0 (1.0-14.5) | .40 | .35 |
| Augmentation index (%) | 25 | 19 (7-29) | 21 | 20 (13-32) | 1.0 | 21 | 20 (17-24) | 1.0 | 21 | 20 (17-24) | 1.0 | 20 | 20 (71-26) | 1.0 | 18 | 17 (3-24) | .92 | .18 |
| Central pulse pressure (mm Hg) | 25 | 48.0 (28.5-75.5) | 21 | 46.0 (32.5-63.0) | 1.0 | 21 | 45.0 (32.5-56.5) | 1.0 | 21 | 54.0 (36.5-63.5) | 1.0 | 20 | 46.0 (30.3-59.3) | 1.0 | 18 | 45.0 (28.8-57.0) | .19 | .19 |
| Pulse pressure amplification | 25 | 137.0 (123.0-161.0) | 21 | 141.0 (121.0-150.0) | 1.0 | 21 | 141.0 (123.5-151.0) | 1.0 | 21 | 138.0 (124.5-146.5) | 1.0 | 20 | 139.0 (125.3-155.3) | 1.0 | 18 | 144.5 (129.5-171.3) | .61 | .35 |
| Time to reflection (ms) | 24 | 136.5 (131.3-143.8) | 20 | 139.0 (132.0-143.5) | 1.0 | 20 | 137.5 (130.0-142.5) | 1.0 | 20 | 137.5 (128.3-144.0) | 1.0 | 19 | 135.0 (125.0-145.0) | 1.0 | 18 | 135.5 (129.3-143.8) | 1.0 | .93 |
| Pulse wave velocity (m/s) | 21 | 13.8 (10.0-15.7) | 17 | 12.1 (9.9-16.3) | 1.0 | 17 | 13.3 (10.2-16.2) | 1.0 | 16 | 12.3 (10.0-17.3) | 1.0 | 11 | 14.1 (10.2-18.0) | 1.0 | 11 | 15.6 (10.2-17.6) | 1.0 | .18 |
| Number of hypertensive medications | 25 | 5.0 (4.0-5.00 | 21 | 4.0 (3.0-5.5) | 0.25 | 21 | 4.0 (3.0-5.5) | .31 | 21 | 4.0 (3.0-5.0) | .35 | 20 | 4.0 (3.0-5.0) | .63 | 18 | 4.0 (3.0-5.0) | .17 | .012 |
Note. MDN = median; IQR = interquartile range; BP = blood pressure; ANOVA = analysis of variance.
Friedman’s ANOVA was performed to compare to baseline and significance was set at P < .05., the Wilcoxon test was performed and adjusted for multiple testing by Bonferroni correction.
Ethics Approval and Consent to Participate
This study was approved by the Regina Qu’Appelle Health Region Research Ethics Board (REB-12-73). Informed consent was obtained from all participants before enrolling them into the study.
Consent for Publication
All authors read and approved the final version of this manuscript.
Availability of Data and Materials
The raw data from this study cannot be made publicly available in order to protect participant confidentiality, as per the requirements of the RQHR Research Ethics Board.
Declaration of Conflicting Interests
The author(s) declared the following potential conflicts of interest with respect to the research, authorship, and/or publication of this article: Dr. Raymond Townsend is a Consultant for Medtronic. No other authors have any conflict of interest.
Funding
The author(s) received no financial support for the research, authorship, and/or publication of this article.