
Abstract
Background:
Cardiac magnetic resonance (CMR) imaging accurately and precisely measures left ventricular (LV) mass and function. Identifying mechanisms by which LV mass change and functional improvement occur in some end-stage kidney disease (ESKD) patients may help to appropriately target kidney transplant (KT) recipients for further investigation and intervention. The concentration of serum adiponectin, a cardiovascular biomarker, increases in cardiac failure, its production being enhanced by B-type natriuretic peptide (BNP), and both serum adiponectin and BNP concentrations decline posttransplantation.
Objective:
We tested the hypothesis that kidney transplantation alters LV characteristics that relate to serum adiponectin concentrations.
Design:
Prospective and observational cohort study.
Setting:
The study was performed at 3 adult kidney transplant and dialysis centers in Ontario, Canada.
Patients:
A total of 82 KT candidate subjects were recruited (39 to the KT group and 43 to the dialysis group). Predialysis patients were excluded.
Measurements:
Subjects underwent CMR with a 1.5-tesla whole-body magnetic resonance scanner using a phased-array cardiac coil and retrospective vectorographic gating. LV mass, LV ejection fraction (LVEF), LV end-systolic volume (LVESV), and LV end-diastolic volume (LVEDV) were measured by CMR pre-KT and again 12 months post-KT (N = 39), or 12 months later if still receiving dialysis (N = 43). LV mass, LVESV, and LVEDV were indexed for height (m2.7) to calculate left ventricular mass index (LVMI), left ventricular end-systolic volume index (LVESVI), and left ventricular end-diastolic volume index (LVEDVI), respectively. Serum total adiponectin and N-terminal proBNP (NT-proBNP) concentrations were measured at baseline, 3 months, and 12 months.
Methods:
We performed a prospective 1:1 observational study comparing KT candidates with ESKD either receiving a living donor organ (KT group) or waiting for a deceased donor organ (dialysis group).
Results:
Left ventricular mass index change was −1.98 ± 5.5 and −0.36 ± 5.7 g/m2.7 for KT versus dialysis subjects (P = .44). Left ventricular mass change was associated with systolic blood pressure (SBP) (P = .0008) and average LV mass (P = .0001). Left ventricular ejection fraction did not improve (2.9 ± 6.6 vs 0.7 ± 4.9 %, P = .09), while LVESVI and LVEDVI decreased more post-KT than with continued dialysis (−3.36 ± 5.6 vs −0.22 ± 4.4 mL/m2.7, P < .01 and −4.9 ± 8.5 vs −0.3 ± 9.2 mL/m2.7, P = .02). Both adiponectin (−7.1 ± 11.3 vs −0.11 ± 7.9 µg/mL, P < .0001) and NT-proBNP (−3811 ± 8130 vs 1665 ± 20013 pg/mL, P < .0001) declined post-KT. Post-KT adiponectin correlated with NT-proBNP (P = .001), but not estimated glomerular filtration rate (eGFR) (P = .13). Change in adiponectin did not correlate with change in LVEF in the KT group (Spearman ρ = 0.16, P = .31) or dialysis group (Spearman ρ = 0.19, P = .21).
Limitations:
Few biomarkers of cardiac function were measured to fully contextualize their role during changing kidney function. Limited intrapatient biomarker sampling and CMR measurements precluded constructing dose-response curves of biomarkers to LV mass and function. The CMR timing in relation to dialysis was not standardized.
Conclusions:
The LVESVI and LVEDVI but not LVMI or LVEF improve post-KT. LVMI and LVEF change is independent of renal function and adiponectin. As adiponectin correlates with NT-proBNP post-KT, improved renal function through KT restores the normal heart-endocrine axis.
What was known before
Left ventricular (LV) mass change and functional improvement occur in some adult chronic kidney disease (CKD) patients after kidney transplant (KT), but these changes are not demonstrable by cardiac magnetic resonance (CMR) imaging. Serum adiponectin concentrations are high in end-stage kidney disease (ESKD) and decline after KT.
What this adds
Left ventricular end-systolic volume index (LVESVI) and left ventricular end-diastolic volume index (LVEDVI) but not left ventricular mass index (LVMI) or left ventricular ejection fraction (LVEF), as measured by CMR, improve post-KT. LVMI change and LVEF change do not relate to adiponectin change, and adiponectin correlates with N-terminal pro-B-type natriuretic peptide (NT-proBNP) only after KT, indicating that the heart-endocrine axis requires adequate kidney function.
Introduction
Progressive chronic kidney disease (CKD) associates with cardiovascular disease including death, cardiovascular events, and hospitalization.1,2 Kidney transplant (KT) candidates with end-stage kidney disease (ESKD) are at increased risk of cardiovascular events, 3 and this risk extends to the post-KT phase of CKD 4 even though successful KT attenuates overall cardiovascular risk. 5 Traditional cardiovascular risk factors only partially explain posttransplant cardiovascular disease. 6 Mechanistic studies of altered cardiovascular risk are required when kidney function either declines, such as in the case of progressive CKD, or improves, such as after KT.
Among the measurable nontraditional cardiovascular risk factors, left ventricular hypertrophy (LVH) predisposes to mortality in dialysis populations. 7 Whether LVH regresses after KT is controversial; echocardiographic studies indicate improved left ventricular (LV) parameters,8,9 while cardiac magnetic resonance (CMR) imaging studies do not. 10 Yet CMR is more advantageous than echocardiography at assessing the LV in CKD because it provides greater detail of cardiac structure and affords less volume-dependent measurements.10,11 Mechanistic studies of LV changes in CKD therefore require CMR measurements for greater accuracy and precision. Moreover, both favorable and unfavorable LV changes occur in only a subset of CKD patients. Identifying mechanisms by which LV mass change and functional improvement occur in some but not all CKD patients may help to appropriately target KT recipients for further investigation and intervention, toward which CMR provides an essential accompanying tool.
Known determinants of LV mass in dialysis patients include LV end-diastolic volume (LVEDV) and predialysis blood pressure (BP).11,12 Although hypertrophy occurs initially, prolonged pressure or volume overload predisposes to congestive heart failure through ventricular wall thinning and chamber dilation. 13 Cardiovascular biomarkers are often studied in stable dialysis patients,11,14 but biomarker changes associated with changing renal function and changing cardiac morphology are studied only occasionally.10,12 Adiponectin, which is a protein secreted specifically from adipose tissue, is positively associated with endothelium-independent vasodilation, 15 anti-inflammatory activity, 16 and protection from myocardial ischemia 17 Adiponectin exerts cardioprotective effects under stress conditions, mediated through the T-cadherin receptor. 18 However, the role of adiponectin in determining LV morphology and function in CKD remains unknown. Adiponectin negatively correlates with LV mass index (LVMI) in obese subjects 19 and correlates with both LV mass and LV wall thickness in healthy adults 20 Serum adiponectin concentration increases in cardiac failure, its production being enhanced by B-type natriuretic peptide (BNP), 21 and so adiponectin is a candidate for the heart-adipose tissue endocrine pathway.22,23 Both adiponectin24,25 and N-terminal proBNP (NT-proBNP) concentrations 26 decline after KT. Taken together, adiponectin and NT-proBNP concentrations combined with CMR measurements may provide mechanistic insights into LV remodeling and altered LV function on the basis of altered kidney function resulting from KT.
The objectives of this prospective observational study, therefore, were to associate changes in LV mass and function with changes in serum adiponectin and NT-proBNP concentrations, as well as to evaluate the effect of KT on CMR-assessed cardiac structure and function.
Materials and Methods
Patient Population and Sample Size Calculation
Adult patients (18-75 years old) on hemodialysis or peritoneal dialysis being considered for single-organ KT were recruited at the time of their pretransplant assessment from 3 academic dialysis and KT centers in Ontario, Canada: St. Michael’s Hospital (lead site), Toronto General Hospital, and London Health Sciences Centre. Predialysis patients were excluded even if deemed eligible for KT. Patients were recruited to one of 2 groups depending on their availability of a potential living kidney donor. The KT group consisted of dialysis patients expected to receive a living donor KT within 2 months; the dialysis group consisted of patients without identified living donors and therefore not expected to receive a transplant for the next 24 months based on current Ontario waiting times. Cardiac magnetic resonance was performed at recruitment in both groups (baseline), and then repeated 12 months post-KT in the case of the KT group or 12 months after the first measurement in the case of the dialysis group. Immunosuppression for the KT group was not prespecified, other than an intention to reduce prednisone to 5 mg/d or less within 2 months. In the event a patient in the dialysis group unexpectedly received a KT within 12 months, the second CMR was performed 12 months post-KT. The required sample size of 35 patients per group was estimated based on the ability to detect a significant change in adiponectin concentrations of 5 µg/mL post-KT 25 at 90% power, 2-sided P < .05. To allow for a 20% attrition rate between CMR measurements, recruitment was increased to 42 patients per group.
Patients were excluded from the study if perceived by site investigator opinion to be at high immunological risk or unlikely to ever receive a transplant, or had uncontrolled hypertension when assessed, in which case enrollment was delayed until BP was controlled. Besides predialysis patients, recruitment exclusions were invoked for an acute coronary syndrome or coronary revascularization procedure (percutaneous coronary intervention, coronary bypass surgery) within the past 6 months, severe heart failure (defined as New York Heart Association functional class IV), chronic atrial fibrillation, or presence of a pacemaker/implantable cardiac defibrillator. Pregnant patients or those with a declared intention to pursue pregnancy within 12 months, along with those with cachexia (body mass index [BMI] <18 kg/m2), morbid obesity (BMI >35 kg/m2), or claustrophobia, were excluded.
CMR Procedure
Patients underwent CMR with a 1.5-tesla whole-body magnetic resonance scanner (Intera; Philips Medical Systems, Best, The Netherlands) using a phased-array cardiac coil and retrospective vectorographic gating. The CMR was performed postdialysis (if on hemodialysis) whenever possible to minimize intravascular volume. Cardiac magnetic resonance images were typically acquired during breath-holds in end-expiration with the patient supine, and 8 to 12 contiguous short-axis cine images to cover the entire left ventricle were obtained. Segmented, balanced, steady-state free-precession imaging sequence was used. Typical imaging parameters were the following: repetition time, 4 ms; echo time, 2 ms; slice thickness, 8 mm; field of view, 30-34 cm × 30-34 cm; matrix size, 256 × 196; temporal resolution, <40 ms; and flip angle, 50°. All images were reviewed by a cardiac imager (ATY) blinded to patient group. Image processing was performed offline using commercial software (CVi42 Circle Cardiovascular Imaging, Calgary, Canada), with manual tracing of endocardial borders at end diastole and end systole using short-axis cine images. Endocardial and epicardial borders in contiguous short-axis slices at end diastole were traced and the difference in area was then multiplied by slice thickness and myocardial density and summed to calculate LV mass. Papillary muscles were excluded. The LV mass, left ventricular end-diastolic volume (LVEDV), and left ventricular end-systolic volume (LVESV) were normalized (indexed) by dividing their value to height in meters powered to 2.7. 27 Left ventricular ejection fraction (LVEF) was not indexed.
CMR outcome measures included change in left ventricular mass index (LVMI), LVEF, left ventricular end-systolic volume index (LVESVI), and left ventricular end-diastolic volume index (LVEDVI) from pre-KT to 12 months post-KT, or 12 months later while still on dialysis, depending on group.
Adiponectin and B-Natriuretic Peptide Measurements
Total adiponectin concentration was measured using the Meso Scale Discovery Human Adiponectin kit #K151BXC-2 immunoassay (Meso Scale Diagnostics, Rockville, Maryland) and calibrated to the Millipore enzyme-linked immunosorbent assay (Kit #EZHADP-61-K; Millipore, St. Charles, MO, USA). The adiponectin assay had a between-day coefficient of variation of 13.4% and 13.3% at values of 8.8 and 21 µg/mL, respectively. N-terminal proBNP was measured using the Roche Cobas 6000 601e assay (Mississauga, ON, Canada). Both adiponectin and NT-proBNP concentrations were additionally measured 3 months posttransplant or 3 months postbaseline to confirm intra-patient consistency and assay reliability.
Biochemical measures included change in serum adiponectin and NT-proBNP concentrations from pre-KT to 12 months post-KT or 12 months later while still on dialysis, depending on group, with an added measure at 3 months post-KT to ensure intrapatient assay reliability. Demographic, anthropometric, and laboratory measures, as well as cardioprotective medication use, were also collected at baseline and 12 months.
Statistical Analysis
CMR-measured changes depend on spaced measurements and were therefore not analyzed by an intent-to-treat method, to correctly account for the ESKD condition (post-KT or dialysis) under which the second measurement was performed. Between-group comparisons were made by the unpaired Student t test, Wilcoxon rank sum test, Fisher exact test, or chi-square analysis as appropriate. Ranked variables were examined using the Spearman rank-order correlation (ρ). Correlation of the change in (month 12 minus baseline) and the average of month 12 and baseline LV values was performed as described by Oldham 28 to accurately account for regression to the mean seen with high baseline values in chronic disease conditions. A 2-tailed value of P < .05 was considered significant for all analyses. SAS version 9.4 (Cary, NC, USA) was the statistical software used in all analyses. Graphs were plotted using GraphPad Prism 6.0.
The study was approved by the Research Ethics Board at St. Michael’s Hospital (REB 10-239) and by the ethics boards at the collaborating sites. All subjects provided written informed consent. The work described has been carried out in accordance with The Code of Ethics of the World Medical Association (Declaration of Helsinki) for experiments involving humans.
Results
Recruitment, Baseline Characteristics, and Study Completion
A total of 39 subjects were recruited to the KT group and 43 patients to the dialysis group after providing informed consent. Among these, 37 and 41 subjects, respectively, completed the study including both CMR assessments, for an overall study retention rate of 95%. The baseline characteristics of the KT and dialysis groups are provided in Table 1. Demographic differences of age, ethnicity, and cause of kidney failure between the transplant and dialysis groups reflect differences between recipients with living donors and those without living donors. However, there were no differences seen in prior cardiovascular disease burden or cardiovascular risk factor–modifying therapies. Reasons for noncompletion of the study (N = 4) included primary graft failure in the transplant group (N = 2) and reluctance to undergo a second CMR procedure, also in the transplant group (N = 2). Two patients crossed over from the dialysis to the transplant group by receiving a deceased donor KT sooner than expected. The 2 patients with KT failure did not cross over to the dialysis group for analysis due to study noncompletion. No patients experienced major adverse cardiac events between CMR measurements. Median inter-CMR scan interval was 371 days in the transplant group and 364 days in the dialysis group. Most subjects (>90%) on peritoneal dialysis were empty at the time of CMR. However, for pragmatic reasons, only 56% of subjects on hemodialysis underwent CMR on their nondialysis day.
Demographic and Baseline Characteristics of Patients in the Transplant Group (N = 39) and Dialysis Group (N = 43).

Note. ACE = angiotensin-converting-enzyme.
Month 12 Characteristics
At 12 months, the serum creatinine in the KT group was 140 ± 117 µmol/L (range: 76-631 µmol/L). Compared with the dialysis group, the KT group demonstrated a lower serum parathyroid hormone (16 ± 19 vs 48 ± 41 pmol/L, P < .001) and phosphate concentration (0.9 ± 0.2 vs 1.5 ± 0.5 mmol/L, P < .0001), as well as a higher serum albumin concentration (43 ± 3 vs 41 ± 4 g/L, P = .003). There were, however, no significant differences between the KT and dialysis groups in body weight (82 ± 15 vs 74 ± 17 kg, P = .06), systolic BP (125±17 vs 134±28 mm Hg, P = .07), diastolic BP (78 ± 11 vs 78 ± 12 mm Hg, P = .77), or serum total cholesterol concentration (4.4 ± 1.2 vs 3.9 ± 1.1 mmol/L, P = .06). At 12 months, there was also greater use of angiotensin II receptor blockers (92% vs 70%, P = .01) and statins (50% vs 19%, P = .003) in the KT group compared with the dialysis group. Immunosuppression administered to the KT group consisted of tacrolimus in 71%, cyclosporine in 28%, mycophenolic acid or mycophenolate mofetil in 88%, and prednisone in 97%. One patient received sirolimus. All KT recipients received induction therapy with either basiliximab or thymoglobulin.
Determinants of LVMI
The change in LVMI for each subject in the 2 groups is shown in Figure 1. Baseline LVMI was significantly associated with baseline SBP (P = .0006) although not with recruitment status to KT or dialysis group (P = .50). LVMI at 12 months was similarly associated with SBP (P < .0001), but not concurrent KT status (P = .74). Similarly, baseline LVMI was associated with baseline SBP (P < 0.0001), but not recruitment group (P = .76). At month 12, SBP (P < .0001) remained significantly associated with LVMI, but KT status was again not associated with LVMI (P = 0.68). Thus, KT did not result in detectable LV mass changes even after indexing, and SBP remained the important determinant of LVMI regardless of KT status.

Change in LVMI and LV ejection fraction for each subject in the transplant and dialysis groups.
Change in SBP correlated with change in LVMI in both the KT and dialysis groups (ρ = 0.54, P = .0008; ρ = .36, P = .019, respectively) (Figure 2). Change in DBP also correlated with change in LVMI for both KT and dialysis groups (ρ = 0.38, P = .024 and ρ = 0.53, P = .0004, respectively). By regression analysis, in the KT group the average LV mass explained 29% and SBP change 23% of the variance in change in LVMI (P < .001 for each). In the dialysis group, change in SBP explained 21% of variance of change in LVMI (P = 0.002), whereas average LVMI was not a significant contributor (P = .92).

Relationship between change in systolic blood pressure (mm Hg) and change in LVMI in the transplant and dialysis groups.
Correlation of the change in LVMI with average LVMI, instead of with baseline LVMI to avoid the phenomenon of regression to the mean, 28 demonstrated a strong negative relationship in the KT group (ρ = −0.55, P = .0001), but not in the dialysis group (ρ = −0.08, P = .60) (Figure 3). In the KT group, the slope of the straight line fit was −0.49, with r2 of 0.31, by which an average LV mass of 104 g would result in zero change in LV mass. In sum, improved renal function in the form of KT unmasks the relationship between initial LVMI and LVMI change, whereby subjects with the largest average LV mass experience the greatest decrease in LVMI, while subjects having the smallest average mass may even experience an increase in LVMI.

Relationship between change in LVMI and average of baseline and month 12 LVMI in the transplant and dialysis groups.
Other LV Changes
In addition to LV mass, LVESV and LVEDV values (both indexed and nonindexed) and LVEF for the transplant and dialysis groups are shown in Table 2. Baseline LV mass and LVEF were not different between the 2 groups. LVESVI was marginally greater in the transplant group at baseline. Similarly, month 12 LVMI and LVEF were not different between the groups. Both LVESVI and LVEDVI decreased after KT, abolishing possible baseline group differences. LVEF increased more in the KT group than in the dialysis group, but not significantly so (Figure 1, Table 2). By contrast, the decrease in LVESVI and LVEDVI was significantly greater in the KT group than in the dialysis group (Table 3).
Baseline and 12-Month Cardiac Magnetic Resonance (CMR) Imaging and Biochemical Measurements.

Note. LV = left ventricular; NT-proBNP = N-terminal pro-B-type natriuretic peptide.
Change in Cardiac Magnetic Resonance (CMR) Imaging and Biochemical Measurements Over 12 Months.

Note. LV = left ventricular; NT-proBNP = N-terminal pro-B-type natriuretic peptide.
Role of Adiponectin and NT-proBNP in LV Change
Serum adiponectin concentrations did not differ between the KT and dialysis groups at baseline, but at 12 months serum adiponectin concentration was significantly lower in the KT group compared with the dialysis group (Table 2) (P = .04). Serum adiponectin concentration decreased significantly in the KT group while remaining unchanged in the dialysis group (Table 3, Figure 4). Similar to the case with adiponectin, serum NT-proBNP concentration did not differ between the KT and dialysis subjects at baseline but was lower in the KT group at 12 months (Table 3), showing a greater decrease in the KT group (Table 2, Figure 5). There were no differences between the 3-month and 12-month serum adiponectin and NT-proBNP concentrations (Figures 4 and 5).
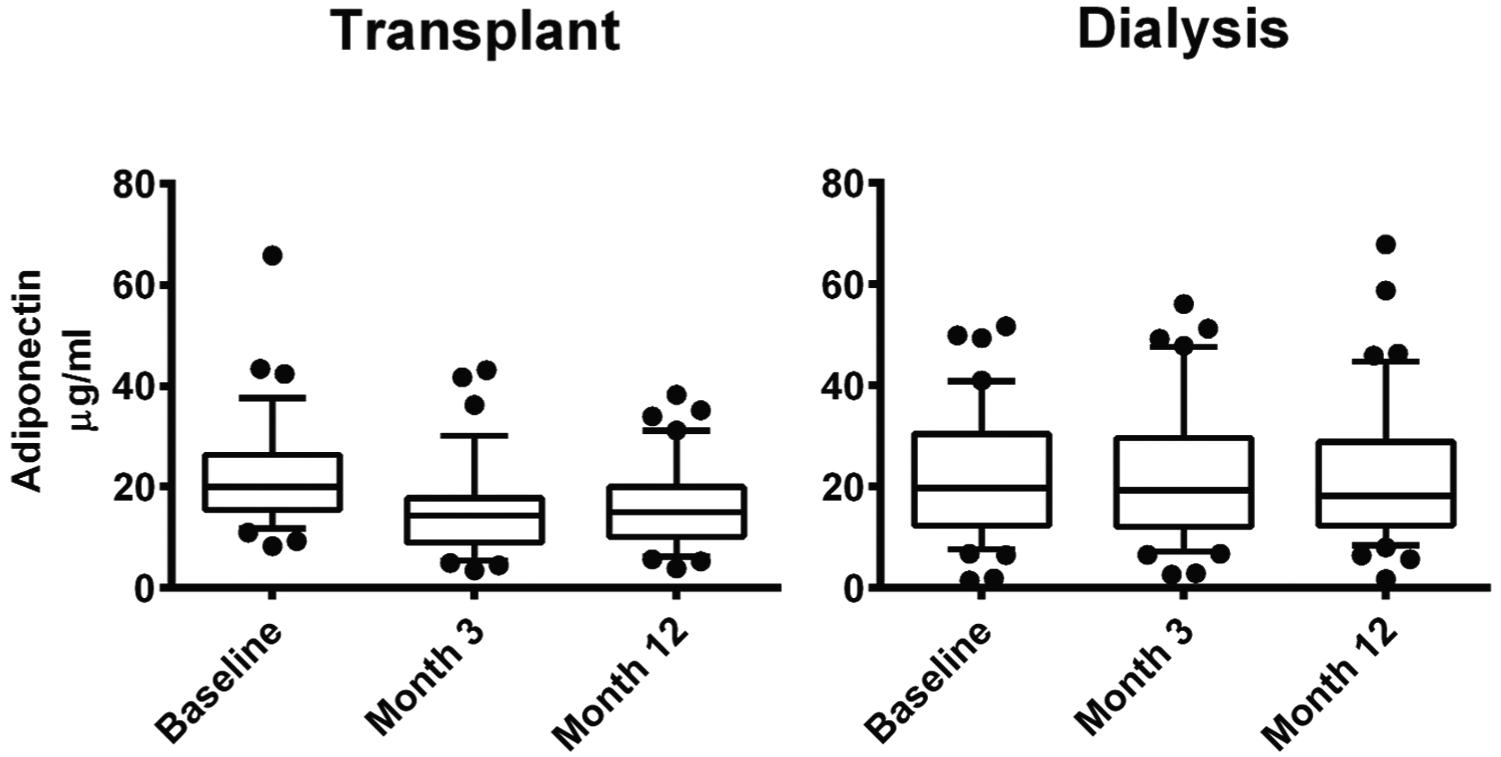
Serum adiponectin concentrations at baseline, 3 months, and 12 months in the transplant and dialysis groups.

Serum N-terminal pro B-type natriuretic peptide (NT-proBNP) concentrations at baseline, 3 months, and 12 months in the transplant and dialysis groups.
Serum adiponectin concentration correlated with NT-proBNP concentration at 12 months post-KT (P = .001), but not with estimated glomerular filtration rate (eGFR) (P = .13). Serum adiponectin concentration, however, did not correlate with serum NT-proBNP concentration in dialysis subjects (P = .50), indicating that the relationship of adiponectin to NT-proBNP is masked by ESKD.
The change in serum adiponectin concentration did not correlate with change in LVMI in either KT or dialysis subjects (ρ = 0.14, P = 0.14; ρ = 0.11, P = .48, respectively). Serum NT-proBNP change also did not correlate with change in LVMI for the transplant group (ρ = 0.20, P = .24) although a correlation with LVMI was seen for the dialysis group (ρ = 0.57, P = .0001). In both the KT and dialysis groups, change in adiponectin concentration did not correlate with change in LVEF (ρ = 0.02, P = 0.87; ρ = −0.22, P = .15). Moreover, in both the KT and dialysis groups, change in serum adiponectin concentration did not correlate with either change in LVESVI (ρ = 0.16, P = .31; ρ = 0.19, P = .21, respectively) or change in LVEDVI (ρ = 0.30, P = .07; ρ = −0.003, P = .98, respectively). Change in NT-proBNP concentration also did not correlate with change in LVMI in the KT group or dialysis group (ρ = 0.20, P = .24; ρ = −0.07, P = .65) or change in LVEF in the KT group (ρ = −0.12. P = .47). On the contrary, change in NT-proBNP concentration correlated with change in LVMI in the dialysis group (ρ = 0.57, P = .0001) and with both change in LVESVI (ρ = 0.47, P = .004; rho =0.48, P = .001, respectively) and change in LVEDVI (ρ = 0.47, P = 0.003; ρ = 0.49, P = .001, respectively) in both the KT and dialysis groups.
No sex-based or ethnicity-based differences were present in all analyses.
Discussion
In this prospective observational study, we hypothesized that improved renal function in patients with ESKD associates with change in LV mass and function, and that this change relates to the expected change in serum adiponectin concentration. We demonstrated that both LVMI and LVEF do not significantly improve after KT, but improved renal function through KT unmasks the relationship between initial LVMI and subsequent LVMI change. Both SBP and DBP determine LVMI both before and after KT. Unlike with LVMI and LVEF however, we showed for the first time using CMR that both LVESVI and LVEDVI significantly improve after KT in adults. In addition, both serum adiponectin and serum NT-proBNP concentrations decrease after KT and correlate with each other only after KT. Change in serum adiponectin concentration does not correlate with change in LVMI, LVEF, LVESVI, or LVEDVI either before or after KT. On the contrary, change in serum NT-proBNP concentration correlates with change in both LVESVI and LVEDVI, both before and after KT.
The current study is the first to show that adiponectin does not significantly determine LV mass or function in kidney disease populations. Serum adiponectin concentrations vary significantly in patients on dialysis, but are lower in most patients after KT. Serum adiponectin concentrations correlate with NT-proBNP concentrations after KT, which is a finding consistent with an endocrine function for the heart that requires adequate renal function for its expression. Adiponectin modulates glucose uptake and fatty acid oxidation via adenosine monophosphate (AMP)–activated protein kinase–dependent signaling pathways, through T-cadherin and other receptors. 29 Thus, adipose tissue has a dual response, both in mobilizing fatty acid and in improving insulin sensitivity and glucose utilization. High adiponectin concentration is therefore normally beneficial. Adipocytes produce adiponectin, in response to natriuretic peptides, 21 which returns to the heart to exert its beneficial effects on cardiac myocytes. NT-proBNP, an established marker of cardiac function, is itself cleared primarily by the kidneys. 30 The extreme elevations of adiponectin in kidney disease should not be considered as a uremic toxin, 31 but rather may represent saturation of the normal physiologic response.
CMR is currently the best available technique to provide accurate and reproducible measurements of LV mass, 32 which unlike 2-dimensional echocardiography provides less volume-dependent measurement of cardiac structure and avoids the overestimation of LV mass resulting from LVH and distorted ventricular geometry 33 Unlike a previous CMR study of LV changes resulting from KT in adults, 10 we demonstrated improved LV volume but not mass or function after KT. Our unique result may derive from some combination among an increased sample size by 50%, differing CMR technology, or, most likely, an adjustment of LV parameters using a gender-specific method. Improved LV parameters by CMR have been demonstrated previously in children, 34 indicating that gender adjustment assumes particular importance in adults. Currently employed index adjustments may not apply to women or mixed cohorts. Improved renal functional replacement can be provided and CMR changes detected by means other than KT, such as nocturnal hemodialysis, 35 so it should not be surprising that improved renal function corresponds to at least some improved LV parameters, despite the known limitations of observations derived from echocardiographic studies.7-9,36
A relationship between LV mass and SBP is well established, and so ESKD patients should be unexceptional in this respect. SBP strongly predicts LVH in ESKD.11,37 As the predictive value of SBP persists after KT, the effect of SBP on LV mass is clearly independent of renal function. Therefore, SBP should remain a therapeutic target in all patients with ESKD with the goal of cardiovascular risk reduction, keeping in mind that LV disorders associate with both cardiovascular disease 7 and mortality 38 in ESKD patients. Factors relating BP to LV mass are shared between dialysis and transplant subjects, but the net benefit of KT on cardiovascular risk profiles probably relates both independently and proportionately to absolute LV mass.
Our demonstration that the serum adiponectin concentration declines after KT is in keeping with previous analyses,25,39 but we additionally demonstrated that the relationship of serum adiponectin concentration with serum NT-proBNP concentration is unmasked by restored renal function. Restoration of renal function contributes to change in LV mass, but as adiponectin change does not correspond to LV mass change when renal function is restored, lowered adiponectin may either not locate on the causal pathway to LVH regression or any effect it has may be masked by a much stronger effect of BP on LV mass. The present study is limited in its analysis of few biomarkers of cardiac function and serves only to contextualize the cardiac role of adiponectin and NT-proBNP to changing kidney function. The study also does not account for other variables introduced after KT, such as prednisone therapy. It is also unlikely that the higher rate of use of angiotensin II receptor blockers and statins at 12 months posttransplant affected any of the CMR results in this short-term study.
A high serum adiponectin concentration in CKD is a protective response to vascular damage, 40 even though a high serum adiponectin concentration associates with sudden death and combined cardiovascular event rates in hemodialysis patients, 41 as well as those with heart failure. 42 Most adiponectin change can therefore be attributed to change in renal function and intravascular volume, for which NT-proBNP is a useful surrogate because NT-proBNP strongly associates with both LVH and LV systolic function in CKD. 43 Up to three-quarters of patients with CKD have LVH at dialysis initiation. 44 Therefore, the present study indicates that adiponectin more likely serves a cardioprotective role in states of reduced renal function including ESKD, but assumes relatively less importance for such cardioprotection with improved renal function, as occurs after KT. Reduced adiponectin importance post-KT is compatible with the finding that a lower serum adiponectin concentration corresponds to lower cardiovascular risk in otherwise healthy subjects. 45
In summary, KT improves LVESVI and LVEDVI in patients with ESKD. BP primarily determines LVMI in both KT and dialysis patients. The LVMI declines the most in ESKD patients with the highest pre-KT LVMI. Further mechanistic studies of cardiovascular risk reduction in ESKD using biomarker-related or other methods will require CMR measurements of heart structure and function to ensure both accuracy and precision. Although adiponectin may simply accumulate in ESKD, it probably serves some cardioprotective role similar to that seen in other populations, but this beneficial effect of adiponectin is masked by the ESKD environment. As serum adiponectin and NT-proBNP concentrations correlate in KT patients but not in dialysis patients, restoring adequate renal function through transplantation restores at least in part the normal endocrine function of the heart involving adiponectin and NT-proBNP.
Footnotes
List of Abbreviations
BMI, body mass index; BP, blood pressure; CKD, chronic kidney disease; CMR, cardiac magnetic resonance imaging; DBP, diastolic blood pressure; ESKD, end-stage kidney disease; KT, kidney transplantation; LV, left ventricle; LVEDV, left ventricular end-diastolic volume; LVEDVI, left ventricular end-diastolic volume index; LVEF, left ventricular ejection fraction; LVESV, left ventricular end-systolic volume; LVESVI, left ventricular end-systolic volume index; LVH, left ventricular hypertrophy; LVMI, left ventricular mass index; NT-proBNP, N-terminal B-type natriuretic peptide; SBP, systolic blood pressure.
Ethics Approval and Consent to Participate
Ethics approval was obtained from the Research Ethics Boards at St. Michael’s Hospital, University Health Network, and London Health Sciences Centre. Informed consent was obtained from all participants.
Consent for Publication
All authors reviewed the final manuscript and provided consent for publication.
Availability of Data and Materials
Data and materials may be made available upon written request to the corresponding author. Reasonable requests for data access will be assessed in consultation with the appropriate Research Ethics Boards.
Author Contributions
GVRP coordinated research design, funding, performance of the research, writing, and data analysis. ATY participated in research design, performance of the research, writing, and data analysis. MMN participated in research design, writing, and performance of the research. SJK participated in research design, writing, and performance of the research. RW participated in research design, writing, and performance of the research. RW participated in research design and performance of the research. CL participated in research design and performance of the research. LG participated in research design, writing, and performance of the research. GRK participated in performance of the research and data analysis. AK participated in research design and performance of the research. PWC participated in research design, funding, performance of the research, writing, data analysis, and contributed new reagents and analytical tools.
Declaration of Conflicting Interests
The author(s) declared no potential conflicts of interest with respect to the research, authorship, and/or publication of this article.
Funding
The author(s) disclosed receipt of the following financial support for the research, authorship, and/or publication of this article: This study was funded by the Heart and Stroke Foundation of Canada, Grant Number HSFNA7077.