
Abstract
Summary
Objective
Listening to Mozart K.448 has been demonstrated to improve spatial task scores, leading to what is known as the Mozart Effect. However, most of these reports only describe the phenomena but lack the scientific evidence needed to properly investigate the mechanism of Mozart Effect. In this study, we used electroencephalography (EEG) and heart rate variability (HRV) to evaluate the effects of Mozart K.448 on healthy volunteers to explore Mozart Effect.
Design
An EEG-based post-intervention analysis.
Setting
Kaohsiung Medical University Hospital, Kaohsiung, Taiwan.
Participants
Twenty-nine college students were enrolled. They received EEG and electrocardiogram examinations simultaneously before, during and after listening to the first movement of Mozart K.448.
Main outcome measure
EEG alpha, theta and beta power and HRV were compared in each stage.
Results
The results showed a significant decrease in alpha, theta and beta power when they listened to Mozart K.448. In addition, the average root mean square successive difference, the proportion derived by dividing NN50 by the total number of NN intervals, standard deviations of NN intervals and standard deviations of differences between adjacent NN intervals showed a significant decrease, while the high frequency revealed a significant decrease with a significantly elevated low-frequency/high-frequency ratio.
Conclusion
Listening to Mozart K.448 significantly decreased EEG alpha, theta and beta power and HRV. This study indicates that there is brain cortical function and sympathetic tone activation in healthy adults when listening to Mozart K.448, which may play an important role in the mechanism of Mozart Effect.
Introduction
Music has been used to reduce anxiety and relax the minds in patients suffering from a number of medical diseases. 1 The ‘Mozart Effect’ was initially described by Rauscher et al. 2 They reported that students scored nine points higher on spatial tasks after listening to Mozart’s Sonata for two pianos in D major, K.448 (Mozart K.448) for 10 min when compared to the same time of silence or relaxation. Since then, benefits from listening to Mozart K.448 are reported for tinnitus, cognitive rehabilitation and epilepsy.3–6 These reports only mention the clinical manifestations, and at this time, there is very little scientific evidence showing the effect of listening to Mozart K.448 on the central nervous system. The mechanism by which music may modify brain function remains unclear. Electroencephalography (EEG) is helpful in evaluating cortical function. An EEG-correlated magnetic resonance imaging study demonstrates that EEG alpha power is inversely related to neural electrical activity. 7 In this study, we investigated the effect Mozart K.448 had on EEG oscillatory power and heart rate variability (HRV) to verify the ‘Mozart Effect’ on the cerebral cortex and to explore the possible mechanism.
Material and methods
Subjects
Twenty-nine healthy adult volunteers were enrolled in this study. Their average age was 24 years ±3 years 7 months. There were 21 males and eight females. Informed consent was signed by each participant. This study was approved by the Institutional Review Board of Kaohsiung Medical University Hospital (KMU-IRB-2012-01-09).
Electroencephalographic examinations
The volunteers in this study received 21-channel electroencephalogram (EEG) and electrocardiogram (EKG) examinations simultaneously before, during and after listening to the first movement of Mozart K.448 (8 min 22 sec). They received 60–70 dB of musical stimuli via loudspeakers, 8 which was measured with a decibel meter (DSL332, Taipei, Taiwan). The EEGs and EKGs were recorded digitally (Harmonie DVN V5.1, Montreal, Canada). The EEG and EKG recordings from the pre-music, during music and post-music stages were compared and analysed by computer. All recordings were performed during the daytime. To minimise factors influencing EEG power, each patient maintained the same state of wakefulness throughout the recording period. The EEGs during the three stages of the experiment were continuously monitored to ensure that changes of wakefulness did not occur.
EEG oscillatory power analysis
The EEG was recorded digitally by 12 symmetrical electrode pairs with longitudinal bipolar montage (Harmonie DVN V5.1, Montreal, Canada). The recorded EEG data were divided into before, during and after listening to piano K.448 stages for each subject. By means of the Fast Fourier Transform, the power spectrum of EEG was divided into the following frequency bands: theta wave (θ, 4–8 Hz), alpha wave (α, 8–13 Hz) and beta wave (β, 13–30 Hz). The spectral power changes of each frequency band for the three stages were compared to evaluate the effects of listening to music.
HRV analysis
The method used for the data acquisition of EKG signals and signal analysis adhered to the HRV standards. 9 There are five deflections in an EKG, arbitrarily named ‘P’ to ‘T’ waves. The QRS complex is the conjunction of three of the graphical deflections on a typical EKG. The Q wave is any downward deflection after the P wave. The R wave is the subsequent upward deflection, and the S wave is any downward deflection after the R wave. The consecutive RR intervals are measured by detecting the R wave between successive pairs of QRS complexes. All artefacts or ectopic beats were removed through visual inspection. Similar to EEG analysis, the stationary RR intervals were divided into three stages for HRV analysis. In the time domain, the square root of the mean squared differences of successive RR intervals (RMSSD), the standard deviation of the RR interval (SDNN), the standard deviations of differences between adjacent NN intervals (SDSD) and the proportion derived by dividing NN50 by the total number of RR intervals (pNN50), where NN50 is the number of interval differences of successive RR intervals greater than 50 ms, and the mean beats per minute (bpm) were used as the HRV measures for evaluating the effects of listening to music.
In the frequency domain, a frequency band ranging from 0.04 Hz to 0.15 Hz is called the low-frequency (LF) component, which is related to regulation of blood pressure and reflects the combined activity of the sympathetic and parasympathetic nervous systems. 10 The frequency band ranging from 0.15 Hz to 0.5 Hz is called the high-frequency (HF) component. This frequency band is caused by respiration and reflects the activity of the parasympathetic nervous system. 10 Moreover, an increase in the ratio of LF and HF (LF/HF) and a decrease of SDNN may serve as a reliable index of sympathetic activation.10,11
Statistical analysis
Data are shown as means ± SD. Paired t tests were used to compare alpha power and HRV before, during and after listening to the music. A p value less than 0.05 was considered to be statistically significant.
Results
EEG oscillatory power change during and after music exposure
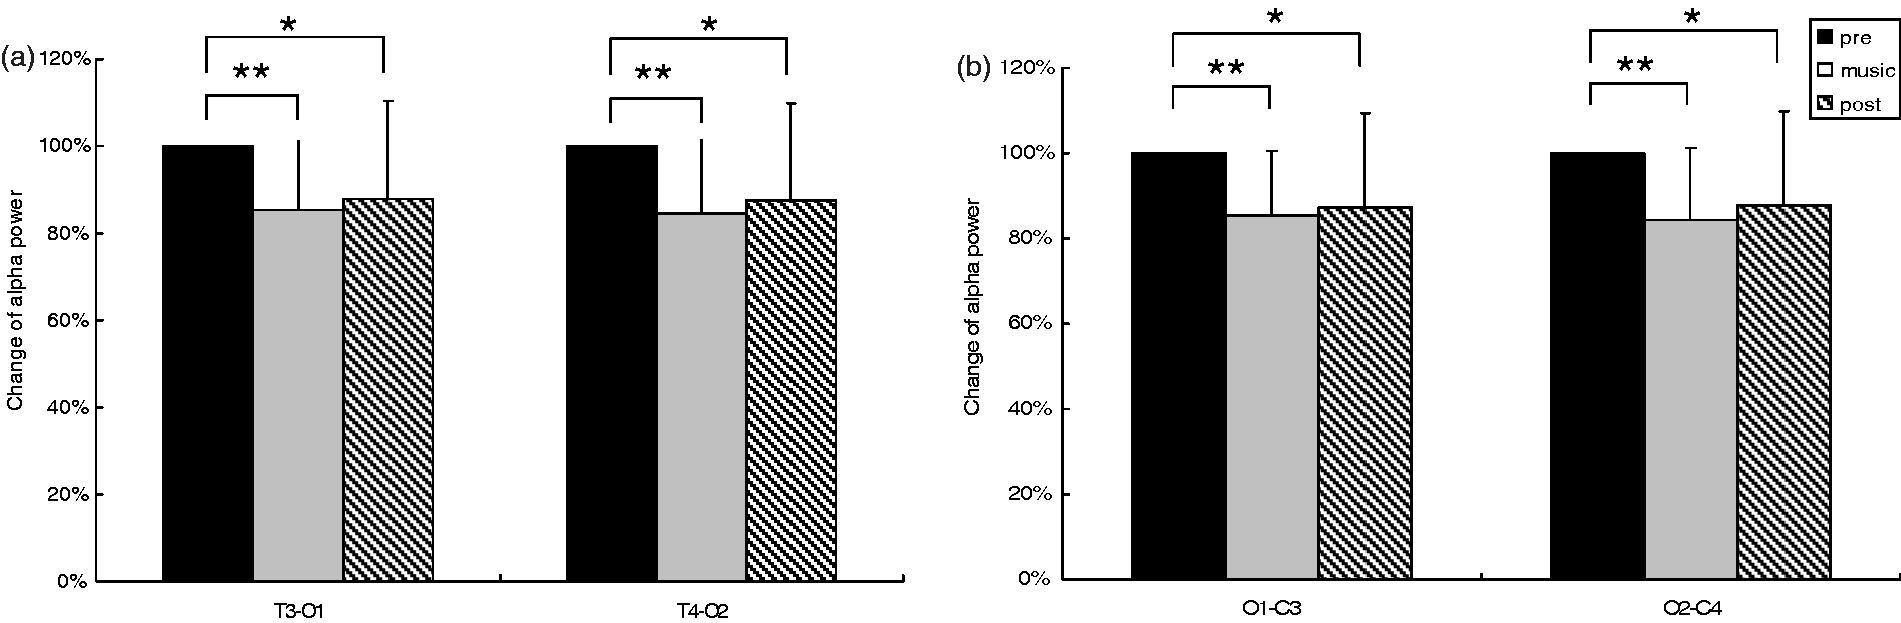
During the music listening stage, significant average reductions in alpha power were observed when compared to the pre-music stage, according to EEG recordings: 12.4 ± 16.2% in F3-C3 (p < 0.001), 13.4 ± 18.7% in F4-C4 (p < 0.001) (Figure 1(a)), 8.1 ± 11.1% in C3-T3 (p < 0.001), 12.0 ± 11.1% in C4-T4 (p < 0.001) (Figure 1(b)), 14.6 ± 15.8% in T3-O1 (p < 0.001), 15.4 ± 16.8% in T4-O2 (p < 0.001) (Figure 2(a)) and 14.6 ± 15.1% in O1-C3 (p < 0.001) and 15.5 ± 16.7% in O2-C4 (p < 0.001) (Figure 2(b)). In addition, significant average reductions in alpha power were observed during the post-music stage when compared with the pre-music stage: 12.1 ± 22.5% in T3-O1 (p = 0.009), 12.3 ± 22.1% in T4-O2 (p = 0.007), 12.7 ± 22.1% in O1-C3 (p = 0.006) and 12.3 ± 22.1% in O2-C4 (p = 0.007) (Figure 2(a) and (b)). However, no significant average changes in alpha power were observed during the post-music stage when compared with the pre-music stage for F3-C3, F4-C4, C3-T3 and C4-T4.
EEG alpha power during and after listening to Mozart K.448. Comparisons made with pre-music EEG. Percentage decreases in alpha power over F3-C3, F4-C4 (a) and C3-T3, C4-T4 (b) observed in subjects during Mozart K.448 (n = 29) and after listening to Mozart K.448. **p < 0.001. EEG alpha power during and after listening to Mozart K.448. Comparisons made with pre-music EEG. Percentages of the decreases in alpha power over T3-O1, T4-O2 (a) and O1-C3, O2-C4 (b) observed in subjects during Mozart K.448 (n = 29) and after listening to Mozart K.448. **p < 0.001, *p < 0.01.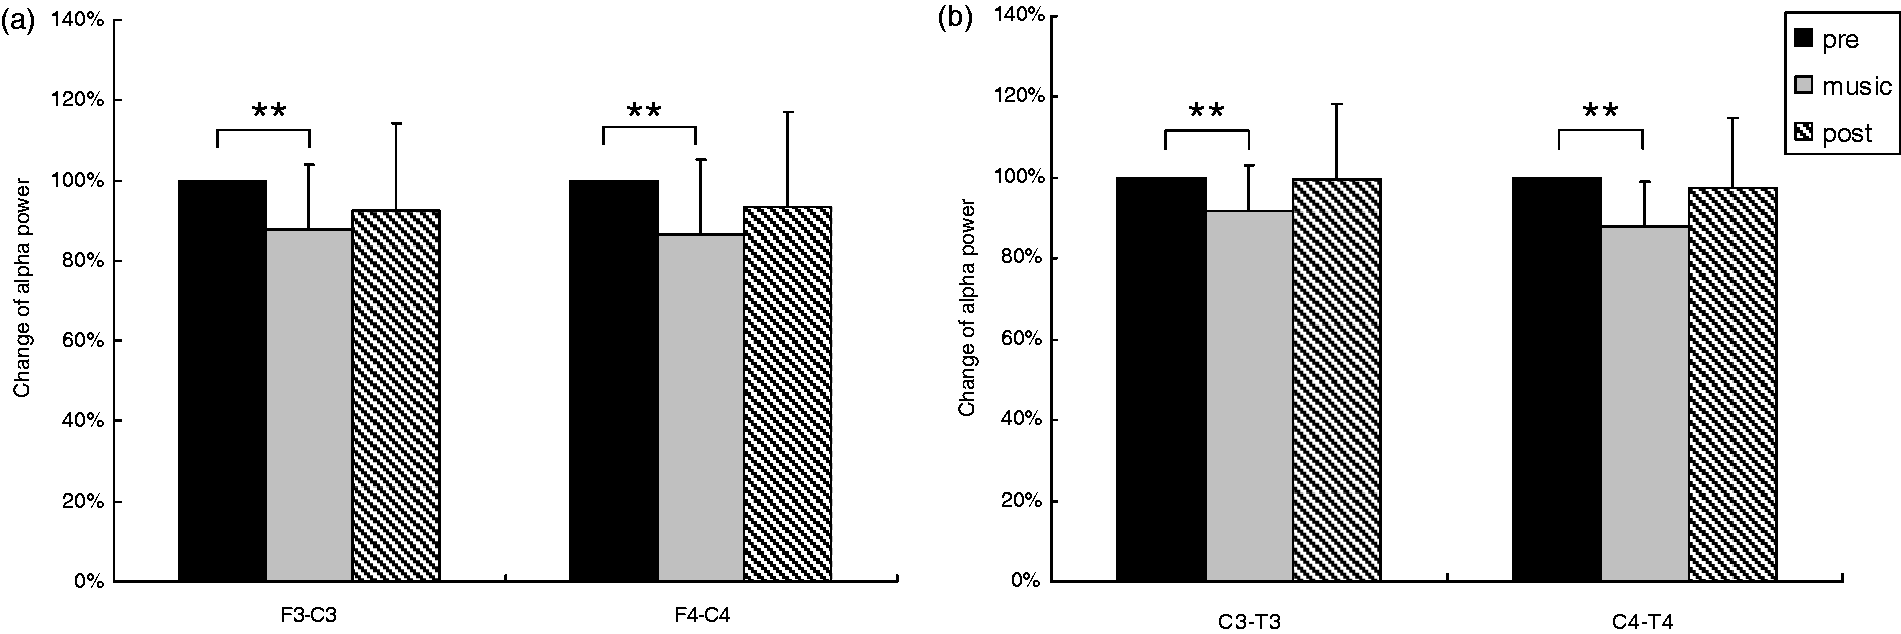
Similarly, significant average decreases in theta power were observed during the music listening stage when compared to the pre-music stage: 5.5 ± 11.5% in C3-T3 (p = 0.015), 5.6 ± 12.1% in C4-T4 (p = 0.019) (Figure 3(a)), 10.0 ± 15.6% in T3-O1 (p = 0.002), 12.3 ± 16.1% in T4-O2 (p < 0.001) (Figure 3(b)) and 10.6 ± 15.1% in O1-C3 (p < 0.001), 11.2 ± 15.5% in O2-C4 (p < 0.001) (Figure 3(c)). In addition, significant reductions in theta power were observed during the post-music stage when compared with the pre-music stage: 7.9 ± 19.7% in T3-O1 (p = 0.041) and 8.3 ± 19.9% in O1-C3 (p = 0.032) (Figure 3(b) and (c)).
EEG theta power during and after listening to Mozart K.448. Comparisons made with pre-music EEG. Percentage decreases in theta power over C3-T3, C4-T4 (a), T3-O1, T4-O2 (b) and O1-C3, O2-C4 (c) observed in subjects during Mozart K.448 (n = 29) and after listening to Mozart K.448. **p < 0.001, *p < 0.01.
Regarding EEG beta waves, there were significant average reductions in beta power during the music listening stage when compared with the pre-music stage: 8.8 ± 12.3% in T4-O2 (p < 0.001) (Figure 4(a)), 6.8 ± 12.2% in O1-C3 (p = 0.006) and 8.1 ± 11.6% in O2-C4 (p < 0.001) (Figure 4(b)). In addition, significant average reductions in beta power were observed in the post-music stage when compared to the pre-music stage: 9.8 ± 22.3% in T3-O1 (p = 0.025) (Figure 4(a)), 10.3 ± 20.7% in O1-C3 (p = 0.012) and 10.5 ± 21.1% in O2-C4 (p = 0.012) (Figure 4(b)).
EEG beta power during and after listening to Mozart K.448. Comparisons made with pre-music EEG. Percentage decreases in beta power over T3-O1, T4-O2 (a) and O1-C3, O2-C4 (b) observed in subjects during Mozart K.448 (n = 29) and after listening to Mozart K.448. **p < 0.001, *p < 0.01.
Change of HRV during and after music exposure
Change of HRV parameters when listening to Mozart K.448.
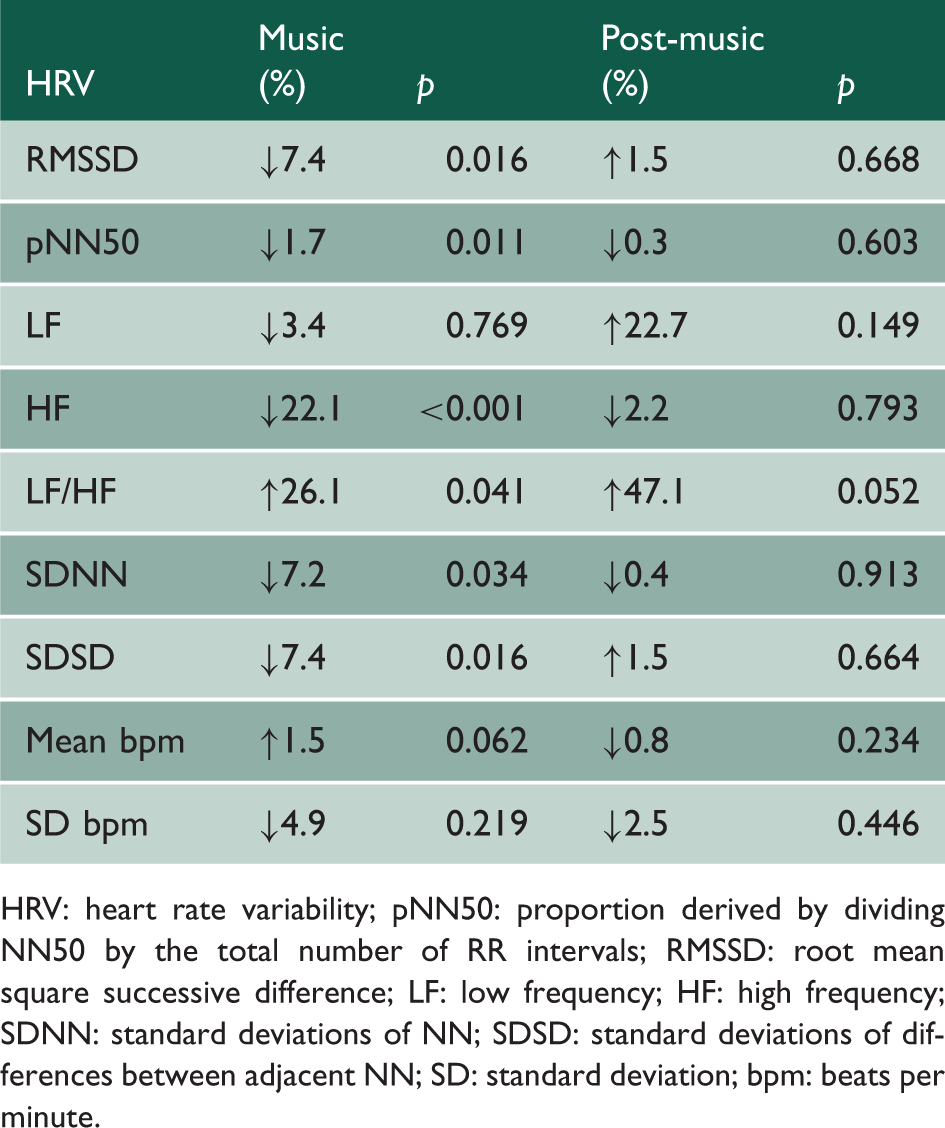
HRV: heart rate variability; pNN50: proportion derived by dividing NN50 by the total number of RR intervals; RMSSD: root mean square successive difference; LF: low frequency; HF: high frequency; SDNN: standard deviations of NN; SDSD: standard deviations of differences between adjacent NN; SD: standard deviation; bpm: beats per minute.
Discussion
Music has been shown to affect brain cortical function. Rauscher et al. 2 first reported the “Mozart Effect” in 1993. They note that Stanford-Binet spatial task scores improved immediately after listening to Mozart K.448 for 10 min, when compared to the same time of silence or relaxation instruction. Rauscher suggested that cognitive processing was improved by listening to Mozart’s music. Although Rauscher et al. 12 provided the Trion model of cortical organisation as a possible explanation for the beneficial influence of music, the mechanism of Mozart Effect remains unclear. The beneficial effect of specific musical pieces on human behaviour was usually explained as a consequence of their impact on positive mood and arousal. 13 In this current study, we found that listening to Mozart K.448 significantly reduced the EEG oscillatory power and is associated with an increase in sympathetic tone in healthy adults. The data provide scientific evidence that music has an effect on cortical functions and a possible explanation of Mozart Effect.
HRV is known to provide unique clues with regards to autonomic regulation. 9 The HF component is known to indicate parasympathetic activity and an increase of LF/HF ratio is considered to reflect sympathetic activity. 9 Although the relationship between music and autonomic function has been reported in some studies, the results and conclusion have generally been inconsistent. Orini et al. 14 report that the HF modulation was higher while listening to pleasant music, and the power of HF modulation was lower while listening to unpleasant stimuli. In another study, Chuang et al. 15 report that the HF power and normalised HF power were significantly higher and the LF/HF ratio and normalised LF power of HRV were significantly lower with increased relaxation sensation in cancer patients after music therapy. These results suggest that parasympathetic activity increased and sympathetic activity decreased. Still another study reports that music therapy induced no change in heart rate and blood pressure. 16 Our current study demonstrated a significant decrease in HF, an increase in LF/HF ratio and decreases in RMSSD, pNN50, SDNN and SDSD. It indicated sympathetic activation. Our study and previous studies of HRV responses to music showed inconsistent results; these inconsistencies might have resulted from differences in music selection and content.
A number of music and EEG studies report conflicting findings (decreases, increases and null responses in the alpha band when listening to music). 17 Schaefer et al. 18 report that music perception increased alpha band activity in the EEG. The increased alpha activity may be related to music processing. 18 Another study showed that listening to Beethoven’s 5th symphony decreases alpha power over the right frontal cortex which may be related to high arousal. 19 Ma et al. 20 describe a significant decrease in alpha power during four different musical tempi with the same melody. Furthermore, a larger tempo transformation gives rise to a greater change in alpha power than a smaller tempo transformation. The reduction of alpha power affects participants’ arousal level.
In the research from the past two decades, alpha power is regarded as a sensitive indicator of cortical activity and is inversely related to cortical function. 21 Low alpha power is reported to be associated with activations in cortical structures that orchestrate goal-directed cognition and behaviour in simultaneous EEG and functional magnetic resonance imaging (fMRI) studies. 22 They mention that when alpha power decreases, the BOLD fMRI signal increases in the frontal and parietal cortex that are involved in attention and related cognitive processes. 23 In our study, listening to Mozart K.448 reduced alpha power which may indicate cortical activation and provides supportive evidence of the Mozart Effect.
Several studies demonstrate that the EEG is sensitive to fluctuations in vigilance and is shown to predict performance degradation due to sustained mental work.24,25 Associations between decreased human alertness, reduction in vigilance and fatigue generate precise signs in the EEG, especially in alpha and theta waves. 26 A decrease in vigilance and deterioration in performance are associated with increased EEG power spectra in the theta band. 27 In the current study, significant reductions in theta power were observed during the music listening stage. These results suggest that listening to Mozart K.448 increased vigilance and cognitive function.
Regarding the beta band, Mancini et al. 28 demonstrate that an EEG beta power decrease is induced by noxious thermal stimulation. These results suggest that a decrease in oscillatory power indicates an increase in sensory cortical activation. As in the alpha and theta bands, reductions of beta power in our current study may represent increased cortical functions.
Correlations between cortical function and HRV are reported in many studies. Sakai et al. 29 report that changes in HRV HF (index of parasympathetic activity) were positively correlated with changes in alpha power, while changes in LF and LF/HF of HRV were negatively correlated with alpha power in an acupuncture study. In another study, patients with panic disorders show a reduction in alpha power and lower mean RR interval and higher LF/HF ratio when compared with healthy controls. 30 In our current study, there was a significant decrease in alpha, theta and beta power and a significant concomitant decrease in HF and increase LF/HF ratio. These results suggest that autonomic changes induced by Mozart music stimuli might be mediated through the central nervous system.
Conclusions
Listening to Mozart K.448 significantly decreased EEG alpha, theta and beta power and HRV. This study indicates brain cortical function and sympathetic tone activation in healthy adults when they listened to Mozart K.448. The results provide a possible explanation of Mozart Effect.