
Abstract
During COVID-19, countless dashboards served as the central media for people to learn critical information about the pandemic. Varied actors, including news organizations, government agencies, universities, and nongovernmental organizations, created and maintained these dashboards, through the onerous labor of collecting, categorizing, and circulating COVID data. This study uncovers different forms of labor and data practices—the work of “COVID data builders”—behind the construction of these dashboards based on in-depth interviews with volunteers and practitioners across the United States and India who participated in COVID dashboard projects. Specifically, we examine projects focused on marginalized and missing COVID data that aimed to show the pandemic's disproportionate and unjust impact. Through an investigation of data builders’ encounters and experiences with missing COVID data in mediating the pandemic, we ask: What data problems did COVID data builders encounter? How did they produce missing COVID data while questioning its representational capacity? And lastly, what “alternative epistemologies of data” beyond representation do their data practices suggest? Through our analysis, we surfaced three types of epistemological ambiguities COVID data builders encountered within their datasets: disappearing and ephemeral data, obscuring data, and disregarded data. By highlighting these different epistemological dimensions of missing data, we conclude that focusing on the performative and infrastructural aspects of what makes datasets “work” builds a new vocabulary for addressing missing data beyond representation. We argue that the politics of counting COVID cases is grounded in the material and affective labor of confronting, navigating, and negotiating with data's epistemological ambiguities.
Introduction
During the COVID-19 pandemic, countless dashboards served as the central media for people to learn critical information about the unfolding crisis. Varied actors, including news organizations, government agencies, universities, and nongovernmental organizations (NGOs), created and maintained these dashboards, through the onerous labor of collecting, categorizing, and circulating COVID data. This study uncovers different forms of labor and data practices—the work of “COVID data builders”—behind the construction of these dashboards based on in-depth interviews with volunteers and practitioners across the United States and India who participated in COVID dashboard projects. The work of these COVID data builders can be understood as data labor in the interest of “data activism” (e.g., Currie and Paris, 2018; Lehtiniemi and Ruckenstein, 2019; Milan and Van der Velden, 2016; Thompson, 2020) where COVID dashboard projects serve as “data intermediaries” (Baack, 2015) between states and publics. While data activism has gained significant interest in academic literature, the mundanities of data management and infrastructural maintenance have often been overlooked (Currie et al., 2018). This study examines both the material and affective labor of COVID data builders, who grappled with the epistemological challenges of working with the always imperfect data of the pandemic.
Particularly, we focus on marginalized and missing COVID data in projects that aim to show the pandemic's unjust impact. Our study includes projects tracking COVID cases in prisons and long-term care facilities, COVID and racial inequity, deaths due to COVID policy enforcement, as well as racism and racially motivated violence during COVID. These data were often unattended, hidden, or even absent from the datasets from state and federal institutions. The COVID data builders we interviewed employed laborious data practices that were sometimes creative, sometimes mundane, to not merely collect but to produce these “missing data” (D’Ignazio and Klein, 2020; D’Ignazio, 2024; Ọnụọha, 2016). In this process of data production, dashboard builders problematized the state's hegemonic ways of quantifying death and illness, while grappling with the questions of how certain data is collected, who or what is missing from the dataset, and how these “data voids” (Golebiewski and boyd, 2019) shape and manipulate our understanding of the pandemic. Connecting feminist and decolonial literature on “missing data” with that of data activism, we treat these COVID missing data not as an error or an outlier, but as a systematic production of ignorance perpetuated by state and federal institutions upon marginalized populations.
Through an investigation of data builders’ encounters and experiences with missing COVID data in mediating the pandemic, this article specifically addresses the following questions: What data problems did COVID data builders encounter? How did they produce missing COVID data while questioning its representational capacity? And lastly, what “alternative epistemologies of data” (Milan and Van der Velden, 2016; Muravyov, 2022) beyond representation do COVID data builders’ practices suggest? Critical data scholars have extensively problematized the understanding of data as a representational resource—the belief that data is a powerful tool for knowing and reflecting the world (Crooks, 2017; Crooks and Currie, 2021; D’Ignazio and Klein, 2020; Gray, 2018; Gray et al., 2018). Crooks, for example, characterizes this ideology as “representationalism,” which regards data as “mimetic representations of some external reality from which they are ontologically distinct” (2017: 1). Instead, these scholars emphasize the performative characteristics of data, or how data do things, and how they even become infrastructural as they “render the world in accordance with different visions, values, and cultures, making it navigable through data” (Gray et al., 2018: 3). Scholarship in data activism especially welcomes and contributes to these critiques against positivist and representational understanding of data. In critiquing representationalism, this body of literature explores diverse ways data activists make alternative epistemological claims through data rather than attempting to capture the “accurate reality” (Crooks and Currie, 2021; Milan and Van Der Velden, 2016; Muravyov, 2022).
However, we argue that the language used to discuss the politics of missing data is still heavily influenced by the promise of accurate representation (Van Dijck, 2014). The idea that data is incomplete, partial, invisible, undercounted, and silenced—terms frequently associated with missing data and sometimes even carrying ableist connotations—implicitly suggests data can achieve a state of wholeness, entirety, and completeness if collected properly. The discourse surrounding missing data often points to a broader representational desire, even a yearning, for complete and exhaustive datasets that could portray the reality of the pandemic. Yet, this desire falls short in capturing both performative and infrastructural aspects of data and what it purportedly represents (Barad, 2007: 46). This issue came to the fore as we examined COVID data problems identified and dealt with by our interviewees.
COVID data builders expressed conflicting values of data positivism—that data is crucial for them to show the discriminatory realities of the pandemic and to conduct evidence-based research and advocacy work—but also acknowledged they would never know the entire picture of the pandemic with data. They repeatedly emphasized how the collected data was always-already incomplete and in partial perspective; the numerous data sources they relied upon were often untrustworthy and precarious; and practices of counting pandemic data, including their own, were often ad hoc and linked to temporary projects that could not generate consistent historical data. This ambivalent attitude toward the certainty and completeness of data shows on the one hand, when COVID data builders internalized the belief that data stands as a proxy for reality, they felt constantly under pressure to make their datasets “complete,” which then led to feelings of powerlessness and discouragement. On the other hand, they used missing COVID data as an opportunity to explore the conditions that led their data to become missing and “listen around the void” (Mattern, 2021). In other words, they suggest how the work of collecting missing data, paradoxically, could unveil diverse forms of epistemological injustices that representing COVID through data could entail.
Through an investigation of COVID data builders and their strategies, we propose different approaches for understanding missing data that move beyond representationalism and better engage with its epistemological complexities. As described by Muravyov, rather than understanding data activism as a tool for representing social issues, the “epistemological ambiguity of data provides space for exploring more nuanced relationships between data and the knowledge it offers about the world, which is born out of data activists’ epistemic cultures” (2022: 9). Specifically, we showcase the work of COVID data builders in addressing three types of epistemological ambiguities they encountered within their datasets: disappearing and ephemeral data, obscuring data, and disregarded data. First, disappearing and ephemeral data refers to data collected but only available for a short period or that is revised and/or deleted without explanation. Second, obscuring data explains how data became meaningless to the builders because what they perceived as significantly distinct data were merged together, or because the definitions of data categories kept changing among different collectors. These data are obscuring, instead of obscured, because they “shape” rather than merely “mask” how inequality unfolds during the pandemic. And lastly, disregarded data refers to data that was deliberately overlooked or refused to be collected by state and federal institutions because it was not accepted as “COVID data.” Each of these data challenges required different workarounds, ranging from making redacted information visible to collecting external data for comparison to creating notes or metadata to make the limitations of their datasets transparent. By highlighting the different epistemological dimensions of missing data, we conclude that focusing on the performative and infrastructural aspects of what makes datasets “work” builds a new vocabulary for addressing missing data beyond representationalism.
This paper first situates our theoretical argument in the literature about the politics of counting, with a focus on the problem of missing data. After that, we examine missing data in the context of COVID-19 and how COVID dashboards were created to make up for institutional gaps in COVID data collection. In the following section, we introduce the notion of “epistemological ambiguities of data” (Muravyov, 2022) for data activists, which regard data as inherently reductionist and riddled with the logic of power, yet politically useful. Following a brief explanation of our methods, we lastly present three types of data problems that surfaced from our analysis, providing vocabularies for describing the epistemological complexities of missing data beyond representation. We conclude that the politics of counting is grounded in the material and affective labor of confronting, navigating, and negotiating with epistemological ambiguities.
The problems and politics of missing data
In this section, we review existing conversations on the politics of quantification to explain how missing data is both a product and a cause of epistemic injustice. The use of counting and quantification as a tool for population control and governance has been extensively studied by scholars in science and technology studies, information sciences, and critical data studies. This multidisciplinary scholarship illustrates how statistics and quantification practices are perceived as objective, rational, and impartial tools for understanding populations and have become techniques of governance (Porter, 1995; Van Dijck, 2014). For instance, in his foundational work, Seeing Like a State, political scientist James C. Scott (1998) illustrates how the emergence of modern states relied on techniques of simplification and abstraction to make complex human phenomena legible for large-scale social engineering projects. In other words, states “see” 1 their societies in particular ways that fit their administrative categories, which inevitably reduce and essentialize the complexities of local realities (Chaudhuri, 2021; Finn et al., 2014; Scott, 1998). Furthermore, tools and technologies used to quantify human lives have historically been entangled with imperial and patriarchal paradigms (Wernimont, 2018). Recent theorizations that connect dataism (Van Dijck, 2014) to the unequal power dynamics of the contemporary global economy use terms such as “technocolonialism” (Madianou, 2019) and “data colonialism” (Couldry and Mejias, 2019; Thatcher et al., 2016) to describe how datafication parallels the exploitative and extractive rationalities of past colonial practices. Old and new quantification practices render diverse aspects of human lives, including life and death, commodifiable for state and corporate actors.
Such processes of abstraction in state governance raise the question of who is represented in the state's data infrastructures and who is left out. Ranjit Singh (2020), examining India's biometrics-based national identification system, Aadhaar, shows how building and maintaining such data infrastructures create different forms of “data-driven marginality,” particularly when citizens’ lived experiences misalign with their data records. Expanding on Star and Bowker's (2007) concept of “residual categories”—categories that do not neatly fit into a given classification system and therefore fail to be formally represented—Singh traces how those under the liminal experiences of residuality become “orphans of infrastructure.” Orphaning unfolds over time as bureaucracies register, circulate, and interpret citizens’ records, while at the same time, citizens use these data infrastructures to represent themselves. This mutual shaping of data infrastructures and orphaning generates precarious forms of citizenship that heavily depend on decontextualized data points (Singh, 2020).
The idea of “orphaned” datasets resonates with rich feminist scholarship that examines systematic biases and institutional neglect that exclude certain populations and activities from state records. One of the notorious fields where undercounting has been perpetuated is women's labor in the economic and domestic sphere. Feminist scholars refer to these gaps as “data voids” resulting from the systematic marginalization and suppression of women's lives (Perez, 2019; Seager, 2018). Active production of absence occurs in gender-based violence and colonial relations (Carlson, 2021; D’Ignazio, 2024; Ọnụọha, 2016; Tuana, 2006). For example, Carlson (2021) uses the term “data silences” to describe the productive and systematic undercount of ongoing gendered and racialized violence against Indigenous bodies in settler archives. It is a “willful ignorance,” as described by Nancy Tuana (2006), that purposefully neglects the oppression of others, infects those in positions of privilege, and deceives oneself from their role in that exploitation.
Instead of being a technological glitch, a mistake, or a flaw, “missing data” is rather a betrayal of systematic ignorance and exclusion. As a result, critical attention to missing data in today's datafied world allows us to expose the sociocultural value systems of our societies: whose lives are deemed worthier than others? What is considered countable and profitable, and thus better accounted for? Pushing further, Mimi Ọnụọha (2016) asserts the political potentialities of missing data by reimagining “missing-ness” as a condition of possibility: the word ‘missing’ is ‘inherently normative’: it implies both a lack and an ought: something does not exist, but it should. That which should be somewhere is not in its expected place; an established system is disrupted by distinct absence. (Ọnụọha, 2016)
Missing data during COVID-19
During the COVID-19 pandemic, there was both an overabundance and a dearth of critical data. The global scope and scale of the virus resulted in a deluge of data. However, the limitations of data collection, quality control, and standardization resulted in some data being uncollectible, inaccessible, or unreliable. Milan and Treré (2020) discuss the implications of the COVID data divide. “Data poverty” in marginalized communities and low-income countries hindered evidence-based policymaking and demands for government accountability (Milan and Treré, 2020). Furthermore, it risked universalizing medical and social issues related to COVID by basing COVID research and interventions on data primarily drawn from “data-rich” populations (Milan and Treré, 2021). The divide in COVID data largely stemmed from inequity in data infrastructures across different communities and populations. Marisa Duarte (2020) examined COVID data problems in Indigenous territories in the Americas and called this a “ruptured knowledge ecology” in a state of epistemic injustice. Lack of investment in Indigenous people's data infrastructures and capacities, as well as continued negative experiences with untrustworthy, exploitative research and policy practices contributed to a lack of COVID tracking in Native territories (Carroll et al., 2020, 2021; Duarte, 2020).
Many grassroots COVID dashboards were built by non-state actors in the first and second years of the pandemic to address COVID data problems on their own terms. While these dashboard projects had different goals and missions, as well as different infrastructures to achieve them, this paper specifically examines dashboards focused on marginalized COVID data. For instance, The Marshall Project—a nonprofit, online journalism organization reporting on issues related to criminal justice in the United States—tracked COVID numbers in state and federal prison systems beginning in March 2020. As the pandemic broke out, they understood that states would not likely create a good nationwide authoritative source of COVID data on incarcerated people. In another example, the Non-Virus Death Database, built by a group of academics and public interest technologists in India, documented the number of deaths caused by the Indian government's sudden enforcement of national lockdowns. Although many people died from starvation, medical neglect, suicide, and travel accidents while complying with the lockdowns, the Indian state refused to acknowledge these deaths saying they were unrelated to the coronavirus.
Acknowledging the various data challenges that arose during the COVID-19 pandemic as described above, critical scholars have problematized the uncritical circulation of decontextualized COVID data and its promise to represent the realities of the pandemic (Campolo, 2020). Rather, they emphasize the need to look “behind or under” COVID data visualizations to understand how the pandemic “plays out differently across different scales” (Bowe et al., 2020). Scholars also advocate for more inclusive and humane data collection that accounts for care, not only deaths (Soden et al., 2022). Particularly, Shannon Mattern (2021) offers alternative data practices that can recover the potentialities of data beyond representation. Speaking about various COVID dashboards and mapping projects that engaged with marginalized or omitted COVID data, she suggests constructing narratives that official data sources overlook or neglect: “maps can produce worlds instead of simply reflecting them … Scientists couldn’t look directly at nothing to see something: they have to look and listen around the void, deploying techniques similar to compositing and echolocation” (Mattern, 2021). In other words, attending to missing data can serve as a means to study the sociopolitical conditions that produce the “nothing” that Mattern refers to. In the following section, we engage with data activism literature that further examines this relationship between data and knowledge beyond representationalism.
The dilemmas of data for justice
If it is reductive to think of data as a representation of reality, and if the knowledge it produces about the world is always imbued with power (D’Ignazio and Klein, 2020), what kind of relationship exists between data and knowledge beyond representation? Scholars in critical data studies and science and technology studies have long argued that we should view data as performative and infrastructural, rather than representational. These works examine how data and data infrastructures shape and structure our ways of life, create new subjectivities, as well as stabilize new knowledge-making practices (Cheney-Lippold, 2017; Gray, 2018; Gray et al., 2018; Matzner, 2016). For instance, within the field of data activism, data has become the dominant means to raise social issues and make political demands, which has sometimes placed additional burdens on affected communities by making them responsible for collecting data themselves (Crooks, 2019; Crooks and Currie, 2021). Furthermore, data has been used to devalue other forms of evidence and redirect resources and attention away from taking action (D’Ignazio, 2024; Walklate et al., 2020). Thus, rather than being a tool to capture and depict an external reality, data shapes the “articulation of collective life,” as Jonathan Gray describes (2018: 5): “Things become [un]sayable, [un]knowable, [un]intelligible, and [un]experienceable through data … it provides the conditions of possibility for our experience” (2018: 6).
In this context, data activists face a dilemma. When activists use data in their advocacy work, they run the risk of legitimizing data as a proxy for reality and accepting the knowledge it produces at face value rather than critically reading it. Recent scholarship in data activism deeply engages with this tension and proposes different frameworks for understanding activists’ data practices. For example, Crooks and Currie (2021) introduce the term, “agonistic data practices.” Instead of treating data as an unquestionable source of evidence for consensus-building and dialogue between the state and affected communities, agonistic data practices “mobilize antagonisms that produce solidarity among their community” (2021: 7). In other words, agonistic data practices focus on data's affective and narrative potentialities. Meanwhile, Muravyov (2022) examines how activists critically engage with the knowledge claims produced by data by constantly questioning the “epistemological ambiguities of data.” Through an examination of data activists in Russia working with contested government data on traffic accidents, Muravyov (2022) illustrates how activists simultaneously utilize the official dataset to make claims about urban infrastructural issues while doubting its credibility. Activists carry these tensions within their projects, considering ambiguity as a constitutive trait of their work.
However, while Crooks and Currie (2021) and Muravyov (2022) introduce concepts to move analysis beyond data-as-representation, the language commonly used in both public and academic discourse to address missing data and its epistemological issues still heavily revolves around the notion of “exhaustive data” and its promise to accurately represent reality. For instance, data problems during COVID-19 have often been described as “incomplete,” “invisible,” “partial,” “uncollected,” and “absent,” thereby characterizing them in relation to exhaustivity and circumscribing various dimensions of data problems to a mere “lack of.” Through this inquiry, we aim to develop more effective terminologies that capture the epistemological challenges of COVID-19 data while accounting for its performative and infrastructural characteristics.
Method
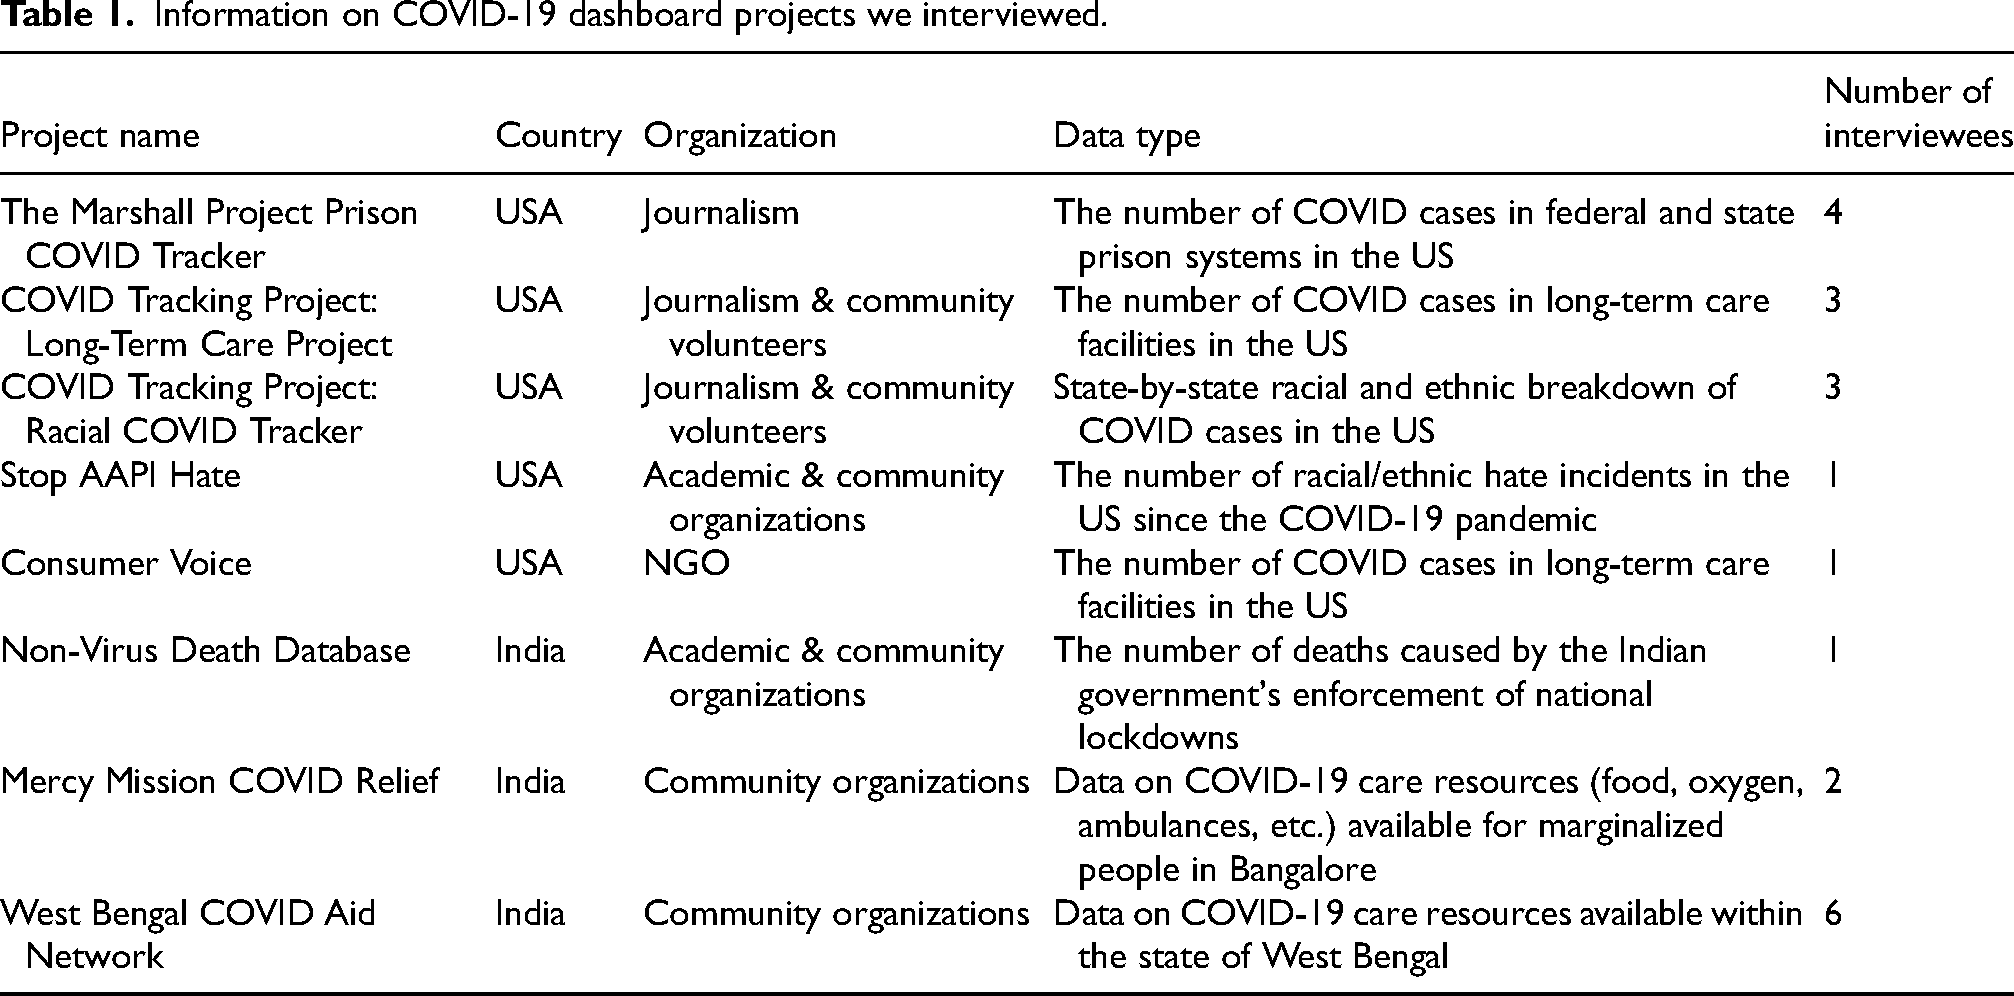
This article draws on interviews conducted from March to November 2021 for a larger project that investigates COVID dashboard projects in the United States and India. To understand COVID data builders’ experiences and challenges in building these critical data infrastructures, we conducted 79 semi-structured, in-depth interviews with COVID data builders across 17 dashboard projects created by academics, journalists, and community organizations. For this article, we selected a subset of 8 projects (and 21 interviews) that specifically focused on the impact of COVID-19 amongst people who were marginalized in their societal contexts—elderly people living in long-term care facilities, racial and ethnic minorities, prison populations, and migrant workers—for the purpose of showing the pandemic's discriminatory impact. Dashboard projects in the United States and India were selected because these two countries experienced the highest number of COVID cases in the first year of the pandemic, and because their large Information Technology workforces and their “Data for Social Good” rhetoric made them relevant geographies to examine digital, technology-based data trackers for public consumption. Moreover, in both countries, states have significant power over local governance. India and the United States faced similar challenges in establishing unified and coordinated mechanisms to track nationwide COVID data. The goal of this article is not to make a comparative analysis between India and the United States but to investigate specific data problems our interviewees encountered when building data infrastructures that focused on marginalized COVID data.
Table 1 shows the dashboard projects and interviews analyzed for this article. Interview questions were related to project evolution, organizational structure and culture of the project, communities of practice, descriptions of day-to-day data work, and challenges in working with COVID data. Each interview took between one to two hours and was conducted over Zoom, and interviewees were compensated for their time.
Information on COVID-19 dashboard projects we interviewed.
The next section introduces three types of epistemological ambiguities that we identified in our analysis: (a) disappearing and ephemeral data; (b) obscuring data; and (c) disregarded data. We illustrate these data issues through the perspective of one or two projects that particularly exemplify the sorts of hurdles and solutions data builders devised to confront each type of epistemological ambiguity. Despite our focus on one or two projects for narrative clarity, subsequent data challenges were consistently encountered across various dashboard projects that were part of this study.
The landscape of COVID data work and the development of alternative epistemologies
Disappearing and ephemeral data
The first type of data problem COVID data builders often encountered was disappearing and ephemeral data. In this section, we will explore builders’ experiences of dealing with the precarious temporality of data through The Marshall Project's Prison COVID Tracker and discuss the implications for knowledge claims derived from this unstable data.
A senior editor and the head of The Marshall Project's Prison COVID Tracker told us about how he noticed disappearing COVID data. This was an unanticipated problem. Based on their experience with the US criminal justice system, reporters of The Marshall Project anticipated that it would be difficult to obtain comprehensive COVID data about imprisoned people and people working at prisons. Acknowledging these people are at a higher risk of COVID exposure, the Prison COVID Tracker's initial goal was to quantify and contextualize the stories that reporters heard about COVID situations in carceral settings. To build this reporting infrastructure, The Marshall Project formed a rotating team of 20–30 reporters who would manually call federal and state prisons every week and ask for their COVID data. A few weeks after the launch of the Prison COVID Tracker, federal and state prisons began to release rudimentary COVID web pages, which rarely had all the information the reporters were looking for. Reporters continued monitoring each federal and state dashboard and contacted Public Information Officers (PIOs) weekly to resolve outstanding questions about the official prison data.
The Marshall Project reporters understood that whatever data they obtained from federal and state prison system web pages and PIOs would likely be a severe undercount. For example, the reporters learned that testing was conducted inconsistently across prisons, leading to many cases going undiagnosed. The reporters attempted to clearly convey the inherent undercounted nature of their data to their audience by transparently disclosing their data collection processes and problems with the data on their website.
But in March 2021, a year into the pandemic, The Marshall Project team noticed something unexpected: an unexplainable change in the official COVID numbers in prisons. The Federal Bureau of Prisons was reporting fewer cases in cumulative numbers than what they had reported at the beginning of March 2021! Reporters immediately contacted the Federal Bureau of Prisons for an explanation, discovering that the agency started removing people who had been released from federal custody from their total numbers. Figure 1 shows a screenshot of the email response the reporters received from the Federal Bureau of Prisons about why the cumulative number of COVID cases was decreasing.

A screenshot of the email response from the Federal Bureau of Prisons obtained from The Marshall Project's official Twitter account.
The Federal Bureau of Prisons’ official dashboard never clearly mentioned when it began to only document the number of cases for those who are “currently” at prisons, as The Marshall Project senior editor explained: Because the numbers were rising so dramatically in December [2020], January [2021] into February [2021], the losses were being masked in the net gains. Once the spike from the winter started to settle down, only then we could see ‘oh this is weird, why are these numbers going down?’ You wouldn’t see it in the numbers because there were so many new cases happening, it was getting lost in there.
To capture such disappearing and ephemeral data, it was crucial for data builders to meticulously track and investigate any changes in state prisons’ COVID pages. The team utilized a tool called Klaxon, an open-source software developed by The Marshall Project that monitored webpages for change. Valuable for historical analysis, Klaxon would promptly notify the reporters whenever a modification occurred on state prison COVID pages. On one occasion, the team discovered that the Texas Justice System had deleted seven names from its list of individuals who died in prisons due to COVID-19. Reporters reached out to Texas prison PIOs to inquire about this suspicious removal of names, using Klaxon as evidence to advocate for the names to be returned. This data labor could be interpreted as a form of “reparative redaction,” which uncovers “the act of withholding, divulges the revision, and makes the act of secreting visible” (Mattern, 2023). In this context, data builders’ everyday work of monitoring dashboards for disappearing data and communicating with prison PIOs was more complex than simply aggregating COVID numbers from different sources. It was also a performative act and a political demand that urged prison systems to become transparent in their management of COVID behind bars.
Dashboards’ affordances lie in their ability to present both real-time and historical data, intended to help audiences in making informed decisions. However, the process of collating data from various sources simultaneously proved to be extremely challenging, if not impossible, due to the irregular temporalities of COVID data. Different sources released and deleted data at different times, as seen in the story of The Marshall Project, making the aggregation of different data streams exceptionally difficult. In navigating these challenges, data builders not only had to manage access with PIOs to retain continuity of the same data points but also had to leverage their expertise and discretion to address the potential loss of insight resulting from discontinuities in data pipelines. A similar issue arose with the non-linearity of data release, which shows an opposite scenario of disappearing data. Periodic updates of dashboards with a backlog of data would highlight a sudden spike in cases, often leading to controversies and panic. Data builders had to contend with these ambiguities within irregular data cycles, aligning fragmented time frames of COVID data to bring a sense of order and regularity. In this context, dashboard building constructs an epistemology of pandemic temporality. COVID dashboards are not just informative but an affective “emergency media” (Ellcessor, 2022) that embodies a promise of control and stability – a pastiche that reconstructs the temporal rhythms of what we come to know about the pandemic.
Obscuring data
Another type of missing data that we identified is obscuring data. Here, we show that the concept of missing data extends beyond the mere absence of data but also the data that hindered the public from understanding the unjust impact of the pandemic. In other words, these data are not simply obscured; rather, they are actively obscuring. We argue that obscuring data differs from “misrepresentation through data” in its potential to shape inequality rather than inaccurately capturing existing inequalities.
Obscuring data emerged in several instances, including when what data builders saw as significantly different data were lumped together. Data builders mentioned that the assumptions about what should be counted as separate data entities varied from state to state. They were acutely aware that justifying why certain data should be aggregated or disaggregated was deeply a political question, which echoes science and technology studies’ longstanding interest in the politics of statistical categories (Bowker and Star, 1999; Desrosières, 1998). How different states in the US reported COVID numbers in long-term care facilities demonstrates the political implications of lumped data.
The COVID Tracking Project's Long-Term Care (LTC) team began tracking COVID numbers in nursing homes and assisted living facilities from May 2020 to March 2021. As they closely monitored numbers reported by states, universities, and media, they sensed a lack of regard for the lives of those living in shared long-term care facilities. Interviewees explained that the various regulations, financial structures, and institutions involved in elderly care were not adequately considered in data frameworks for reporting COVID-19. Hermione (pseudonym), a volunteer with the COVID Tracking Project who had experience in a city public health department, elaborated: Long-term care in particular, there is so much nuance to what one state might call a skilled nursing facility versus some states just reported long-term care in general, they didn’t break down between assisted living and long-term care. Some include residential care facilities, some include addiction treatment facilities. So even though states might be using the same word to describe things, the definitions might be really different.
Another instance of lumped data in long-term care facilities involved merging COVID numbers of staff members with those of residents. For example, the state of Washington did not report separate data for residents and staff, providing only a single number that encapsulated both (Figure 2).

A screenshot of the COVID tracking project's assessment of long-term care data reported by the state of Washington. This page shows that for long-term care data, “serious issues exist,” including the state not breaking out staff and resident cases/deaths.
Remy (pseudonym), a data volunteer for the Long-Term Care team, explained the consequences of aggregating staff and resident data: We wanted to track staff because they are part of the story and they are nearly 40% of the cases that happened in long-term care facilities in total. But we saw that a lot of theories about how [COVID] was spreading [in care facilities] and a lot of that blame was put on to the staff. Which felt horribly unreasonable, cause if you are a facility, you have to train your staff, you have to provide them with these [protective equipment and other resources]. If you pay them a reasonable wage, they don’t have to work in two different facilities and thus spread [the virus] between the two. There are so many different ways to mitigate the issues that they blame the staff for … those staff positions are often occupied by women of color and it's a low wage.
Data builders’ attempt to disentangle aggregated data highlights a core mission of the many COVID dashboard projects we analyzed – making data consistent and comparable across institutions, whether between states, facilities, prisons, etc. The majority of dashboards, particularly those from the United States, were collecting data from different sources which lacked standardization in the definition and measurement of COVID data categories. To reconcile these different definitions and provide meaningful cross-state analyses, one strategy the Long-Term Care team employed was developing sophisticated data notes, where they meticulously explained the methods used to make data from one state commensurable with data from others. Another crucial step involved proactive outreach to state public health departments or to state PIOs. State officials helped COVID data builders resolve data discrepancies. COVID Tracking Project even created a system of scorecards that evaluated each state's COVID reporting practices, offering a means for states to compare their performance with one another.
This fixation on commensurability (Petre, 2021) reveals the complex dilemma faced by data builders in shaping their beliefs and relationships with COVID data. While acknowledging that the data they collect are always reductive and designed to serve bureaucratic efficiency, many dashboard projects still subscribed to a positivist rationale that data is indispensable for mitigating unjust impact of the pandemic. Espeland and Stevens (1998) examine the double-edged potential of commensuration in feminist labor movement: commensurating housework with other forms of labor elucidates gender asymmetries yet entails the risk of valuing domestic work and motherhood through a capitalist logic, which felt diminishing to many women. Similarly, the act of commensurating deaths and illnesses into numbers often felt cruel and disheartening for our interlocuters. Facing their own desensitization to these numbers were repeatedly mentioned as one of their biggest hurdles. Annie (pseudonym), a data volunteer for the COVID Tracking Project's racial COVID tracker, articulates how she struggled with reminding herself that the numbers she was working with were actual people: I think as much as we all are aware of what these numbers are and what they mean, there's a certain extent to which you might become desensitized to it, and just sort of being like, “Okay, it's Wednesday, I’m gonna go put on the spreadsheet and put on a playlist and copy some numbers”… but you have to think about, who are the people behind these numbers?
Disregarded data
The last type of data problem experienced by COVID data builders was disregarded data. This refers to data categories overlooked or neglected by the hegemonic practices of counting COVID cases and hence left out of the dominant epistemological paradigm of understanding the pandemic. This section introduces two dashboard projects, the Non-Virus Death Dashboard (NVD) and Stop APPI Hate, that challenged the conventional understanding of what should be counted as COVID data. By directly engaging with the limitations and uncertainties inherent in the data they collected, these dashboard projects departed from understanding data as a representational resource that reflects the “reality” of the pandemic. Instead, they treated data as a means for community building and political mobilization—focusing on data's potential to suggest alternative ways of knowing and living the pandemic—by directly engaging with and embracing the epistemological ambiguities of their dataset.
Rajesh (pseudonym) was one of the founders of the NVD project, which tracked the number of deaths in India resulting from the state's COVID enforcement measures in 2020. The sudden and coercive national lockdown resulted in a humanitarian crisis, leading to numerous deaths caused by financial distress, starvation, accidents, fear and loneliness, and medical neglect, predominantly affecting impoverished, underserved communities in India. The NVD project emerged as a direct response to the Indian government's denial of these deaths: “The unavailability of this data, however, was by design …. These people are not on their radar, their deaths do not matter and therefore do not need to be counted,” the team stated in one of their published articles (Aman et al., 2021). Rajesh explained that as a political statement and an archival project, documenting these deaths, which they collected from news media, press releases, and tweets, held significance beyond numbers. What spurred him to start this project was “to gauge the pain of people” that the Indian state refused to acknowledge and to “record these deaths so they don’t get lost.”
This motivation is deeply connected with how NVD grappled with sometimes uncertain and doubtful issues surrounding their data. One of the most challenging questions the team dealt with arose in the work of validating and categorizing deaths. According to Rajesh, some deaths were relatively straightforward to connect to COVID policy. For instance, many people died in road and train accidents while undertaking unsafe journeys home during the government's enforced lockdown. As an example, at least 96 people died on the “Shramik Special” trains, which the Indian Railways began operating in May 2020 to transport migrant workers and students who were stranded due to sudden lockdowns. These people lost their lives due to poor conditions on these trains, leading to hunger, exhaustion, dehydration, and medical complications. While cases like these were relatively easy to categorize as “non-virus but still COVID deaths,” others felt more challenging according to Rajesh. For instance, the team experienced internal conflict about whether deaths caused by alcohol withdrawal should be included in their dataset. Rajesh commented that there were different views on the extent to which these deaths could be counted as “COVID deaths” when other potential causes and interpretations were plausible. “But then we thought alcohol withdrawal is a medical condition that needs to be treated. On a regular day, it would or could have been treated, so we decided to include these numbers in our dataset,” explained Rajesh. “And in the end, we thought we should have it and leave it to people who want to use it and how they want to use it.”
NVD's process of counting and categorizing was less about using data to establish an epistemological certainty—in other words, getting things accurate—but more about opening up discussions with their audiences on what should be counted as COVID deaths. As Mattern (2015) describes, dashboards are intended to be “open platforms” that embody aspirations for civic engagement. The approach employed by our interlocuters in dealing with doubts and ambiguities within their datasets mirrors this ideology. They prioritized interactive audience engagement where definitions of what should be counted as COVID deaths was subject to public reevaluation. Dashboards evolved into civic forums where previously taken-for-granted categories are unsettled and problematized, presenting opportunities for political participation.
The Stop AAPI Hate project documented hate incidents against Asian and Pacific Islanders (AAPI) communities in the United States since the beginning of the pandemic and evinced similar attitudes toward ambiguities surrounding data collection. This project was conceived in response to the then-California Attorney General Xavier Becerra's refusal to document the number of hate incidents that soared due to COVID-related xenophobia, racial hatred, and stigmatization (Namkung, 2021). AAPI people experienced hate crimes such as assault, murder, and vandalism in addition to being refused services, shunned and coughed at. Kevin (pseudonym), one of the founders of STOP AAPI Hate, spoke with us about the definitional ambiguities in classifying whether a reported incident is racially motivated or not: It's clear ours is self-reported data. So it's the respondent's perception of what happened, not necessarily fully validated as ‘yeah, it was clearly racially biased.’ You don’t really know why someone's avoiding you, for instance. But that [validating whether it's racially motivated or not] wasn’t our intent. It wasn’t to validate actual claims of racism or to gather self-reported perceptions of racism. And that's a big distinction that we’re getting, [we’re collecting] Asian American's own perceptions of racism, not necessarily [those that fit into] legal standards of hate crimes or even hate incidents. So there is a lot of ambiguity, how do you know someone was, again, shunning you because of race?
Kevin highlighted how their methods of data collection are inherently different from those of law enforcement, whose goal lies in punishment and individual redress. Rather, the project adopted a systematic perspective, recognizing that racial hatred is deeply rooted in structural problems rather than blaming individual perpetrators. Consequently, their approach to data collection diverges significantly from that of law enforcement, which contributes to the carceral state (Kuo and Bui, 2021); the team did not track perpetrator data, and the validation of individual reports was considered less crucial. Rather than top-down validation of what counts as racial incident or not, Stop AAPI Hate prioritized community participation and amplification of their voices. In other words, the project embraced the ambiguities of their data and purposefully leveraged them for political mobilization and community repair. For our interlocutors, COVID dashboards were tools of accountability, not only addressing current regimes of power but also recounting underrecognized stories of the pandemic.
Conclusion
We return to the questions that started our paper: What data problems did COVID data builders encounter? How did they collect and maintain missing COVID data while questioning the data's representational capacity? Through in-depth interviews with dashboard builders that worked with marginalized COVID data, we surfaced three types of epistemological ambiguities that our interviewees identified: (a) disappearing and ephemeral data, (b) obscuring data, and (c) disregarded data. Instead of being simply incomplete or uncollected, these challenges arose because the data they sought was precarious, inconsistent, untrustworthy, or served different purposes than what the builders expected. By illustrating how data builders engaged with these ambiguous qualities of their datasets, we show how they developed alternative epistemologies of data for the pursuit of social justice.
Our analysis reveals that taking care of marginalized COVID data was grounded in the material and affective labor of identifying, interrogating, and reconciling epistemological ambiguities. COVID data builders employed various technical and affective approaches to address different types of uncertainties surrounding their datasets and to navigate the tension between using data as a representation of reality and dismissing it for its troubling politics. The three data problems that we discuss here—disappearing, obscuring, and disregarded data—provide more nuanced vocabularies for us to discuss the performative and infrastructural dimensions of missing data based on the words of our interlocutors. In the case of disappearing and ephemeral data, COVID data was “getting lost” while these removals were becoming “masked.” Obscuring data showed that data's “nuance” meant understanding that distinct data attributes might be lumped together to conceal certain narratives of the pandemic. It also referred to noticing that different data collectors might be using the “same category to describe things” when the “definitions might be really different.” While these technical data problems might seem anodyne on the surface, the affective experience of data builders was intense because their data practices were meant to “remember these are real people behind numbers.” Meanwhile, some data was even “unavailable … by design,” as federal and state institutions disregarded it from being counted. These terminologies that builders used reflect how they framed COVID data problems. Data builders’ focus on the performative and infrastructural aspects of COVID data creates a new constellation of grounded approaches to data's epistemological challenges beyond representation.
The COVID data projects that we examined generated dashboards of different types, including charts, graphs, and heatmaps. These dashboards served as what Elizabeth Ellcessor referred to as emergency media—“media technologies to which someone might turn when faced with extreme circumstances, through which people understand and take action” (2022: 3). As both informative and affective media and information infrastructure, dashboards embody a variety of ideologies (Mattern, 2015). In our analysis, we specifically discuss three ideologies of dashboards that directly shaped our interlocuters’ meanings and methods of working with COVID data. First, dashboards’ promise to present both real-time and historical data affected how they dealt with the irregular temporalities of COVID data. They sought to bring order to disparate data cycles by synchronizing releases and recovering deleted data, as a means to regularize the temporal rhythms of what we come to know about the pandemic. Second, dashboards’ mission to make data actionable led our interlocuters to develop conflicting data beliefs—while recognizing that data often obscures pandemic inequalities, they also deemed it indispensable for keeping states accountable and advocating change. This dilemma imposed an emotional toll, as our interlocuters navigated mixed experience of commensurating lives and deaths while fearing desensitization through numbers. And lastly NVD and Stop AAPI Hate developed alternative means of data validation prioritizing community participation. Instead of relying on data as a tool to depict the “accurate reality” of the pandemic, they leveraged the inherent ambiguity in the validation process as an opportunity for community healing and rebuilding. In all, the COVID dashboard projects we examined differently worked against representation alone by holding a critical ambivalence toward the complete, accurate, and whole picture of the pandemic that their datasets could capture. As critical consumers and producers of data, dashboard builders were contentious that the epistemologies dashboards aim to embody may include deliberate efforts that undermine the idealized representational project of data dashboards.
We conclude this paper with a pragmatic note. The array of data injustices presented in this paper should serve as a cautionary remark for researchers who work with the datasets related to COVID-19. Employing these datasets for policy interventions without scrutiny could exacerbate the very epistemic injustices they aim to address. Scholars and practitioners must account for the “messiness” of data production and infrastructural maintenance when working with COVID data and devise strategies to incorporate other forms of knowledge that complement the data problems we address here. Instead of viewing missing data as mere “limitations” of research, we should regard it as a constitutive part of the politics of knowledge production in which we are implicated.
Footnotes
Declaration of conflicting interests
The authors declared no potential conflicts of interest with respect to the research, authorship, and/or publication of this article.
Funding
The authors disclosed receipt of the following financial support for the research, authorship, and/or publication of this article: This work was supported by the National Science Foundation, Omidyar Network, Alfred P. Sloan Foundation, Mozilla Foundation, Ford Foundation, Open Society Foundations (grant number 2109924).