
Abstract
The development of open government data has attracted interest from academics and practitioners. However, only a few studies have examined a culture-based account of open government data development. This study empirically investigates the impact of national culture on open government data. Through the data investigation and analysis of 55 countries, this research finds that the development of open government data is positively linked with national culture with respect to individualism, indulgence and long-term orientation and is negatively related to power distance. Furthermore, this study shows that economic development moderates the relationship between national culture and open government data development, especially with respect to individualism and long-term orientation. Practically, the findings of this research can help policymakers better understand the multifaceted impacts of national culture on the development of open government data, including the promotion of cultural values (i.e. high individualism, high indulgence, and high long-term orientation) and the change in the passive and conservative attitude of citizens toward the openness of government data in countries where power distance culture is high.
Introduction
The rapid development of open government data (OGD) in the context of e-government has attracted interest from academics and practitioners (Attard et al., 2015; Janssen, 2011; Janssen et al., 2012; Kassen, 2013; Purwanto et al., 2020; Safarov et al., 2017; Ubaldi, 2013; Zhenbin et al., 2020), and it has become clear that updated insights would be useful for OGD policymakers (Zuiderwijk et al., 2021). Research has suggested that some societal factors, such as policies and economic, cultural, legal and organizational factors, influence OGD development (Dawes et al., 2016; ODBI, 2017; Ubaldi, 2013). By identifying existing OGD-focused research from societal perspectives, this study finds that the influential factors and their impacts on OGD phenomena have mainly been investigated from perspectives such as policy and legislation (Canares and Shekhar, 2016; Janssen, 2011; Kulk and Van Loenen, 2012; McDermott, 2010; OECD, 2020; Zuiderwijk et al., 2014), economics (Iemma, 2012; Mishra et al., 2017; Verma and Gupta, 2013) and culture (Nugroho et al., 2015; Saxena, 2018a). In addition, an ecosystem approach was undertaken to examine the OGD initiatives from a sociotech perspective (Dawes et al., 2016; Styrin et al., 2017; Ubaldi, 2013; Zuiderwijk and Janssen, 2014a). However, compared with e-government research, the influence of culture on OGD development has been limited. In addition, the impact of economic factors on OGD has not yet been explored. In this context, this study aims to provide more information about the relationships between cultural and economic factors and OGD.
Existing research has revealed the connections between OGD and national culture (NC) (Reale, 2014). Culture is an important aspect of national-level open data policies (Nugroho et al., 2015; Purwanto et al., 2020; Saxena, 2018b; Zuiderwijk and Janssen, 2014a). However, only a few studies have captured a culture-based account of OGD development. Existing research shows that only a few articles have focused on OGD policies and compared OGD policies in the cultural presence of different countries based on cultural dimensions (Nugroho et al., 2015; Zuiderwijk and Janssen, 2014b).
Subsequent work in this area by Saxena (2018b) compared the development of OGD by investigating portals in Japan, the Netherlands, and Saudi Arabia to investigate the influence of NC.
These studies illustrate the essential role of NC in OGD development in terms of policies and portals, but empirical analysis of the relationships between NC and the development of OGD is lacking. Other societal factors, such as economic growth, that affect OGD have not yet been explored.
Based on the definition by Hofstede (1983), NC is a collection of collective ideas and values that distinguish the inhabitants of one nation from others (Zhao et al., 2014). Kumar et al. (2021) and Zhao (2011) noted that the effects of NC on e-government development have been widely acknowledged in terms of the significant impact of NC not only on the overall development of e-government and e-government readiness, adoption, usage and diffusion but also on citizens’ perceptions and behaviors toward e-government (Adnan et al., 2017; Khalil, 2011; Merhi, 2018; Van et al., 2021; Zhao et al., 2014). These studies have also elucidated the influence of NC on OGD. According to United Nations surveys, a country's level of e-government development corresponds to its level of economic growth (UN, 2020). Considering the large differences in OGD development levels in developing and developed countries, this study also raises the issue of whether and how the level of national economic growth has an impact on the development of OGD either directly or indirectly through its effect on NC.
This study addresses the following two questions: RQ 1: How does culture affect the OGD development globally? RQ2: How does economic growth moderate the cross-national effect of culture on OGD development?
To address the research questions, this study uses the Hofstede NC and Open Data Barometer Index (ODBI) 1
Related research
The effect of NC on OGD
Zuiderwijk and Janssen (2014b) investigated Dutch culture, which is characterized by decentralized power, individualism (IDV) and short-term orientation in terms of Hofstede's cultural dimensions (Hofstede (2001). These authors found that when they compared their results on Dutch open data policies to other countries’ open data policies, national cultural aspects should be considered. Their work was followed by a cross-national comparative framework to analyze open data policies from other nations and to draw lessons for developing open data policies (Nugroho et al. (2015), in which the authors also suggested a comparison of the cultural aspects of national OGD policies based on cultural dimensions (Hofstede et al., 2010; Trompenaars and Hampden-Turner, 1998). Their observation and interviews demonstrated the influence of NC on OGD policies; that is, universalistic societies (e.g. the United States, the United Kingdom and the Netherlands) have superior standards in place that encourage data availability. In contrast, in Kenya and Indonesia, government officials are concerned about what data would be shared and how this may affect individuals’ perceptions of the government. Both set a research focus on OGD policies. Later, Saxena (2018b) investigated the influence of culture by comparing the development of open data in Japan, the Netherlands and Saudi Arabia and found that cultural dissimilarities between the three nations were reflected in their level of dedication to open data initiatives. For example, the Netherlands, which ranks high in “femininity” and “long-term orientation (LTO),” is more active in disseminating data sets, with several government bodies taking the initiative to publish these data sets.
Existing studies suggest further research in terms of how culture influences OGD development in a global scope, and there is a need for empirical cross-context analysis (Saxena, 2018a, 2018b). However, empirical analysis of the relationships between NC and the development of OGD is still lacking.
NC in e-government
With respect to the effect of NC on the overall development of e-government, Zhao (2011) empirically evaluated the impact of NC on e-government initiatives in 84 countries worldwide and found that of the five cultural dimensions described by Hofstede, IDV, power distance (PD) and LTO were positively correlated with the development of e-government. Similarly, the research of Kumar et al. (2021) indicated that in 78 countries, cultural dimensions and per capita gross domestic product (GDP) were major determinants of e-government growth and development.
With regard to the impact of NC on the readiness of e-government, Kovačić (2005) examined the influence of NC on e-government readiness and its components for 95 countries. The findings of Khalil (2011) indicate that national cultural values and practices are associated both adversely and favorably with e-government readiness with the exception of performance orientation and assertiveness. Furthermore, gender egalitarianism, institutional collectivism, performance orientation and uncertainty avoidance values were also identified as major drivers of e-government readiness.
The results of a study on the effect of national cultural factors on e-government usage in 49 countries showed that nearly all of Hofstede's cultural dimensions and e-government usage were significantly related and that e-government usage was higher in nations that scored low in PD, uncertainty avoidance index (UAI), IDV, and masculinity (MAS) (Merhi, 2018).
According to worldwide research, culture has both positive and negative impacts on e-government diffusion, while economic growth (as measured by GNI per capita) has a moderating role in the link between culture and e-government diffusion (Zhao et al., 2014). According to worldwide research, culture has both positive and negative impacts on e-government diffusion, while economic growth (as measured by GNI per capita) has a moderating role in the link between culture and e-government diffusion (Zhao et al., 2014).
With regard to ICT implementation in e-government, research findings have focused on the potential impact of cultural differences on the e-government application of ICT through a comparison of two administratively similar but economically and culturally disparate countries, the United Kingdom as a developed country and Sri Lanka as a developing country (Ali, 2009). In addition, Al-Lamki (2018) investigated how and to what extent cultural factors facilitate or impede the effective application of ICT and the PD in NC that is present in the selected e-government portals (Adnan et al., 2017).
Regarding NC and citizens’ perceptions and behaviors toward e-government, quite a few researchers, such as Aladwani (2013), have identified cross-cultural differences between users’ perceptions of e-government quality attributes, attitudes and intentions to adopt e-government services (Aida and Majdi, 2014; Akkaya et al., 2012; Arslan, 2009; Rufín et al., 2014; Van et al., 2021) and e-government usage behaviors (Vo et al., 2016).
Research framework and hypothesis development
The conceptual model of this research is based on the NC framework of Hofstede et al. (Hofstede, 2001; Hofstede et al., 2010). The model consists of six cultural dimensions that were originally established by Hofstede. Among them, PD, IDV (versus collectivism), MAS (versus femininity), UAI, LTO, and indulgence (IND) are noteworthy for the cultural context of OGD. In addition, economic growth is added to the research model as a control variable.
PDI and OGD
The concept of PDI in Hofstede's research is the degree to which less influential representatives of an organization within a country anticipate and recognize unfair power distribution (Hofstede et al., 2010). Societies with a higher PDI appear to be stratified such that citizens follow a social hierarchy and obey the higher authority (Bogatyreva et al., 2019).
E-government development, dissemination and adoption are often low in countries with high PDI (Khalil, 2011; Zhao et al., 2014). Specifically, countries with high PDI scores, such as Saudi Arabia, Japan and the Netherlands, are more cautious in implementing open data initiatives (Saxena, 2018b).
Therefore, this research predicts the following:
IDV and OGD
IDV (vs collectivism) explains the way citizens look after themselves in a certain NC as opposed to caring about the society, organization or association to which they belong, and the way they want the collective to look after them (Knein et al., 2019).
IDV motivates individuals to put their own interests first instead of collective interests (Seng et al., 2010). An investigation of the relationship between IDV and e-government (Zhao, 2011) showed that countries with high levels of IDV appear to possess a high degree of growth in the e-government market, consistent with Kovačić's observation (Kovačić, 2005). In the practice of open data initiatives, a country with a collectivist culture is more reserved (Saxena, 2018b). IDV is regarded as a culture that is favorable for open data (Nugroho et al., 2015).
MAS and OGD
MAS versus femininity refers to the distribution of emotional roles between the genders. It contrasts “tough” masculine societies with “tender” feminine societies. Hofstede describes MAS as a preference for accomplishments, heroism, and assertiveness to achieve societal success. In contrast, femininity may be described as a desire for solidarity, modesty, care for the weak, and quality of life (Hofstede et al., 2010). A culture of high MAS emphasizes strength, confidence, and personal success (Watson et al., 1994).
Kovačić (2005) claimed that citizens are confident in an environment with high MAS where ICTs are introduced because these innovations encourage competitiveness, both of which are significant components of masculine culture. Similarly, countries with feminist culture are more active in OGD portal performance (Saxena, 2018b).
UAI and OGD
Nations with a low UAI culture tend to take more chances and are more accepting of aberrant behavior and novel ideas (Hofstede, 1980). In contrast, countries with strong UAI values are prone to reduce risk and are not in favor of making changes (Aykut, 2009). People in these countries depend more on official policies and practices to ensure that problems of uncertainty do not emerge (Prince and Kabst, 2019). Aykut (2009) findings indicated that there was no association between UAI and the adoption of e-government in Europe. In addition, Kovačić (2005) and Zhao (2011) conducted global-level studies and showed that the correlation between UAI and e-government was not significant.
However, the research of Sanena (2018b) on OGD found that countries with high scores on UAI are less likely to provide open data sets for fear of trespassing privacy.
LTO versus short-term orientation
Countries with a culture of LTO tend to prioritize long-term success and develop strategies to fulfill future expectations (Ashkanasy et al., 2004).
The research of Khalil and Seleim (2009) presented a significant link between future-oriented culture and the capacity for societal information dissemination. Aykut (2009) also observed a positive association between LTO and e-government adoption. Countries that score high in terms of LTO are more active in OGD endeavors (Saxena, 2018b).
IND versus restraint
IND versus restraint is the latest dimension added to the cross-cultural model by Hofstede in 2010 (Hofstede, 2011). It refers to the level of satisfaction with the present situation. In a high IND society, individuals have a strong desire to obtain information and knowledge to achieve their goals and fulfill their needs (Enkh-Amgalan, 2016). Existing research has also found that IND has a direct positive influence on e-government development, which suggests that nations with a high level of IND believe that accessing and using e-government services is essential to human gratification (Kumar et al., 2021). Therefore, this research assumes that governments in countries with high IND values have a strong intention to provide access to information and open their data to provide better services, promote transparency and help their citizens achieve their life goals.
Economic development
Hofstede (2006) and House et al. (2004) suggested a correlation between different cultural dimensions and national wealth and showed that culture is influenced by economic factors. According to an empirical cross-sectional study, there is a significant association between culture and the national economy (Inglehart and Baker, 2000). Boyer-Wright and Kottemann (2009) and Kumar et al. (2021) identified a correlation between economic development in different societies and the levels of e-government, which play a significant part in the diffusion of e-government (Zhao et al., 2014).
Thus, this research develops the following hypotheses:
This research presents the research model and illustrates the hypothesized relationships in Figure 1 for empirical testing. Hofstede allocated a score ranging from 1 to 100 for all six cultural dimensions for each country. Economic development is measured by GDP per capita, and the ODBI is used for OGD development.

Research model of hypothetical relationships between national culture and OGD moderated by economic development.
Data and research methodology
To validate the proposed hypothesis, this research utilizes two online data sets: the Open Data Barometer Index (ODBI (2017)) and Hofstede's NC Dimension Indexes with scores (Hofstede, 2016). The cultural dimension index from 84 countries (Hofstede et al. (2010) and the 4th edition of the ODBI (ODBI, 2017), which is the most recent full edition and provides the most up-to-date data on OGD endeavors in 115 countries and jurisdictions worldwide, are used to address the research questions. In addition, GDP per capita, as an indicator of national economic growth (WorldBank, 2016), is introduced to investigate the moderating effect of economic development on NC.
Measures
Independent variable: NC
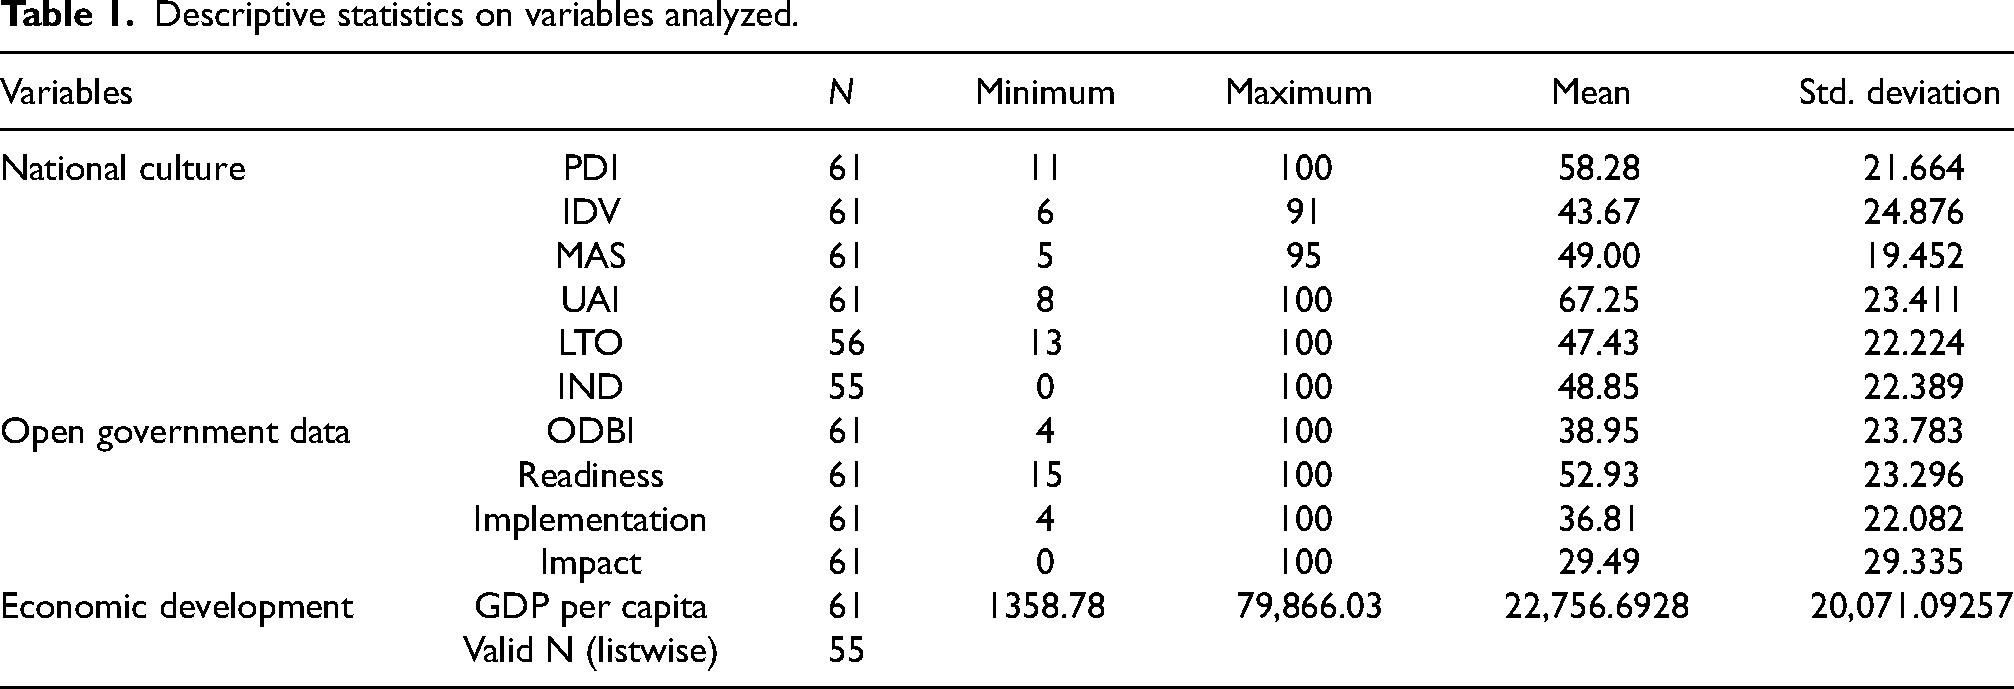
NC values, including Hofstede's six cultural dimensions, are the independent variables. Hofstede (2001, p. 9) defines culture as “the collective programming of the mind that distinguishes the member s of one group or category of people from another.” According to this definition, NC is a set of collective beliefs and values that distinguish people of one nation from those of another. Hofstede's updated cultural index scores from low (0) to high (100) are used to analyze variations between different countries (Hofstede, 2016). Excluding countries that do not appear in the ODBI, the index scores that are currently available for this analysis include 61 countries for the first four indexes (PDI, IDV, MAS and UAI), 56 countries for the fifth index (LTO), and 55 for the sixth index (IND). Therefore, in this research, the final analysis is based on a balanced data set of 55 countries (see Appendix Table A3).
Dependent variable: The development of OGD
The development of OGD, measured by the ODBI, is the dependent variable for this study. The ODB debuted its fourth edition in 2017, which included 115 nations and regions. The ODB provides a worldwide gauge of how governments issue and use open data for accountability, innovation, and social impact (ODBI, 2017).
The ODBI is a composite index comprising three subindexes:
Readiness for open data initiatives. Implementation of open data programs. Impact of open data on business, politics and civil society.
ODBI = (0.35 = Readiness index) +(0.35 = Implementation index)+ (0.30 = Impact index).
Moderating variable: Economic development
The World Bank's GDP per capita data from 2016 (World Bank, 2016) are used to assess economic development (the moderating variable).
The initial statistics on the variables are presented in Table 1. This research applies SPSS tools to the correlation and regression analysis to evaluate the hypothesis and to evaluate all the variables mentioned above.
Descriptive statistics on variables analyzed.
Statistical methods
To test the hypothesis, this research first involved Pearson correlation analysis to explore the relationships of the NC variables, GDP per capita, and the ODBI and its subindexes, followed by a set of regression analyses to identify the determinants that describe the variation in OGD development across countries in detail to validate the connection between NC and OGD. These two statistical methods have been used in related research on the impacts of culture on e-government (Khalil, 2011; Kovačić, 2005; Zhao, 2011; Zhao et al., 2014).
Results
Table 2 presents the correlation of NC, GDP per capita, and the ODBI and their subindexes. It shows a positive association between the NC variables and the ODBI, IDV (r = −0.651, p < 0.01) and IND (r = −0.542, p < 0.01) and a negative association with PDI (r = 0.467, p < 0.01).
Pearson correlation matrix: correlations between variables.

Correlation is significant at the 0.01 level (2-tailed); *Correlation is significant at the 0.05 level (2-tailed).
Table 2 also highlights the positive association among the NC values of IDV and IND with each subindex of the ODBI (readiness, implementation, and impact). The relationship between the PDI and OGD subindexes is negative, as is the relationship between the LTO and readiness subindex. Therefore, H1, H2, and H6 are fully supported, while H5 is not supported.
The result also indicates that GDP per capita has a positive correlation with both the ODBI (r = 0.71, p < 0.01) and its subindexes of the readiness index (r = 0.685, p < 0.01), implementation index (r = 0.694, p < 0.01), and impact index (r = 0.606, p < 0.01) but a negative correlation with PDI (r = −0.684, p < 0.01) and UAI (r = −0.328, p < 0.05).
To further explore the relationships between culture and OGD, we performed a regression analysis. The outcomes are presented in Table 3, which shows that the IDV index (β = 0.501, p < 0.01) and LTO index (β = 0.323, p < 0.01) have markedly positive correlations with the ODBI. In addition, the association between IND is confirmed, in accordance with the findings of the Pearson correlation analysis shown in Table 3. These findings support H2, H5, and H6. With a β score of −0.014 and a p-value of 0.92, the PDI fails the significance level test, which is also consistent with the results shown in Table 3, confirming H1.
Results of regression analysis: national culture indexes and ODBI.

To explore the R square change and focus on the potential problem of multicollinearity, this research conducted a hierarchical regression and analyzed the variance inflation factors (VIFs). The model summary (see Appendix Tables A1 and A2 for details) shows that none of the components surpass 10.0, demonstrating that multicollinearity is not a problem in this investigation. This research also finds that the six NC indexes collectively explain approximately 49% of the variation (R2 = 0.486 in model 4) in the ODBI, while IDV explains 36.6% of the variation in model 1. When examining the R square change in the four models by entering the variable values in the order of IND, LTO, and the remaining three indexes, this research finds a change from 8.8% to 7.1% and then to 0.6%. The above results show that IDV, IND, and LTO are the main indexes that explain most of the variation (without GDP per capita) in the ODBI, and IDV is a relatively more significant cultural dimension in forecasting OGD than IND and LTO.
Multiple regression analysis is also carried out to identify the factors that best describe the variation in the ODBI and its subindexes across different NCs. Table 4 presents the effects of the various regression models on each of the dependent variables. GDP per capita (model G3) alone explains 50%, 47%, 48%, and 37% of the variation in the ODBI, readiness index, implementation index, and impact index, respectively. Moreover, the NC indexes of IDV and IND and GDP per capita mode (model G1) collectively explain 58% of the variation in the ODBI, while IDV, LTO, and IND in the NC-only model (model G2) explain 54% of the variation in the same index. When NC is introduced to the regression model (model G1), the percentage of the described variation in OGDI increases from 50% (model G3) to 58% (model G1). When GDP per capita is introduced into the regression model (model G1), the percentage (%) of the described variation in OGDI NC increases from 54% (model G2) to 58% (model G1). This result indicates that NC describes a greater proportion of OGD variation than GDP per capita, although the latter is still a significant determinant of OGD.
The summary of results using two statistical analysis methods.

Model summary and coefficients (SPSS outputs).
Table 5 shows that IND has a positive sign in both of the NC models (model G1 and model G2) of the ODBI (OGDI) and its components, while IDV has a positive sign and the highest coefficient in both of the NC models of the ODBI and its components (except for impact index and readiness index in model G1). LTO shows a positive sign only in the NC-only model (model G2) of the OGDI and its components. The MAS index has a negative sign in both of the NC models (model G1 and model G2) of the implementation index model. The other two NC indexes—PDI and UAI—both have no significant coefficient in any of the regression models for OGD and its subindexes. In addition, this research indicates that when GDP per capita is introduced to the regression model (model G1) in line with ODBI, LTO in model G2 does not appear in model G1, while the β-coefficient of IDV and IND decreases, which means that GDP per capita has a moderating effect on LTO, IDV, and IND, supporting H7b, H7e, and H7f.
Summary of regression results of the impact of national culture and GDP per capita on open government index and its sub-indexes.

In summary, H1, H2, H3, and H6 are supported, whereas without GDP per capita, H2, H5, and H6 are also supported. However, H4 is rejected. In addition, the results of the analysis show that H7b, H7e, and H7f are supported.
Table 4 represents the summary using two statistical analysis methods.
This research reveals not only the overall impact of NC on OGD development but also the variation among countries (R2 = 0.54). However, economic development also plays moderating roles in the effect of IDV, LTO and IND on the development of OGD.
Specifically, this research finds that IDV has a significant and positive impact on the development of OGD and that it provides the greatest influence on the development of OGD (Saxena, 2018), which indicates that individualistic cultures are more likely to make public data sets and reuse data sets while collectivist cultures are reserved in applying their open data initiative. Similar research on the correlation between NC and e-government has observed that high IDV cultures are inclined to adopt e-government and have a higher level of e-government development than collective cultures (Khalil, 2011; Kovačić,2005; Kumar et al., 2021; Zhao, 2013; Zhao et al., 2014).
Compared with existing research, however, the results of this finding further specify the positive effects of IDV on OGD components, as countries with high IDV cultures are more active in preparing for OGD (Readiness index) and open more important data sets (Implementation index), and their open data lead to more positive political, social, environmental and economic changes (Impact index).
This research indicates that IND is significantly and positively related to OGD development. IND, as a newly added dimension of culture, has not yet been analyzed in OGD-related research, and few researchers have explored the relationship of IND with e-government. Kumar et al. (2021) found a positive correlation between the two. The findings of this research fill this knowledge gap and suggest that a free atmosphere and fewer restraints have a positive impact on OGD. It is reasonable that a high IND culture prioritizes open data, which helps citizens obtain what they expect from the government, such as improved public services, more openness, and accountability.
LTO is moderately and positively correlated with the development of OGD, which is only supported in multiple regression analysis. This finding is congruent with the findings of Saxena (2018), who showed that LTO cultures are more willing to share data sets for long-term sustainability. Zhao (2011) found that countries with a LTO have a stronger intention to develop and implement e-government and that they consider it to be a long-term benefit. Khalil (2011) also found that strongly future-oriented countries are likely to have a large demand for information and government services to facilitate their social and economic development initiatives. These results also explain our finding that countries with a LTO are likely to have a high level of OGD development.
PDI is weakly negative for the development of OGD, which is only supported by Pearson correlation analysis. Saxena (2018) pointed out that in high-power cultures, there is a risk of sluggish decision-making regarding the improvement of data sets or the implementation of new technologies in the open data portal. Several researchers, such as Kumar et al. (2021), Khalil (2011) and Zhao (2011), have found that PDI is significantly and negatively related to e-government development and its diffusion, readiness and adoption. However, our study finds that the effect of PDI on OGD is not as significant as previous e-government studies have indicated. This result agrees with Zhao's finding (Zhao et al., 2014), which indicates that even though PDI is linked to e-government development, its impact is not as high as that of IDV or LTO.
In identifying the possible determinants of the development of OGD and GDP per capita, this research indicates that GDP is able to explain approximately 50% of the ODBI variation across nations. The results of this research also reveal that economic development moderates the effect of IDV, LTO, and IND on the development of OGD. Specifically, GDP per capita is significantly positively correlated with the readiness subindex of ODBI compared with the other two subindexes.
However, the results of this research indicate that NC determines a larger proportion of OGD variation than GDP per capita does. This result partially confirms the conclusion of Khalil (2011), who holds that NC describes a slightly higher proportion of e-government readiness variation than GDP per capita alone does.
Discussion
Practically, the findings of this research can help policymakers better understand the multifaceted impacts of NC on the development of OGD. Based on the findings of this research, policymakers should (1) provide a long-term strategy and issue data sets in a detailed, reliable and timely manner; (2) leverage the cultural values of high IDV, high IND, and high LTO to significantly impact the development of OGD; and (3) change the passive and conservative attitude of citizens toward government data openness in countries with high collectivism and high PD cultures. The alignment of these findings with the OGD ecosystem, which highlights motivation for OGD initiatives (policies and strategies), has become a national and international trend (Dawes et al., 2016). This means that improving the policies and strategies for the OGD ecosystem NC is an important factor to be considered. In addition, national wealth contributes to the OGD ecosystem by providing better data sources and tools for analyzing the data.
As the first work to globally investigate and empirically study the impact of NC on OGD, this contribution fills a knowledge gap in this area. For scholars, the results of this investigative work should be understood in the context of its limitations. First, the validity of Hofstede's national cultural model is not unquestionable in view of the difficulty of isolating, defining and measuring culture (McSweeney, 2002). Other culture models such as GLOBAL may also be used to test the correlations between NC and OGD. In this study, due to the feasibility of Hofstede's model with our research issues, we decide to use it instead of considering McSweeny's study or GLOBAL. In addition, Hofstede's multiple dimension approach to culture is adopted in this study, which has been wildly tested and accepted in cross-culture research. Second, it is important to determine whether cultural factors can be considered control variables or alternative cultural proxy variables for NC to be included in the regression model. Finally, in addition to economic growth, future studies may explore the moderating roles of other social, educational and religious factors that could explain more variations in NC on OGD.
Conclusion
OGD, as a global movement, is promoted by technical, social, political, economic and cultural factors. This research focuses on the impacts of NC and economic factors on OGD development. To answer the first research question regarding how culture affects OGD development globally, the findings suggest that the development of OGD correlates positively with the cultural dimensions of IDV, IND, and LTO and negatively with PDI. To answer the second research question of how economic growth moderates the cross-national effect of culture on OGD development, the findings suggest that economic development in the form of GDP per capita moderates the influence of NC on the development of OGD, especially the IDV, LTO, and IND dimensions. Finally, NC explains more of OGD development than GDP per capita does. All the relationships are empirically demonstrated in the results section. Moreover, this study contributes to a better understanding of how culture impacts OGD and addresses cultural issues in OGD development.
This study provides both theoretical and practical implications. As there is limited research on culture and OGD, this study provides researchers with a better understanding of the positive and negative aspects of NC in OGD based on a solid analysis of a global survey. In practice, the findings of these contributions are significant for policymakers to learn from other countries’ experiences and to format and implement national OGD policies according to their local cultural and economic conditions. For example, in countries where PDI is high, which means that citizens have passive and conservative attitudes toward OGD, there is a need for policies and strategies to improve and encourage access to government data.
In addition to practical and theoretical implications, there are several limitations in this study: the data used in this study were not updated recently (see section “Introduction”), and not all countries provide complete data regarding culture and OGD (see section “Data and research methodology”), which calls into question the latest updates in this area. Furthermore, this study included a limited number of cultural dimensions and might not capture the richness and complexity of NC. Thus, studies in this domain should work further to address the cultural dimensions to increase the amount of cultural insight captured in the OGD. Future research designs may validate the outcomes of this exploratory study and investigate more elements that describe the different levels of OGD development across nations. The subject of scrutiny requires original data collection methods that include larger sample sizes and other methodological aspects that can provide a comprehensive view of cross-cultural interactions.
Footnotes
Acknowledgments
The authors would like to thank Professor Hepu Deng from the RMIT University, Australia, who provided knowledge and expertise that greatly assisted the research. We are also grateful for the insightful comments offered by the anonymous peer reviewers at Big Data & Society.
Declaration of Conflicting Interests
The authors declared no potential conflicts of interest with respect to the research, authorship, and/or publication of this article.
Funding
The authors disclosed receipt of the following financial support for the research, authorship, and/or publication of this article: This work was supported by the National Natural Science Foundation of China, the National Social Science Foundation of China (grant number 71473182 (NNSF) for XZ, 21&ZD334 (NSSF) for XW, and 23CTQ033 (NSSF) for CT).
Notes
Appendix 1
List of countries used for analysis.

| Countries | ||||
|---|---|---|---|---|
| Arab Countries | Croatia | Hungary | Netherlands | Slovenia |
| Argentina | Colombia | India | New Zealand | Spain |
| Australia | Czech Rep | Ireland | Norway | Sweden |
| Austria | Denmark | Indonesia | Pakistan | Switzerland |
| Bangladesh | El Salvador | Italy | Peru | Thailand |
| Belgium | Estonia | Japan | Philippines | Trinidad and Tobago |
| Brazil | Finland | Korea South | Poland | Turkey |
| Bulgaria | France | Latvia | Portugal | Uruguay |
| Canada | Germany | Malaysia | Russia | USA |
| Chile | Greece | Mexico | Serbia | Venezuela |
| China | Great Britain | Morocco | Singapore | Vietnam |