
Abstract
This article introduces the methodology of the ‘Ontology Explorer’, a semantic method and JavaScript-based open-source tool to analyse data models underpinning information systems. The Ontology Explorer has been devised and developed by the authors, who recognized a need to compare data models collected in different formats and used by diverse systems. The Ontology Explorer is distinctive firstly because it supports analyses of information systems that are not immediately comparable and, secondly, because it systematically and quantitatively supports discursive analysis of ‘thin’ data models – also by detecting differences and absences through comparison. When applied to data models underpinning systems for population management, the Ontology Explorer enables the apprehension of how people are ‘inscribed’ in information systems: which assumptions are made about them, and which possibilities are excluded by design. The Ontology Explorer thus constitutes a methodology to capture authorities’ own imaginaries of populations and the ‘scripts’ through which they enact actual people. Furthermore, the method allows the comparison of scripts from diverse authorities. This is exemplified by illustrating its functioning with information systems for population management deployed at the European border. Our approach integrates a number of insights from early infrastructure studies and extends their methods and analytical depth to account for contemporary data infrastructures. By doing so, we hope to trigger a systematic discussion on how to extend those early methodical innovations at the semantic level to contemporary developments in digital methods.
Introduction
This article details the methodology of the ‘Ontology Explorer’ (OE), a method and a tool devised and developed by the authors to analyse data models which underpin information systems. 1 The OE is a semantic method and JavaScript-based open-source tool that compares data models collected in different formats and used by diverse systems. The OE is distinctive in two respects. Firstly, it supports analyses of information systems that define their own data models, even if these systems are not immediately comparable. Secondly, it systematically and quantitatively supports discursive analysis of ‘thin’ data models, also by detecting differences and absences between systems. To achieve this, the method extracts, analyses, compares and visualizes heterogeneous data models all at once. Applying this structured approach to the data models used by diverse organizations will make it possible to observe differences and similarities in the data models of diverse data infrastructures. 2
The OE integrates a number of insights from early infrastructure studies and extends their methods and analytical depth to account for contemporary data infrastructures. For many years, infrastructure studies have paid close analytical attention to classifications as an important force in shaping and ordering sociotechnical relations, as well as how categories may become contested or invisible. At the same time, these studies have noted how classifications are embedded into infrastructures, where they have a tendency to become taken for granted. More recently, data-oriented activists are well aware of the need to contest and intervene in the politics of data (Beraldo and Milan, 2019; Iliadis, 2018). Yet, to challenge prescriptive representations, they first need to be analysed using methods that can systematically do so.
Compared with existing digital methods, the OE features some unique characteristics that make such analyses possible. The method bears a resemblance to approaches that, for example, employ web scraping and correlation techniques to examine traces of data to find structures and patterns that may otherwise be hard to discern. However, the OE is distinctive in its attention to the technical details of systems (rather than the generated data) and in its ability to make non-homogeneous data formats comparable. In this manner, the OE supports discursive analysis, including analysis of differences and absences, and makes it possible to compare the expectations and imaginaries of diverse social actors, and forms of resistance to them.
Our methodological proposal aims to answer a broad set of research questions about how populations are enacted, and how authorities and countries differ in the way they enact them. In this way, the OE constitutes a methodology to capture authorities’ own imaginaries of ‘intended’ people, and the ‘scripts’ through which authorities enact actual people as such (Pelizza and Van Rossem, under review). It thus enables the apprehension of how people are ‘inscribed’ in information systems: which assumptions are made about them, and which possibilities are excluded by design. For instance, analysing population data collected by social security agencies can show in-built assumptions in the systems that automate decisions about receiving benefits (Eubanks, 2018). Another example is the COVID-19 pandemic and its attendant rapid changes in data practices, which have highlighted a need to analyse categories of data on population and health, and how presences and absences of data can cause uneven impacts of the virus on people (Leszczynski and Zook, 2020). In this article, an illustrative use of the method to analyse information systems deployed at the European borders shows that the method allows the comparison of various EU and Member State authorities’ scripts about mobile populations.
The paper is structured in the following order: in the following section, we review the methodological approaches that have inspired our work; next, we discuss the design principles of the OE as a methodology to be, in the first instance, deployed in the field of population management. Then, after a brief discussion of the methods for data model collection, we describe the OE method and tool for data models analysis, followed by an illustration of how it functions in the real world by analysing the data models underpinning selected information systems for border control management. Finally, these illustrative uses help us to reflect on the OE's contribution to a discussion on how to extend infrastructure studies’ early methodical innovations at the semantic level to contemporary developments in digital methods for population management.
Review of methodological approaches
Critical studies on classifications have made it clear that information systems’ categories shape and benefit forms of knowing, valuing and doing (Bowker and Star, 1999). This capability goes hand in hand with the ability of categories to make other forms undocumentable and, consequently, invisible. Data models embodied in digital information systems are, moreover, embedded in complex arrangements of – and relations between – actors. As a result, formalized representations of knowledge tend to become invisible even to actors who interact with the systems. Unsurprisingly, then, the invisibility and transparency of data models and their information systems have inspired various strands of research that propose methods to make visible the politics of designing such models and systems, and their world-making effects when deployed (Kitchin and Dodge, 2011). It must be noted that, while this section reviews some of these related strands of research, it is not the intention to comprehensively review all such methodological approaches. Rather, to structure the discussion, we grouped similar strands together according to similarities in their approach and the characteristics that inspired our own method.
Classification and its consequences
Our method and tool draw on studies about classification that were popular in the late 1990s, epitomized by the well-known study by Bowker and Star (1999) about the processes of creating classification systems and their effects on social organization. The use and discussion of this early work is still widespread, which highlights its enduring relevance and topicality. Scholars in this field have shown how the politics of designing systems that standardize and classify parts of the world (people, objects, work etc.) into discrete categories not only shape how information is represented but also affect what becomes both visible and, consequently, invisible (Bowker and Star, 1999; Hanseth and Monteiro, 1997; Suchman, 1993). Furthermore, most options that are objects of choices made during design processes easily become invisible, as only what is in the systems is usually (and at best) documented. It is thus not surprising that these studies have mainly used discursive methods, drawing on interviews, ethnographic observations, historical and narrative accounts, textual analysis, with the added aim of retrieving any missing data (Clarke, 2005). In short, data absence has become as meaningful as data presence, and this is a crucial key insight that the OE has inherited from classification studies of infrastructures.
Another insight further developed by the OE concerns the design and standardization that are essential to information systems that link actors with their imprints (Hanseth and Monteiro, 1997). People, objects, relations and actions must all fit into the categories and categorical values foreseen by information systems. In this way, categories used by states to classify their residents, for example, consequently shape relations between states and individuals, such as facilitating or restricting access to benefits (Ruppert, 2014). These influences are made durable and thus can have long-lasting effects. Specialists involved in the development of systems are, therefore, not only designing technical systems but making (im)possible certain actions, practices and relations (Suchman, 1993). 3
Overall, methods developed in this tradition have addressed the question of how to retrace the ethical and political work of otherwise unremarkable devices of representation. Researchers have used and combined various makeshift methods – from narrative interviews (Gazan, 2005) to discursive textual analysis (Caswell, 2012), and from participant observation (Meershoek et al., 2011) to archival and genealogical research (Gasson, 2006) – for the ethnographic and historical studies of information systems (Star and Ruhleder, 1996) and their classifications. It is necessary to take an interdisciplinary approach and pay close attention to the technical details of classification alongside the effects of classification (Kitchin and Dodge, 2011).
Representing and intervening
The rise of Big Data (and its effects on the volume, variety and uses of data) has prompted research fields such as Critical Data Studies (CDS) to renew calls to make the ways in which data is generated, circulated and deployed more visible (Iliadis and Russo, 2016; Kitchin and Lauriault, 2018). While researchers investigating classifications and infrastructures mainly take a relational approach to study infrastructures and social order, CDS researchers prefer different approaches to examine power structures of data. They emphasize how data is never ‘raw’ but always shaped by different choices and constraints (Gitelman, 2013). The two strands of research are thus in many ways complementary. Even so, new and important questions have been raised by CDS on how the links between different mechanisms and elements that constitute data shape power relations. For example, which aspects of everyday experience are datafied? Which ones are made invisible? And, who benefits?
Understanding the ways in which data is constituted, therefore, becomes especially important for critical approaches that aim to intervene in the ‘data politics’ (Ruppert et al., 2017) of how subjectivities come into being. For example, analyses of information systems and their data models and standards in other fields have shown how such systems can enact young people as young offenders through various interconnected data strands (Ruppert, 2013), how different systems and standards enact assumptions about what constitutes a family in distinct ways (Cornford et al., 2013), or how data models translating a city into data can reshape the city (Lauriault, 2017). The goal for these researchers is, to a greater extent, normative to stamp out inequality and injustice in data systems: to examine unequal power relations and ask who benefits and, next, challenge these power relations using data (D’Ignazio and Klein, 2020). However, this field emerged ‘as a loose knit group of frameworks, proposals, questions, and manifestos’ (Iliadis and Russo, 2016: 3) and is still settling on its theories and methods. Systematizing methods to examine data models can therefore serve as an important step to enable interventions into data politics.
Distributed systems and infrastructures
Information systems are entwined in digital infrastructures and practices, instituting certain ways of knowing and working among distributed locales (see, e.g. Bowker and Star, 1999). Data models designed to represent phenomena can thus be considered as a technology that enacts particular kinds of knowledge, organizations and practices at different times and places (Bloomfield and Vurdubakis, 1997). In other words, data models underpinning information systems can be understood as part of infrastructures that connect and coordinate geographically distributed actors and practices.
Scholars studying infrastructures have provided different methodological strategies to make visible the distributed interconnections between technical minutiae and the politics of knowledge production (e.g. Bowker and Star, 1999; Edwards et al., 2009; Monteiro et al., 2013). Investigating distributed infrastructures has primarily been addressed by approaching infrastructures as a ‘relational concept’ (Star and Ruhleder, 1996). Such relational approaches maintain that infrastructures are not objects of study in and of themselves, but show a preference for ethnographic methods to study how infrastructures emerge through interactive processes and practices (Karasti and Blomberg, 2018; Star, 1999). Methods include looking at moments of breakdown (Latour, 2005; Star, 1999), tensions in the emergence and growth of infrastructure (Hanseth et al., 2006) and material aspects (Ribes, 2019).
Debates still circulate on where to situate ethnographic and historical investigations of distributed infrastructures. Opinions differ on how to demarcate the site of where and how to investigate dispersed and distributed activities (Karasti and Blomberg, 2018): at a single site? Or, by comparing and connecting multiple sites? And on which (temporal) scale? An alternative approach to deal with these issues of scale is to take advantage of information that is produced by systems and members during their activities. Geiger and Ribes (2011), for instance, proposed to make use of various documentary traces, such as computer logging data that capture interactions between users and systems, to understand how distributed communities collaborate and coordinate. Their ethnographic approach turns these ‘thin documentary traces’ into ‘thick descriptions’ of communities and their activities. These approaches, however, do not specifically take into account the actual formats of data and the possibilities and constraints they entail: this is an issue that our method should instead consider.
Similarly to concerns raised by Geiger and Ribes (2011), data models can be considered ‘thin’ traces: being rather standardized schemas made of categories and values, they are barely meaningful in themselves (Pelizza and Van Rossem, under review). An analysis method should therefore consider how to turn these into ‘thick’ data. On the other hand, given their implementation in diverse infrastructures, data models can be an excellent starting point to understand how geographically distributed sites are connected (Latour, 2005). Burns and Wark (2020) dubbed such an approach ‘database ethnography’ and used traces left behind from a database as a site to analyse how social meanings of phenomena change over time – but, only using their own ad-hoc mix of methods.
So, while data models such as those implemented in databases are not always openly available for analysis, the use of documentary evidence can serve as a way to follow distributed phenomena. However, we should avoid an overly deterministic view of these abilities to enact particular kinds of knowledge (Hanseth et al., 2006). The strength to institute ways of knowing and acting depends also on data models’ capacity to adapt to local circumstances and forms of resistance.
Script analyses
The prescriptive representations of data models can thus be understood as scripts that inscribe and enact certain expectations of their designers. The notion of a script was originally introduced in social studies of technology to refer to the implicit instructions to users or affordances that are embedded in artefacts (Akrich, 1992; Latour, 1992). A script requires users to adopt standard recommended behaviours, like grasping a coffee pot by the handle, and so assumes certain user skills, conditions and interests – in our example, the user does not wish to burn their hand when grasping the pot. To some extent, data models can be conceived as scripts, as they require system users to adopt well-defined behaviours to sort and select phenomena into standardized categorizations. As such, studying data models that inscribe and enact expectations in the materiality of information systems can provide insights about designers’ expectations and their linked imaginaries (Pelizza and Van Rossem, 2021).
Furthermore, the conceptualization of a script introduces the possibility of accounting for resistance to technological artefacts in the form of a gap between expected uses, skills and abilities of intended users as they are assumed by artefact designers, and the actual uses and practices of empirical users. When intended and actual uses and skills correspond, we have – to use script jargon – ‘subscriptions’; when they do not, the term is ‘dis-inscriptions’ (Akrich and Latour, 1992). When there is a gap, it is usually investigated by comparing artefact analyses with an ethnographic observation of actual use. Also, in the case of data models, the expectations and imaginaries that they entail may be resisted, and new ones may be proposed. Our methodology should thus systematically support an analysis of subscriptions, as well as dis-inscriptions.
The scripts may also show how the material properties of information (e.g. data records, data models and databases) shape and structure how data is created and circulates, and shapes organizations and practices (Dourish, 2017). Paradigms and approaches for thinking about, modelling and managing data all influence the creation of a data model (Thomer and Wickett, 2020). A data model will invariably vary depending on the kind of database that is employed, whether it be relational, object oriented or graph based, and will need to subscribe to the expectations of the chosen database system. In the widely used relational model, for example, data is organized in tables with columns indicating data values (such as a surname) to be stored, and each row representing a relationship between these data values (e.g. a link between a surname, date of birth and nationality; or between a passport ID and a date of entry into a country). In this way, the paradigms and technologies underlying data models influence what counts as data, how data can be used and for whom.
Scripts and their material properties thus shape how informational representations inscribe and enact certain expectations for both categories and entities. The granularity of categories of data and their possible values, for example, will allow the capturing of only certain kinds of information about someone or something. To our knowledge, however, such a script approach has not yet been employed for digital methods that analyse technicalities of information infrastructures.
Digital methods
Drawing on a sociotechnical background similar to the one in which script analysis originally emerged, more recent developments have moved away from the technicalities of information infrastructures and prompted issue analysis as a field in need of innovative methodological solutions (Rogers et al., 2015). Issue analysis mainly relies on social media and web scraping techniques to analyse emerging topics, sentiments and imaginaries on the web. However, data interventions also need to examine structures of data, such as the data models underlying the informational representations of various systems.
While it is not the aim of this article to foreground the epistemic and methodological challenges brought about by the digitization of social life (for a thorough analysis, see Marres, 2017), it is noteworthy that the most common techniques adopted in the growing area of digital sociology combine scraping techniques of homogeneous web data, co-occurrence analysis of their lexicon, and some form of result comparison, usually through visualizations. Yet a number of research goals – like in the analyses of information systems for population management – require methods that go back to the technicalities of information infrastructures rather than focusing on (user-)generated contents. Details of diverse information systems’ data models may need to be systematically compared by harmonizing non-homogeneous data formats to support discursive analysis. For instance, differences and absences in data models may suggest differences in the expectations and imaginaries of diverse authorities towards social actors, and forms of resistance to those expectations. This is what the OE is meant to achieve and makes it distinctive within the field of digital sociology and its current developments.
Design principles of the OE as a methodology: Script, comparison and resistance
Following the previous review of methodological approaches, in this section, we describe three principles that have guided the development of the OE. First of all, however, we wish to make clear that we are not laying claim to the well-established achievements of others, as the OE is only novel in that it has integrated insights from existing classification and infrastructure studies, discourse analysis, and other strands described in the previous section. What makes the OE distinctive is the greater analytical depth into data infrastructures for population management, and the ad hoc combination of principles, requirements and solutions.
The first principle followed in the development of the OE assumes that data models, as the actual encoding of an ontology in an information system, can reconstruct the discursive model of a domain that is operative in that system. As was discussed in the section ‘Review of methodological approaches’ about data models as scripts, through ‘infrastructural inversions’ (Bowker and Star, 1999) it is possible to retroactively reconstruct not only the discourse that informed the design of a system, but also expectations and imaginaries about the object of knowledge. In the case of data models underpinning information systems for population management, this means that the way populations are endogenously ordered and classified provides a ‘meta layer’ of data for the observer. By looking at the assumptions that are made about people and examining the possibilities that are excluded by design, the analysis of data models can apprehend how people are inscribed in information systems.
In the case of information systems for population management run by authorities, an analysis of data models can capture authorities’ own imaginaries about populations: their expectations, assumptions and patterns of exclusion. Such imaginaries can be assimilated into scripts, as they inscribe such expectations about people in the materiality of data models (Pelizza and Van Rossem, under review). Our methodology should, therefore, systematically support a discursive analysis of data models to single out the scripts about individuals.
The second principle used in the development of the OE requires that such analytical support should proceed by comparison. Data models can be extremely ‘thin’: by themselves, categories and values do not appear to reveal much evidence about the scripts they embed. Knowing the list of countries that work as values of the category ‘nationality’ might not lead to substantive outcomes. Yet, as semiotics has theorized, meaning emerges from the comparison (see also Latour, 2005 and the methodological use that he makes of controversies). Meaning stems from the presence of (a set of) categories in some data models and the absence in some others. Through the act of comparison, we can see that the inclusion of a thin category like ‘profession’ in one system but not another reveals authorities’ differing imaginaries about people. For example, imagine two border control operations; one uses a migrant registration information system that includes only the category ‘language’, while the other distinguishes between ‘native language’ and ‘spoken languages’. In the first case, people are enacted as monolingual, in the second case, as polyglots.
A method that wishes to capture the scripts embedded in data models should therefore proceed by comparing those data models in order to detect meaningful differences and absences. Furthermore, such principle is also relevant when it comes to analysing ‘geographies of responsibility’ (Akrich, 1992; Oudshoorn, 2012); that is, the division of labour between authorities involved in population management. As we have shown in our 2021 publication, collecting certain categories of data about immigrants at European borders can profile some Member States as asylum states. By design, not collecting this data can impede the possibility for EU agencies and other Member States to host and integrate newly arrived people.
The third principle in the development of the OE requires that the new methodology can account for resistance to the scripts identified. The original formulation of a script indeed foresees cases of ‘dis-inscription’ in which users do not comply with their intended representation, adopt unforeseen uses of artefacts and act in unexpected ways (Akrich and Latour, 1992). So, what are examples of unforeseen uses of data models? Again, examples come from the field of migration management. ‘Categorical stretching’, for instance, has been defined by Pelizza (2019) as the behaviour of border crossers who refuse to comply with Western categorical definitions of family, work, nationality etc. Also, border officers might have levels of discretion (reliant on local knowledge) that resist certain standardizations, so influencing Schengen visa applications through street-level bureaucratic practices (Zampagni, 2016). In such cases, actual people resist the script embedded in data models and propose alternative ones. Similarly, our method should be able to conduct script analyses of intended people, while at the same time accounting for the possibility of practices of resistance exerted by actual people (to be further investigated through ethnographic research).
The OE as a method and a tool
As we’ve established, information systems define their data models in ways that are not immediately comparable. We, therefore, needed a method that would allow the extracting, analysing, comparing and visualizing of data models from heterogeneous sources. This section describes the different steps that we undertook to analyse data models systematically and quantitatively.
Data coding
As previously stated, documents reporting data models and their categories of data, that is, the labels describing a state that can assume different values can be very diverse: from regulations to design documents, from screenshots to interview transcripts. Such documents can be collected through desk research or fieldwork. However, to make such diverse descriptions of data models comparable we introduced a systematic approach to code, harmonize, and group all documents, categories and values.
The data coding consisted of three phases: preliminary in vivo coding, code harmonization and document grouping. All phases of data coding were conducted using computer-assisted qualitative data analysis software (CAQDAS). Preliminary in vivo coding entailed coding each category ‘in vivo’, that is, using the category name as the code. Code harmonization was then necessary to enable the grouping of codes that refer to the same category of data but with minor variations among data models reported in different documents, or when categories were in different languages. Each of the code groups (e.g. ‘language’, see Figure 1) gathers together similar categorical codes (e.g. ‘mother tongue’, ‘native language’, ‘communication language’). Values of categories were coded with the category name added as metadata in the code name and an additional meta-code. For example, for the category ‘nationality’ we coded values that can be assigned, such as ‘Belgian’ as ‘nationality: Belgian’.

An example of the technique for coding data. From top to bottom there are four levels, one for each type of element: document group, document, quote, code, code group.
Document grouping was meant to identify data models and their source as independent variables. As one system's data model might be spread over several separately collected documents, it was necessary to group those documents together (Figure 1). This approach allows co-occurrence analysis to take place between data models (i.e. document groups) and codes or code groups, in order to obtain the frequency of a category in a data model.
Figure 1 outlines the use of the data coding technique for a hypothetical information system. Moving from top to bottom, a document group gathers three different types of documents that describe a data model; these documents show the occurrences of the categories and values coded in vivo. Then, values are distinguished through metadata in the code and an additional meta-code. Finally, these categories and values are grouped in code groups.
Data analysis
After coding documents, categories and values, we conducted analyses comparing diverse data models. The analysis was informed by discourse analysis criteria, like the requirement to focus on absences as well as what was visible and present, which led us to create three analytical categories: presence, absence and frequency. By focusing on presence and absence, we aimed to address two questions:
Which category or value used in one system is also present in another system? Are some categories native or peculiar to a specific system?
By focusing on frequency, we aimed to address a third question:
In which systems do specific categories and values occur most frequently?
Our operationalization of the set of three questions was informed by graph theory, and used co-occurrence analysis and produced graph visualizations.
4
Such a combination of techniques has proven useful to visualize graph relationships and structures to help reason about complex networks (Hu and Nöllenburg, 2019). We decided to associate nodes with the data entities we coded as categories, documents and groups, whereas links correspond to relationships of presence between nodes. The entire set of nodes and links results in a co-occurrence network. Figure 2 shows the whole process in pseudocode and using the notations introduced in the Supplemental Material. Our own analysis is primarily interested in the presence, absence and frequency of code groups across document groups – corresponding to data models implemented by systems that may be spread over multiple documents.
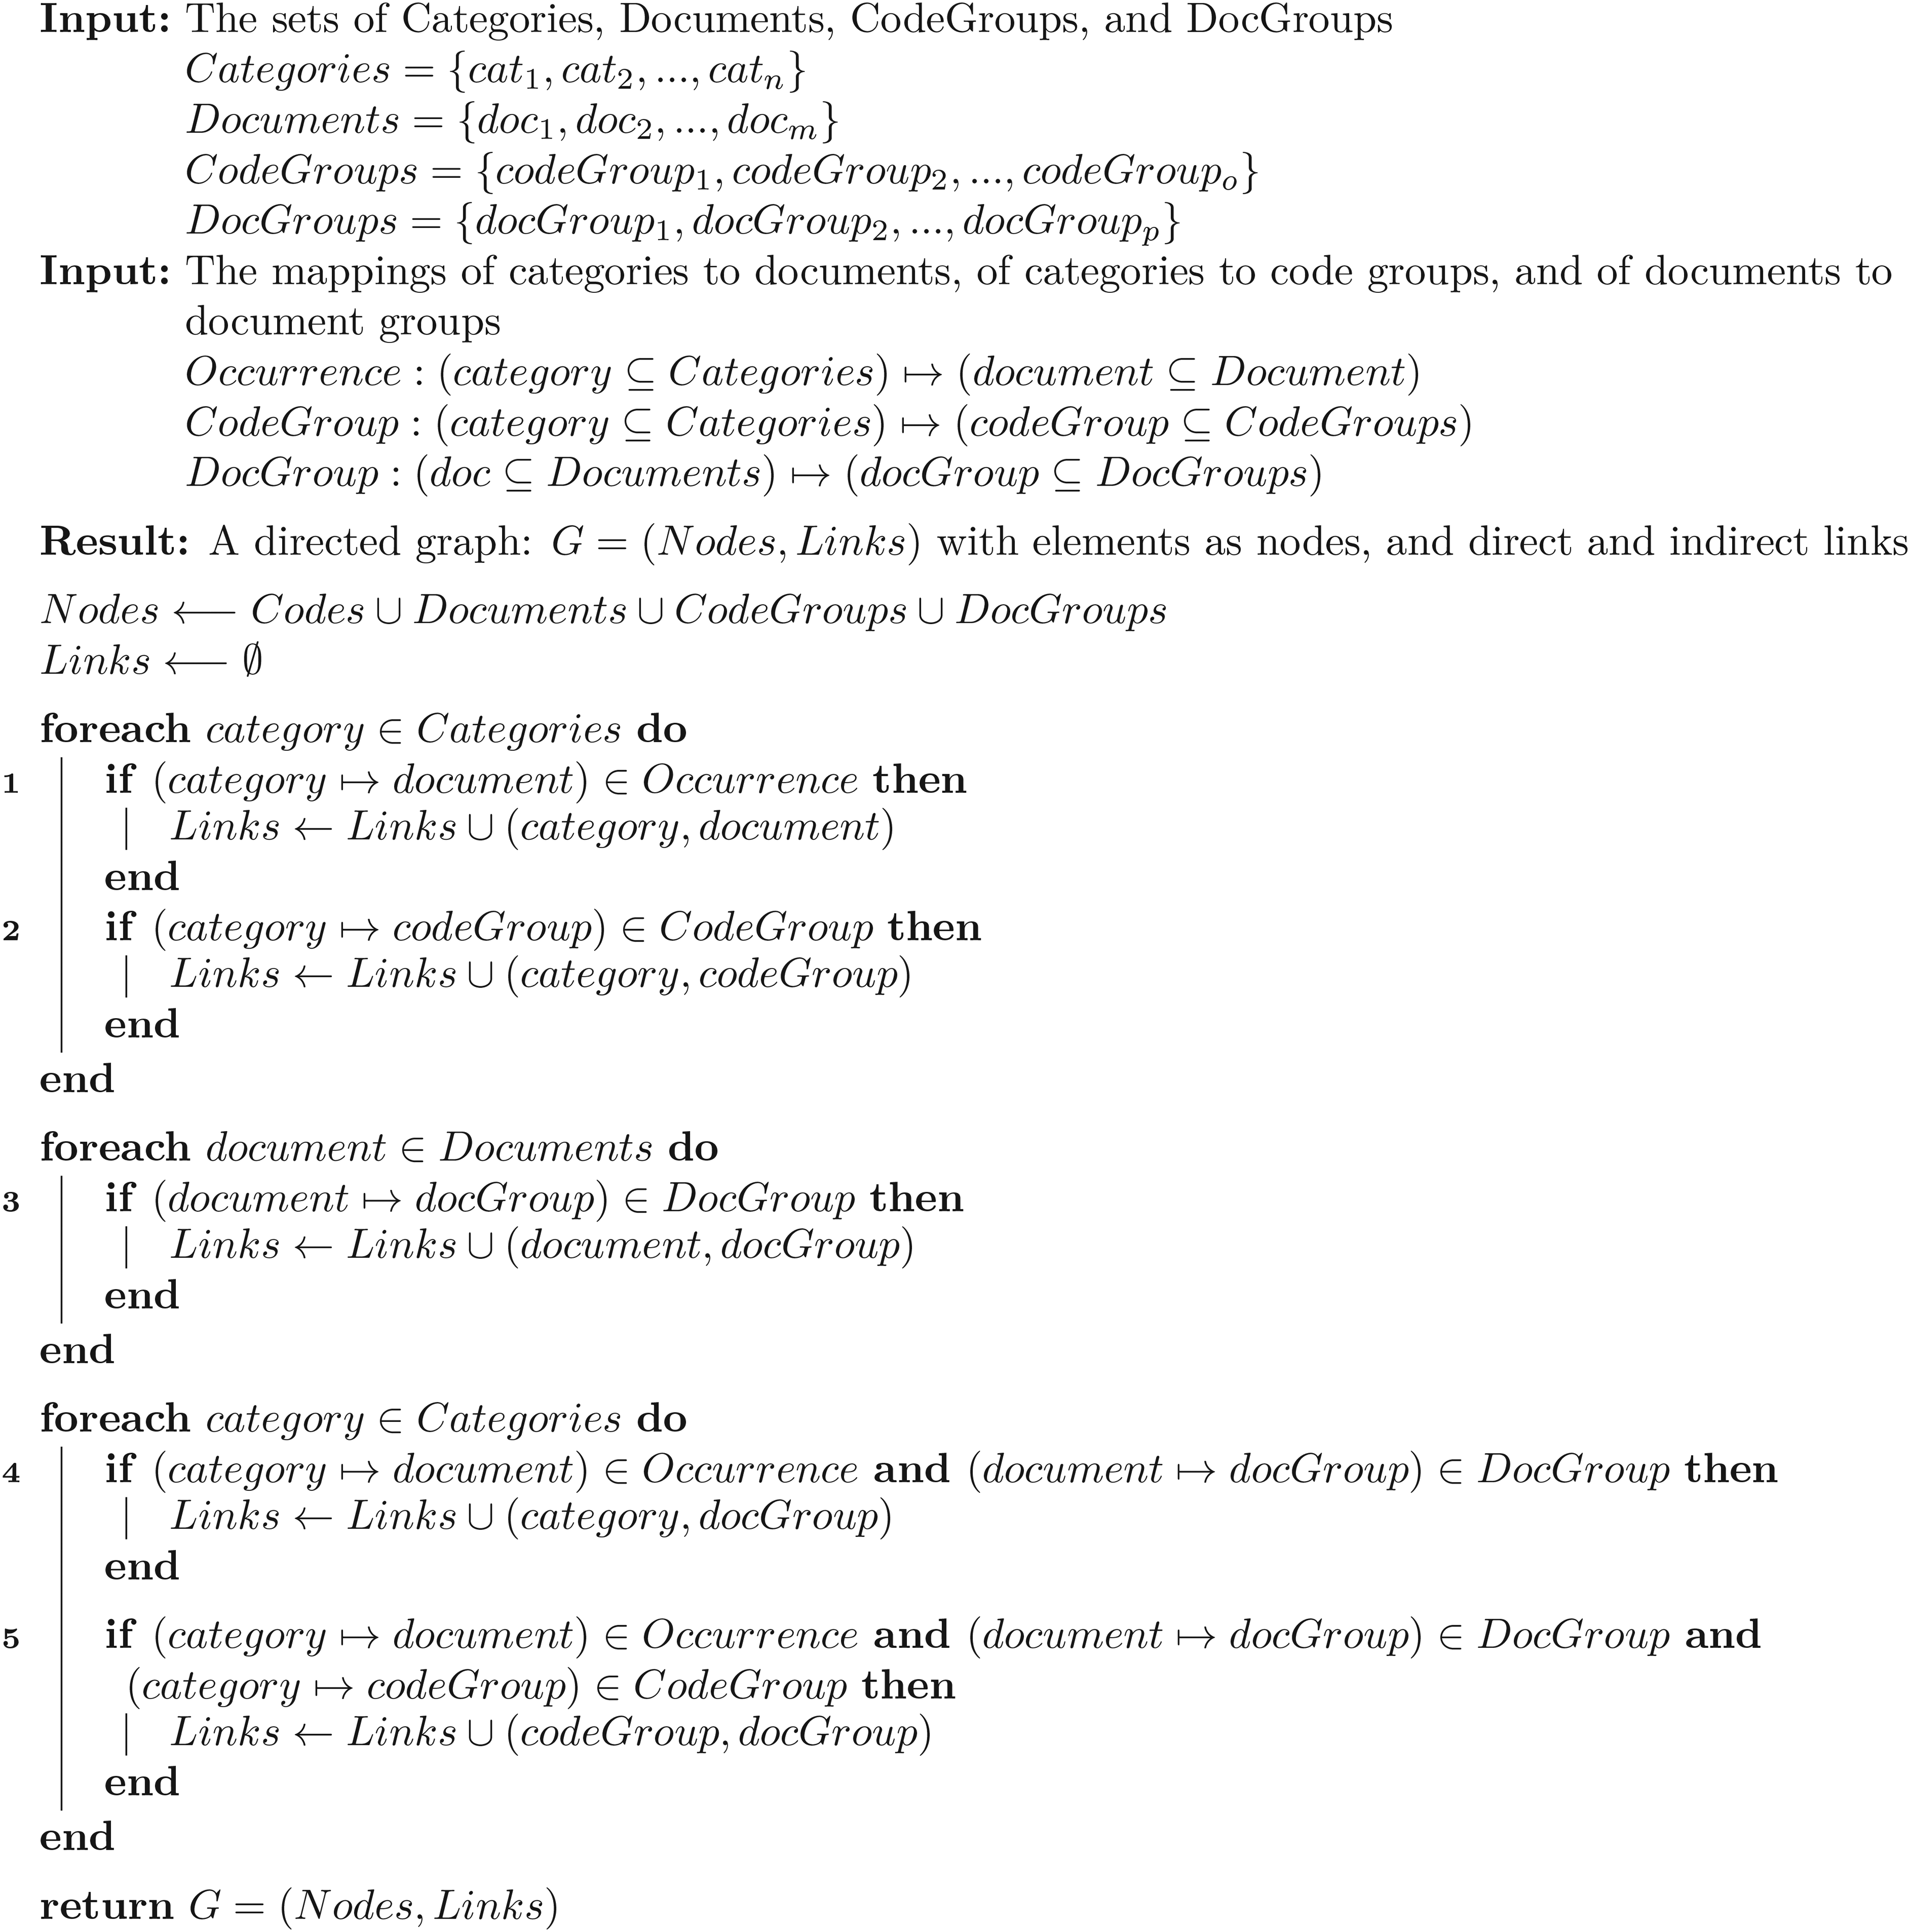
Pseudo code for creating the network and deriving direct and indirect occurrence relationships.
Indications of presence, absence and frequency
In order to support a discursive analysis approach – in particular, using comparison to trace invisibilities and absences, we analysed subgraphs using set and graph theory to compute insights about presence/absence. In set and graph theory, union refers to the overall set that includes items from two separate sets. For example, the union of the separate sets {‘first name’, ‘surname’, ‘age’} and {‘surname’, ‘age’, ‘nationality’} is the set {‘first name’, ‘surname’, ‘age’, ‘nationality’}. As well as union, other operators from set theory such as intersection and difference can also support a discourse analysis approach. The intersection of two sets is a set containing only elements that are part of both sets. So, the resulting intersection set from the previous example would be {‘surname’, ‘age’}. A set difference shows the elements that are in one set but not the other. Using the operations from set theory on our graph model enabled us to analyse complex relationships between the presence and absence of categories among different data models (Figure 3). 5
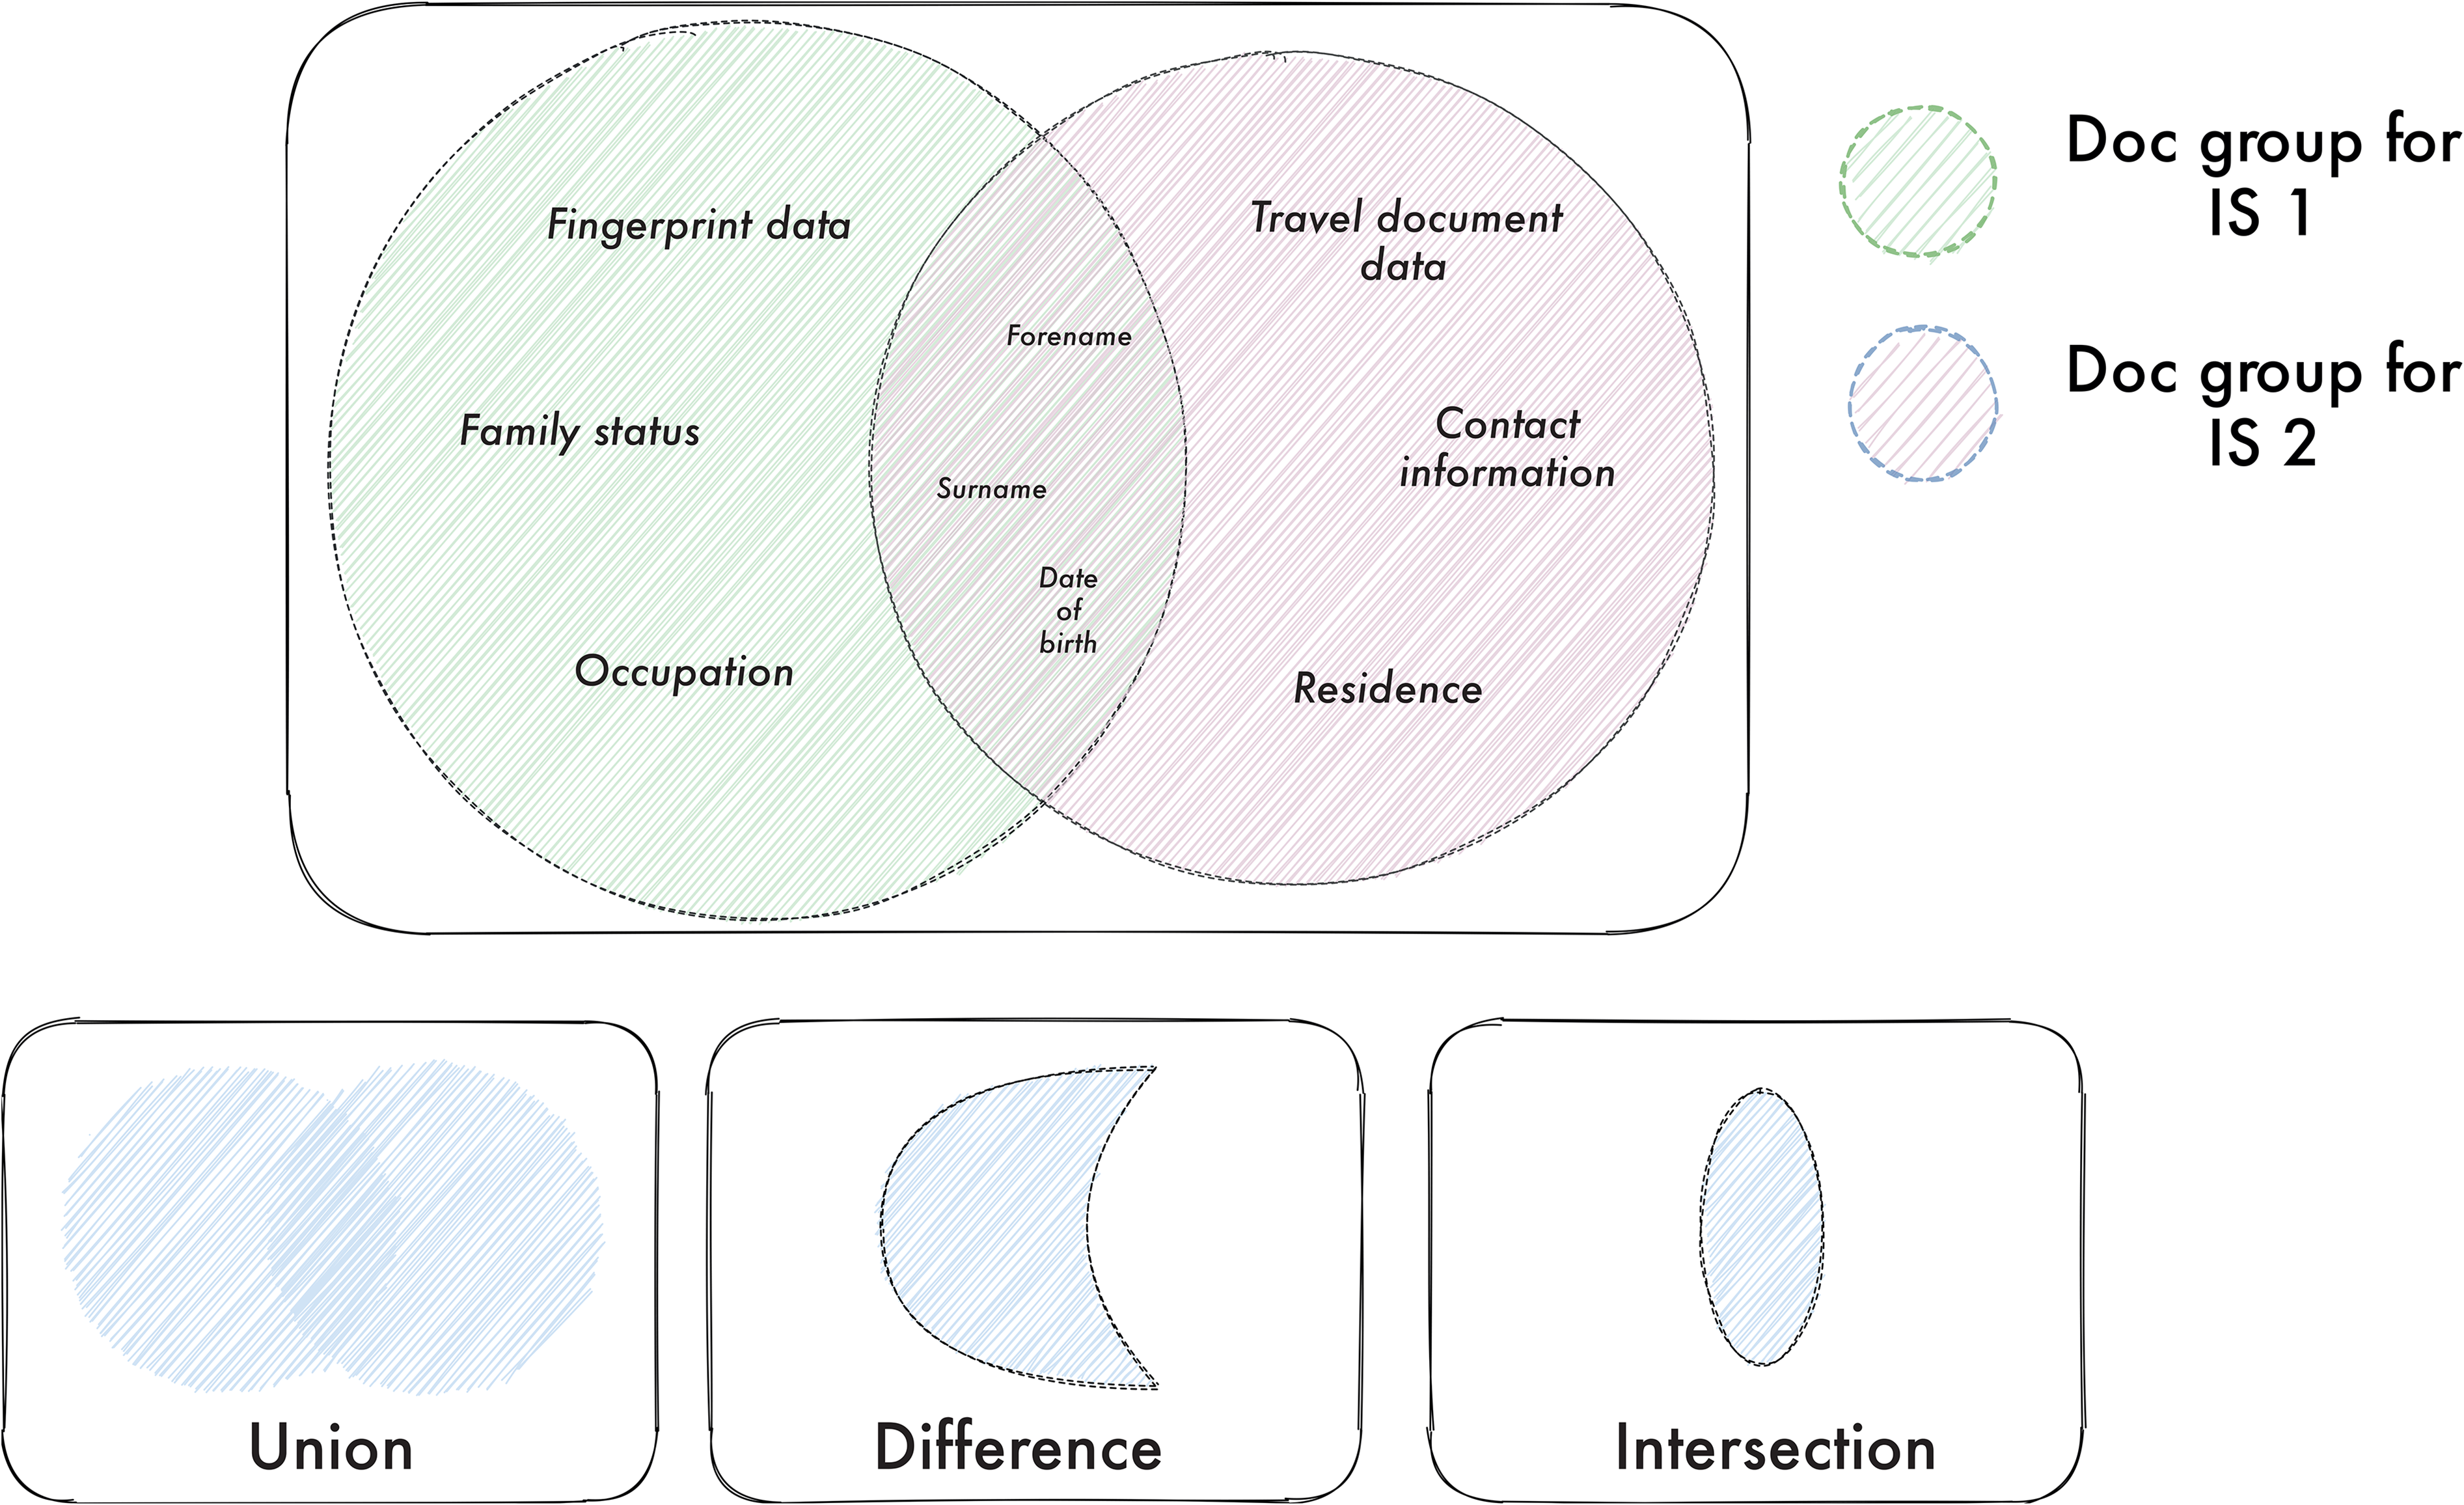
The different set operations.
Transforming data originally coded for qualitative analysis by means of CAQDAS to a co-occurrence network enabled us to further visualize relations of presence, absence and frequency using special layout algorithms. 6 Techniques developed for graph visualization helped us to make qualitative observations about relationships and structures in the network. However, such observations became more difficult with larger networks so, for this reason, we needed additional measures to quantitatively express indications of significant nodes, groups of nodes or network structures (Hu and Nöllenburg, 2019; Newman, 2018).
A class of visualization algorithms commonly used for co-occurrence networks are force-directed graph drawing algorithms. These kinds of algorithms use models from physics to metaphorically represent density of connection (Hu and Nöllenburg, 2019). The position of nodes in the drawing space is determined by forces of attraction and repulsion between these nodes. In this way, nodes occurring more often together are visualized as closer, while nodes occurring less frequently together are visualized as more distant. Such a spatialized visualization is known to help comprehend data (Kitchin and Dodge, 2011: 257–258). In our case, the generated spatial structure made it possible to visually analyse presence, absence and frequency of categories in the co-occurrence network.
This metaphorical spatial representation is expressed numerically through the measures of centrality to identify the most important nodes according to a definition of importance (Newman, 2018). Two centrality measures that are useful to develop indications of categorical frequency are degree centrality and betweenness centrality. Degree centrality is a straightforward indicator that measures the importance of a node based on the number of links. A high degree centrality of nodes for code groups can indicate that these categories are used often by multiple systems, whereas a low degree centrality can indicate that a category is particular to a system. Betweenness centrality bases the importance of a node on the number of times it can be considered to form a bridge and potentially connect parts of the network. For example, in Figure 4, the node ‘date of birth’ can serve as a bridge of the path from the node ‘surname’ in one system to the node ‘nationality’ in another system. In this way, these centrality measures allow us to find indications of important categories even if the network becomes too complex to analyse visually.
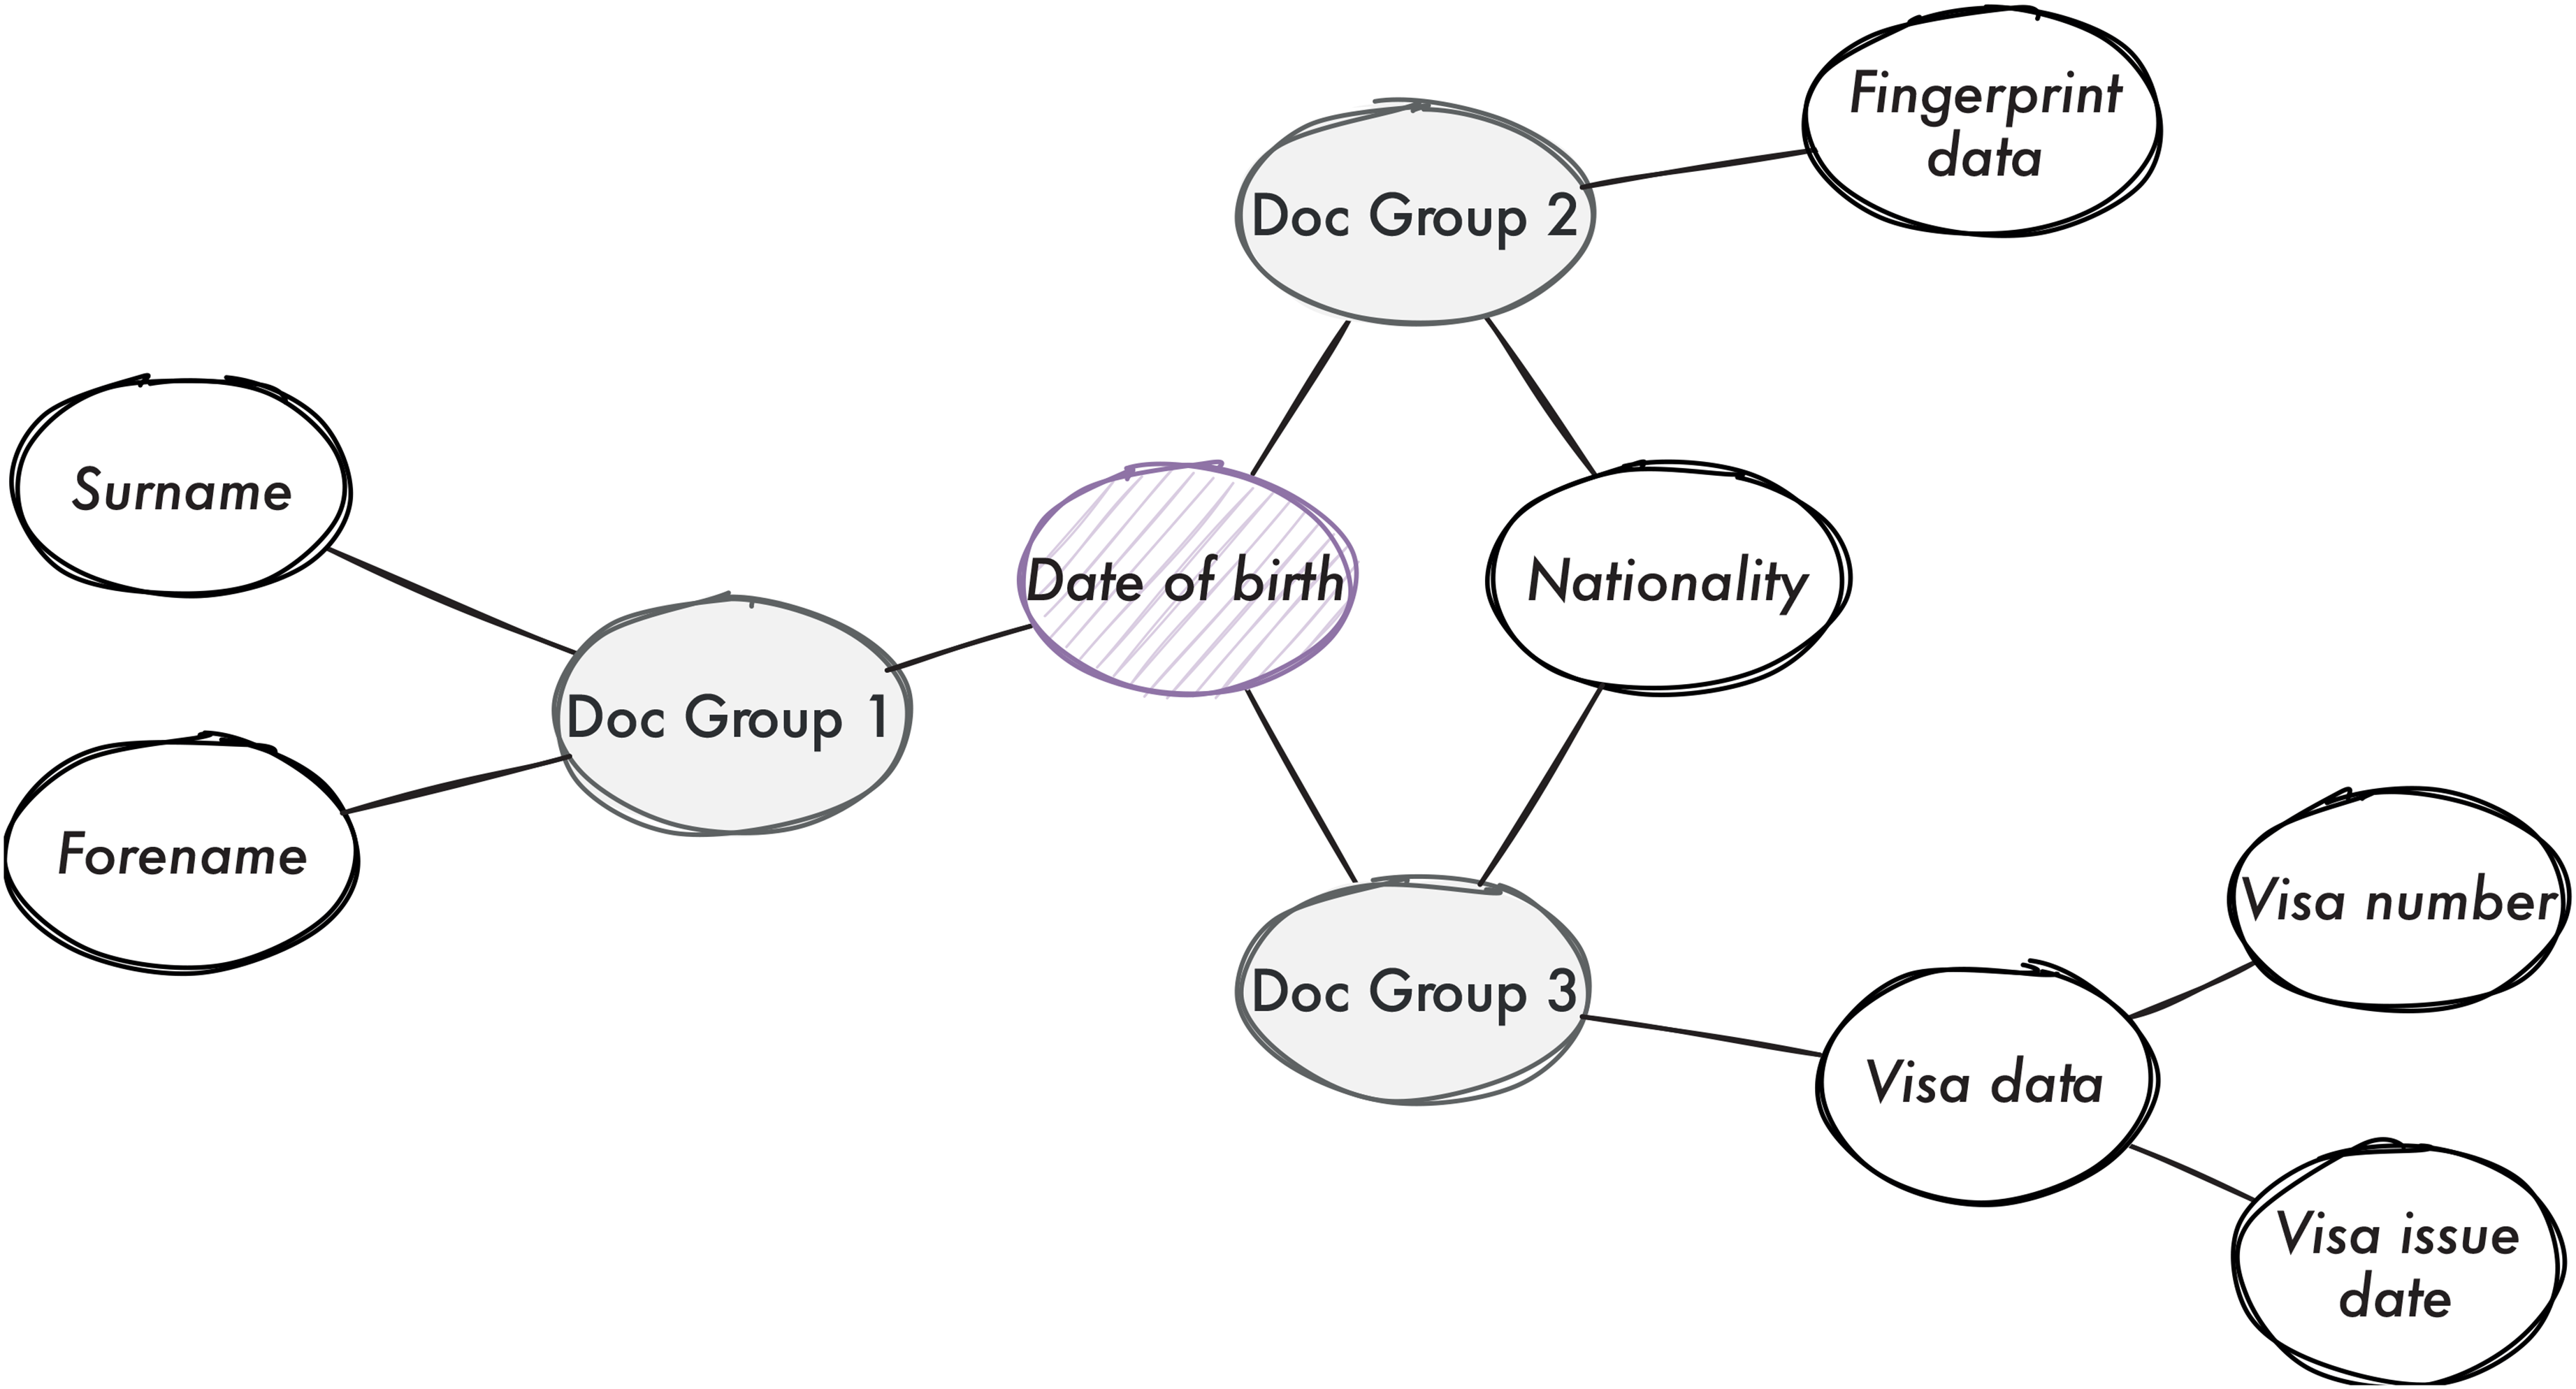
Network of categories. The node for the category ‘date of birth’ will have a different centrality measures depending on if it is determined by degree or betweenness centrality.
In the next section, we illustrate the actual functioning of the method by analysing some data models of information systems for border management.
Illustrating potential uses: Information systems for population management at the European border
To illustrate and thus validate the use of the OE, this section provides a comparative analysis of data models utilized in national and international information systems for population management, which jointly work to support registration and identification practices at border zones in Europe.
Data collection
The data models used to design the method and tool proposed in this paper were selected to answer the questions featured in section ‘Data analysis’, which in turn were informed by our three principles:
Is a category or value used in one system also present in another system? In the context of population management, this question is intended to highlight the differences and absences between systems run by different authorities, and therefore their diverse scripts, expectations and imaginaries about populations. Are some categories native or peculiar to a specific system? This question intended to identify categories belonging to a specific system in order to distinguish its mission. In which systems do specific categories and values occur more frequently? With this question, we aimed to identify which categories are used most in a range of different databases (e.g. national and international databases).
Data models were collected during fieldwork conducted as part of the Processing Citizenship project (2017–2023) at border zones in Europe.
7
Data collection included desk research of European regulations, technical documents made available by European and national authorities, and systems screenshots collected at border zones in the Hellenic Republic from March to September 2018.
The comparison included three information systems developed by European Commission agencies: the European Asylum Dactyloscopy Database (Eurodac), the second generation Schengen Information System (SIS II), and the Visa Information System (VIS). All three systems have specific aims to support policing tasks related to undocumented migration, and cross-border crime and travel. Eurodac was established in 2003 to store fingerprints and other basic data of asylum seekers, and thus helps to identify asylum seekers this way, as well as by determining the Member State responsible for processing their asylum applications under the Dublin System. 8 SIS II aims to support external border control and law enforcement cooperation within the European Union. It stores alerts that contain information on people and objects, and information/instructions on what to do when they encounter these people or objects. This information can then be exchanged between law and border enforcement authorities of EU countries through the SIRENE cooperation network of national bureaus. Finally, VIS is a visa data exchange (including personal data and biometrics) that supports a common EU visa policy. VIS data checks are done via identification procedures at borders, and the data gathered in VIS can also be used by asylum authorities to determine which EU Member State is responsible for assessing the asylum application.
When looking at national systems, we compared the Hellenic Register of Foreigners (HRF) and the German Register of Foreigners (GRF). The HRF is the main system used at border zones in Greece to identify and register the arrival of foreign nationals. The system is used to support different tasks during the identification and asylum procedures: retrieving migrants’ biographic and biometric data, conducting screening and asylum interviews and assessing health conditions. Users of the systems are, therefore, wide ranging, including police, administrative personnel and asylum officers.
The GRF contains a large amount of personal information on foreigners in Germany who have or have had a residence permit, as well as those who seek or have sought asylum, or are recognized asylum seekers (BVA, n.d.). This central register is accessed by various partner authorities and organizations in fields such as asylum, migration and border control. The data sent to the GRF during the first registration is described in the XAusländer standard, a data exchange format that formalizes and enables data exchange between German immigration authorities (BAMF, n.d.). According to the description of the standard's motivation, it aims to facilitate exchange of such data between authorities in Germany in order to reduce data re-entry and to enable data reuse.
Data coding
Categories and values were coded using in vivo coding; in the case of data models for migration and population management, categories included ‘country of origin’, ‘profession’ and ‘family name’. We also coded category values, which are possible states associated with a category: ‘flight attendant’, ‘teacher’, ‘chef’ are all possible values of the category ‘profession’.
Code harmonization made it possible to group codes that refer to similar categories of data across different documents. Each such code group (e.g. ‘language’) gathers together similar categorical codes (e.g. ‘mother tongue’, ‘native language’, ‘communication language’). This step allowed us to compare which types of categories of data are present and absent within each system.
Document grouping was also needed to run co-occurrence analyses for authorities in order to obtain the presence, absence and frequency of categories. For example, the data models implemented by the HRF were collected via multiple screenshots and interviews. Being images, each screenshot constitutes a separate document. Therefore, grouping the individual screenshot documents and the interview transcriptions in one document group allowed us to view the whole data model as one unit of analysis.
Application
To test the OE method, we adopted two research questions that were crucial to the Processing Citizenship's project. 9 First, how does a diverse range of national and European authorities differ in their expectations and imaginaries about migrants? Second, what elements do such varying scripts share? These two questions addressed the need to account for different ways of enacting migrants’ identities on different scales, despite the European Commission's effort to harmonize migration management. The hypothesis leading to the first question assumes that obstacles in the standardization of migration management can depend on diverse expectations and imaginaries about border crossers and populations at large. The second question hypothesizes that, among categories that are common among authorities, there are some categories that may have the potential to connect identities across systems.
To answer these research questions, we operationalized the method in two ways. First, by using the analytical tools of presence and absence. Second, by using the analytical tools of frequency and centrality. In order to operationalize the first question, we identified authorities and their systems as the independent variable. Consequently, the original question was more operationally rephrased as which groups of categories (code groups) are present in some systems and related data models, but not in others? As specified in sections ‘Review of methodological approaches’ and ‘Design principles of the OE as a methodology: Script, comparison and resistance’, this rephrasing assumes one of the basic methodological intuitions of discourse analyses, namely the need to pay attention to what is discarded.
Figure 5 and Table 1 summarize the results of operationalizing the two questions. 10 The visualization of the network provides an overview of the characteristics of the different data models and their categories of data (see Figure 5). At the edges of the network are categories particular to each authority. Between the nodes representing the authorities are categories that are present in both data models. Finally, in the centre of the visualization are categories shared by all three authorities.

A visualization of the network of categories present for the three authorities. Colour coding is used to highlight some of the characteristics of the network.
Presence of code groups for EU (Eurodac, SIS, VIS), Greek (HRF), German (GRF), and their relative degree and betweenness centrality.
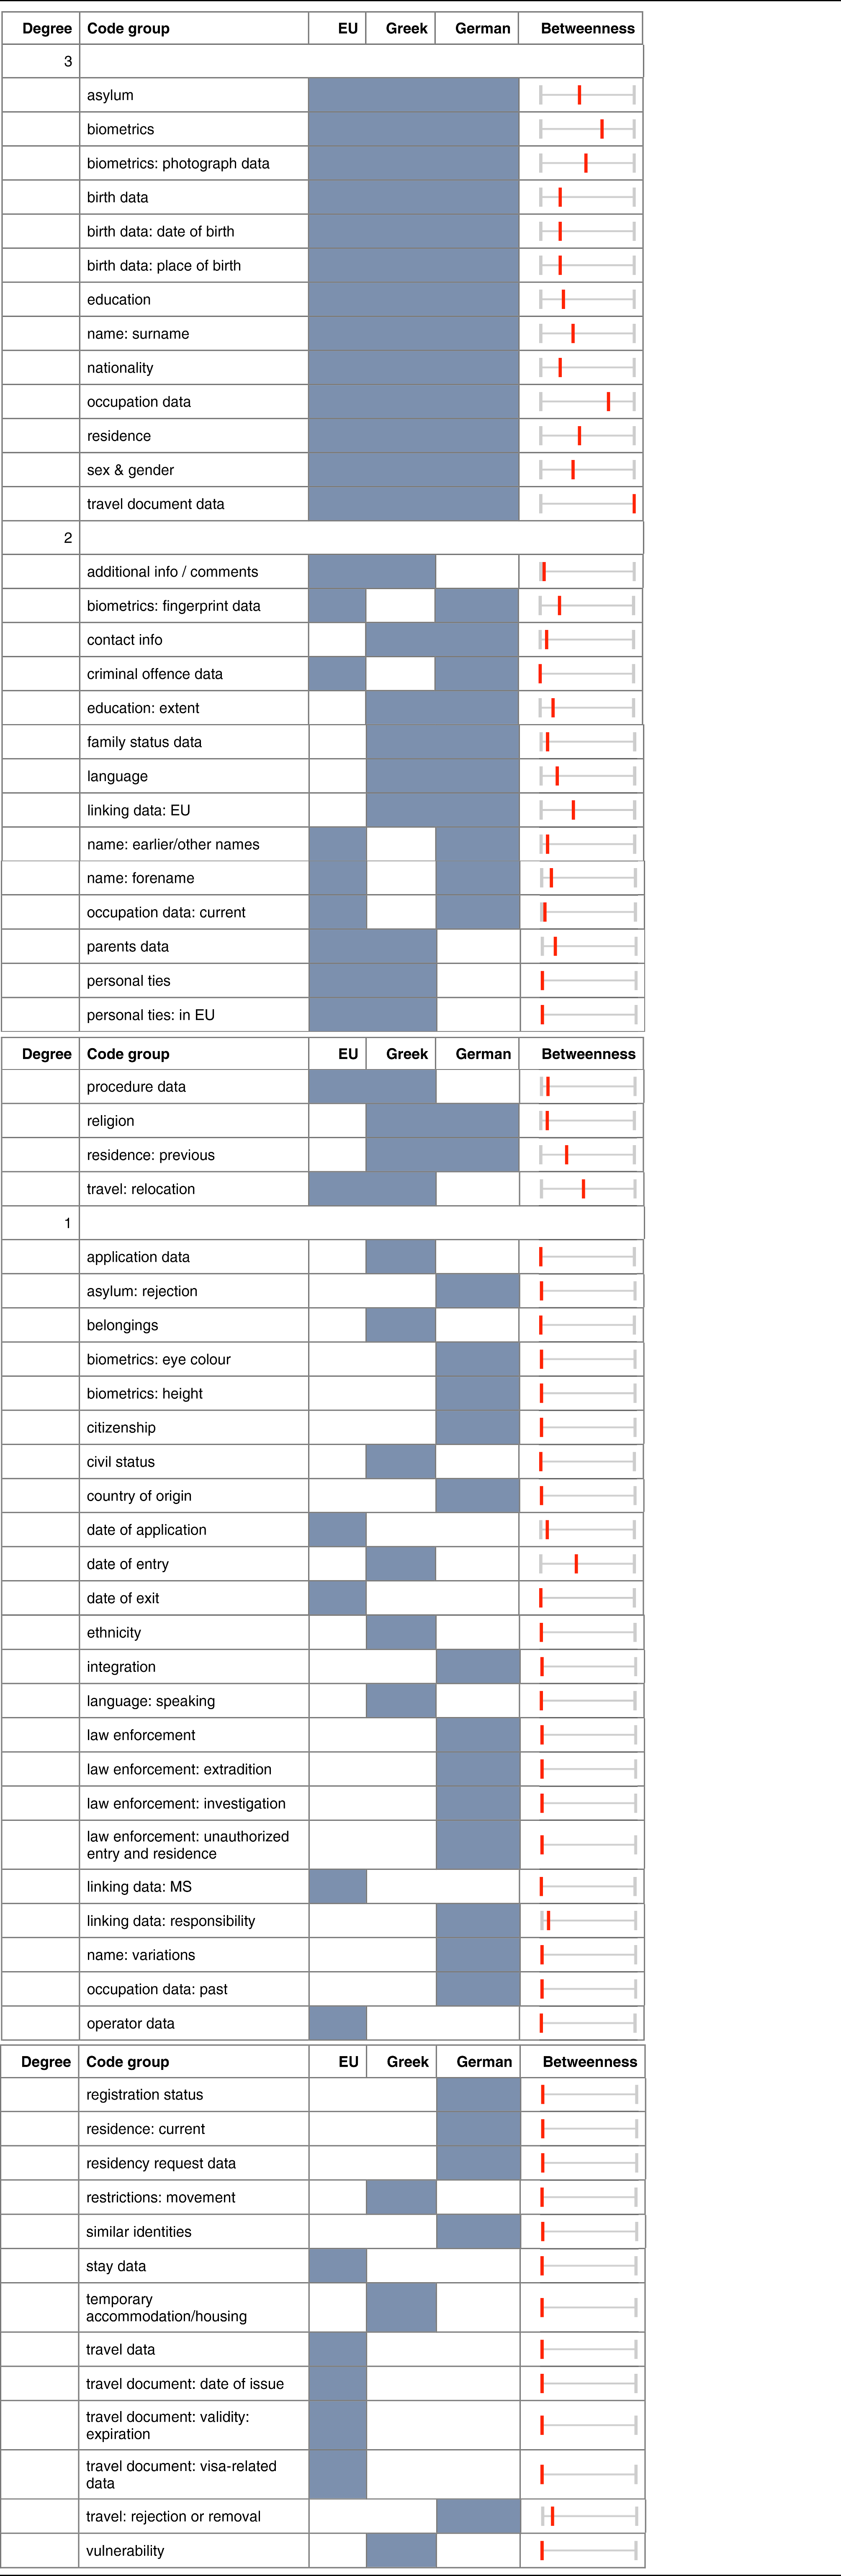


In Table 1, each row corresponds to a code group, while the columns for the three authorities indicate if the code group is present (blue) or absent (void) in the authorities’ data models. The EU column is based on a combination of the Eurodac, SIS II and VIS data models. The Greek column refers to the HRF and the German column to the GRF. Rows are categorized according to the code group's overall frequency in all selected systems. Categories of common data are therefore at the top of the table and include, among others, ‘nationality’, ‘surname’, ‘date of birth’ and ‘sex’. At the bottom of the table are more specific categories and code groups such as data related to integration or law enforcement, which only appear in a few systems. This table indeed allows us to see which categories are absent in some systems, like data related to language spoken or civil status.
The second research question can be operationalized through measures of centrality. The outcome of computing the betweenness centrality measure can be found in the last column of Table 1, while degree centrality (frequency) is shown in the first column. The numbers computed through the betweenness measure are represented in this table as a line range to show their relative centrality. For example, categories common to all three authorities such as ‘nationality’, ‘surname’, ‘date of birth’ and ‘sex’ show differences in their betweenness centrality. This is explained by the fact that while some categories occur frequently, the nodes for these categories may be more or less important in connecting different parts of the network.
Discussion
One of the main goals of the OE was to allow the systematic comparison of diverse information systems, also by harmonizing non-homogeneous data formats. The coding scheme we developed successfully allowed us to compare diverse data model formats, even when developed by different organizations for different purposes, and in different formats and languages. In this way, the homogeneous comparison of data models (Table 1) makes visible which categories are required by one authority and not by another. For example, we observed that only national systems collect data such as ‘ethnicity’, ‘language’, ‘temporary accommodation’. Through the coding schemes it is also possible to see that not all authorities employ the same granularity. This is true, for example, of categories related to names such as ‘name: earlier/other names’ which do not appear in the HRF. The method also allows values to be compared and thus enables differences in the granularity of values (e.g. category ‘education level’) to be seen. We observed, for example, that the German data model is much more specific than the Hellenic model for categories such as ‘education level’ or ‘marital status’.
The analysis can, for this reason, uncover the scripts, possibilities and limitations, and thus the imaginaries of diverse authorities about people on the move. The example analyses show how national and European authorities differ in their scripts about migrants. Authorities can differ in the type and granularity of the data they collect, and in the amount of control the systems allow in adapting for local circumstances. These differences can help to further analyse how, for example, migrants are enacted as persons in need of integration (a category only included in the GRF, see also Pelizza and Van Rossem (under review)), or how their family relations are enacted – the HRF seems to focus on parents’ data; the GRF family data can include children, parents, spouse, life partners. At the same time, there are also constants in how authorities enact migrants. Yet, despite these constants, measures of centrality reveal that some categories (such as ‘date of birth’ and ‘nationality’) could be more important than others to connect identities registered in multiple systems.
Furthermore, the analysis can aid understanding of how forms of resistance and adaptation can be accounted for. For example, the HRF reports categories like ‘mother tongue’, ‘communication language’ and ‘languages (other)’. This last category suggests that the data model allows for some control for mismatching declarations, such as when the language of an applicant is not in the list of available languages. In the GRF we also observed the use of a particular data type for date of birth that may be incomplete; from our fieldwork experience, we know this may prevent frictional situations. When only a person's year of birth is known, officers might introduce inaccurate data by filling in a dummy day and month such as the first of January of that year. In general, the OE is tasked with providing a method and a tool to comparatively single out scripts about populations and their expected or intended identities. As Pelizza and Van Rossem (under review) have shown, people do not exert resistance in a vacuum but against the backdrop of these scripts. Script analysis can thus constitute the first analytical step to ethnographically uncover forms of resistance by diverse actors.
Finally, the method allows us to recognize some of the material properties of data models; for example, in the HRF data model, it is possible to connect different individuals via the category ‘members of the case’ and the use of internal identification numbers. We can also see how categories are arranged in relation to each other; for example, we can spot temporal alignments such as ‘date of application’ and ‘date of exit’, or alignments of the route a person has taken in categories such as ‘previous country of residence’ and ‘date of entry in Greece’. Such materialities enable and constrain how data can be created and used.
All in all, these illustrative analyses confirm that the method proposed complies to a satisfactory extent with the research goals and design principles. The analysis can give indications of where to focus our attention, but may need to be combined with further data to turn thin indications into thick descriptions; for example, by complementing the analysis of individual categories with fieldwork observations. There is one particular enlightening example: the table and visualization shows that HRF does not have actual fingerprint data as a category. Fieldwork observation has revealed that the system does not directly collect fingerprints, but it invokes a separate component to integrate with Eurodac (Pelizza and Van Rossem, 2021). We, therefore, decided to further group such categories of data that refer to other systems as ‘linking data’ in order to understand how the EU systems link to Member States’ systems or vice versa. Based on this analysis we observed that only the national systems in our comparison have links to systems of international organizations.
Conclusions
In this paper, we outlined a novel methodology that integrates a number of insights from early classification, infrastructure and script studies and extends their methods and analytical depth to account for contemporary data infrastructures. By so doing, we hope to trigger a systematic discussion on how to extend those early theoretical and epistemological insights at the semantic level to contemporary developments in digital methods and for data infrastructures for population management. To achieve this, we validated the OE method and tool in light of the features of existing methods, as shown in the section ‘Review of methodological approaches’. As we have outlined, the OE is inspired by earlier research that aimed to make visible the otherwise inconspicuous work that informational representations, classifications and standards do in shaping and segmenting the world. The OE builds on this tradition and supports the analysis of differences and absences; it also provides quantitative comparative results that can inform further discourse analysis. Indeed, what makes our method distinct is that, by harmonizing non-homogeneous data formats, it systematically pursues comparisons of data models across diverse information systems. Such advanced comparison abilities make it possible to detect meaningful differences and absences in the scripts embedded in data models.
We illustrated this method in action by comparatively analysing data models used in information systems aimed at identifying and registering migrants arriving at the European border. This gives insights into, and allows comparison of, authorities’ expectations and imaginaries about populations that are assimilated into scripts. Two research questions guided this analysis to compare the enactments of migrants by different European authorities. Our first findings reveal there are both constants and differences in authorities’ assumptions about migrants, and show which possibilities are excluded by design. This provides a significant level of insight into the imaginaries and division of labour between authorities involved in population management. The findings thus showed the usefulness of our method of combining some of the most robust features of both discourse and network analysis.
Furthermore, the OE method provides the possibility to account for resistance. The results obtained through the OE can indeed constitute the first element of critical analyses when put together with ethnographic observations of the actual use of information systems. The discursive analysis of ‘thin’ data models can thus be used for detecting differences and absences between systems. The scripts found can be used at a later point to turn these indications into ‘thicker’ descriptions.
The method can also contribute to current debates around the intervention into the politics of data and data-driven forms of governance. Although current developments in digital sociology mostly draw on user-generated content, interventions into data also need to examine extant structures, such as the data models underlying the informational representations of various systems. Presenting the data models in ways that make them easier to comprehend could support experimental forms of participation and speculation that would enable a rethink of collected categories of data with actors that are otherwise only data subjects (Grommé and Ruppert, 2021). This is because the OE constitutes a method that goes back to the technicalities of information infrastructures rather than focusing on high-level textual contents.
All in all, the method presented in this paper shows that there is still plenty of potential for innovative methodological contributions towards the analysis of information systems’ data models. However, it is important to stress that caution must be taken when interpreting the results of the analyses. Following Venturini et al. (2021), we reflected on how the network and visualizations we created should not just show connected complexity but help us to understand the structures of networks. These authors rightly noted that ambiguities in network analysis and visualizations can actually be considered a strength, and we agree that this encourages further and deeper analysis into the ambiguity of empirical data. The method, therefore, can support a discursive analysis of information systems’ data models, but it is not specifically designed to give definitive answers. In this way, we see our strategy of assembling different methodological approaches and traditions as, what Marres and Gerlitz (2016) call, an ‘interface method’. With this concept, they urge paying close attention to the process of assembling different methods and how any tensions can, in fact, be productive. As with any other quali-quantitative analyses, care should be taken at each different step; especially the coding and code-grouping steps are crucial to obtain reliable results. The evidence obtained from the OE could be integrated with other observations, such as those from fieldwork.
Our future work on the OE will concentrate on applying the method to more in-depth and differentiated analyses of data models used by authorities responsible for border and migration control. More broadly, we also plan to further develop this method in other fields of application and expand the software tools so that they can serve as a base for future studies aiming to employ qualitative and quantitative methods for comparative analyses of data models.
Supplemental Material
sj-docx-1-bds-10.1177_20539517221104087 - Supplemental material for The ontology explorer: A method to make visible data infrastructures for population management
Supplemental material, sj-docx-1-bds-10.1177_20539517221104087 for The ontology explorer: A method to make visible data infrastructures for population management by Wouter Van Rossem and Annalisa Pelizza in Big Data & Society
Footnotes
Acknowledgements
The authors wish to thank researchers employed over the years as collaborators in the ‘Processing Citizenship. Digital registration of migrants as co-production of citizens, territory and Europe’ project: A. Bacchi, E. Frezouli, Y. Lausberg, C. Loschi, L. Olivieri, A. Pettrachin, S. Scheel. Given the matrix organization of such complex projects, some data used to test the method and tool were collected by them, while intellectual property rights are owned by the Hosting Institution. In no way can collectors be held responsible for the methodological proposal that is an object of this paper, nor for its writing. The authors are also indebted to the anonymous reviewers for their precious insights. Wouter Van Rossem is thankful to his PhD supervisors: Stefan Kuhlmann, Annalisa Pelizza and Maurice van Keulen. The article has also benefited from the various comments and questions we received when the work was presented at the 2019 ‘Data Power: global in/securities’ conference, at the ‘Digital technologies in policing and security’ panel at the 2020 EASST/4S joint conference, at the 2020 STS-MIGTEC circle event, at the ‘New Materialist Informatics 2021’ digital conference and at presentations with colleagues from the University of Twente and the University of Bologna.
Declaration of conflicting interests
The authors declared no potential conflicts of interest with respect to the research, authorship and/or publication of this article.
Funding
The authors disclosed receipt of the following financial support for the research, authorship and/or publication of this article: This work was supported by the “Processing Citizenship” project (2017-2022), which has received funding from the European Research Council (ERC) under the European Union's Horizon 2020 research and innovation program under grant agreement No 714463.
Supplemental material
Supplemental material for this article is available online.
Notes
References
Supplementary Material
Please find the following supplemental material available below.
For Open Access articles published under a Creative Commons License, all supplemental material carries the same license as the article it is associated with.
For non-Open Access articles published, all supplemental material carries a non-exclusive license, and permission requests for re-use of supplemental material or any part of supplemental material shall be sent directly to the copyright owner as specified in the copyright notice associated with the article.