
Abstract
Data about the accessibility of United States municipalities is infrastructure in the smart city. What is counted and how, reflects the sociotechnical imaginary (norms and values) of a time or place. In this paper we focus on features identified by people with disabilities as promoting or hindering safe pedestrian travel. We use a regionally stratified sample of 178 cities across the United States. The municipalities were scored on two factors: their open data practices (or lack thereof), and the degree to which they cataloged the environmental features that persons with disabilities deemed critical for safe movement through urban spaces. In contradiction to the dominating narrative of too much data and not enough analyses, we find that when it comes to data points that might be useful to persons with disabilities, data are lacking. This data gap has consequences both politically and materially—on one hand data could help enforce compliance with the Americans with Disabilities Act, on the other they would allow for safe route planning. We find that reading these data formats and collection patterns from the perspective of critical disability studies—particularly those whose work disrupts notions of “normal” —helps answer questions about potential benefits and harms of data practices. This lens has the potential to promote analysis that is as disruptive to injustices as it is practical.
Charles Santee spent over 10 years navigating cracked sidewalks and missing curb ramps in Sioux Falls (Smith, 2016). Local infrastructure was not only dangerous to navigate (tipping him out of his wheelchair on more than one occasion) but also not compliant with the Americans with Disabilities Act (ADA) which passed over 30 years ago. He submitted many complaints to the city of Sioux Falls and finally fed up with the city’s failure to act, Santee submitted a complaint to the Federal Highway Administration (FHA). The FHA complaint, supported by his years of experiences—itself a form of data, finally prompted the city to act.
Santee’s experience is not unique across the United States. As many as 40.7 million Americans report having a physical impairment 1 that makes everyday tasks difficult (US Census Bureau, 2018) and the majority (70 percent) reduce their travel as a result (Bureau of Transportation Statistics, 2018). This self-identified population 2 is more likely than the general population to be pedestrians or public transit users when they do travel (Bureau of Transportation Statistics, 2018). Wheelchair riders are significantly more likely than other pedestrians to be killed in traffic accidents (Kraemer and Benton, 2015; Poon, 2015). The underlying goal of the ADA was to eliminate barriers and discrimination in all areas of public life for people with disabilities (ADA National Network, 2021; US Department of Justice, 2021), and yet, these barriers persist. Thirty years after the landmark ADA legislation, pedestrians with disabilities still face barriers to safely accessing their communities.
The failure to comply with the ADA across US cities is an infrastructural injustice which perpetuates geographies of uneven access and exclusion 3 . Data gaps exacerbate the problem of access. For example, we have an abundance of transportation data made available through Google Maps and other routing applications, yet except for a few projects (e.g. Project Sidewalk, accessmap.io, Wheelmap) these applications overlook the unique needs of people with disabilities. While Google Maps has recently piloted an accessibility option for public transit, this project is limited in both imagination and reach 4 .
In this paper we focus on the lack of data on environmental features that promote independent living and safe travel for persons with disabilities. Specifically, we ask: to what extent do municipalities collect and maintain open data on environmental features that impact accessible travel for people with disabilities? Using this information, we probe why municipalities differ and the possible consequences of specific data regimes. We argue that analysis of what is missing or not counted in a world increasingly dependent on data is an important arena for critique and that critical disability studies provides an insightful lens for understanding this data missingness. This analysis of data ethics and infrastructure sheds light on the routine injustices that are embedded into the smart city as material and digital realities.
Data as infrastructure
Disability, infrastructure, imaginaries, and violence
Disability is political and relational. Kafer explains, “…the problem of disability no longer resides in the minds or bodies of individuals but in the built environments and social patterns that exclude and stigmatize particular kinds of bodies, minds, and ways of being” (2013: 6). While this sounds a lot like the social model of disability—that barriers in environments transform impairment into disability (World Health Organization, 2001) —the political/relational model asserts that “both impairment and disability are social” (Kafer, 2013: 7). This political and relational reality is often undergirded by the social construct of normal/abnormal bodies (Goggin et al., 2017; Shakespeare, 2007).
Historically, definitions of disability (based on what is considered normal or healthy) have lived in the field of medicine where they are inextricably linked with data. These data accelerate classification and sorting which in turn affect the lived realities of individuals (see Koopman, 2019a). Critical disability scholars have pointed to the myriad ways that the social, political, and physical intertwine to create material realities that harm disable people. “Built forms convey material rhetoric’s, which reveal cultural assignments of knowledge and power” (Hamraie, 2017: 1)
These slow violence’s are some of the tangible expressions of socio-technical imaginaries or “…collectively held, institutionally stabilized, and publicly performed visions of desirable futures, animated by shared understanding of forms of social life and social order attainable through and supportive of, advances in science and technology” (Jasanoff and Kim, 2015: 4). Sociotechnical imaginaries are about not only what is attainable but how the world “ought” to be. Imaginaries, expressed in infrastructure create uneven outcomes across populations. For example, a curb ramp might be absent from a street crossing because the planners overlooked or did not prioritize its creation and that absence makes travel dangerous for wheelchair riders.
Data and algorithms have been analyzed through the lens of the sociotechnical imaginary—particularly in relation to the “smart city” (Sadowski and Bendor, 2019; Williamson, 2015) but in more general ethics applications as well (Ananny, 2016; Beer, 2017; Crawford, 2012). The language of slow violence has not entered critiques of data and algorithms. Instead, conversations of injustice have focused on bias (and they have mostly focused on algorithms not data). This difference in language is in some cases unimportant but some of these so called “data biases” result in death or serious harms. In such cases, bias starts to sound like euphemism. For example, new software for automating hiring decisions overwhelmingly discriminates against disabled people by weeding out anyone with characteristics not found in the training data (Engler, 2019; Whittaker et al., 2019). Here missing data, combined with a push towards the behavioral mean, reduces a person’s ability to make a living. Autonomous vehicles have been found to not “see” wheelchair riders or pedestrians using other assistive technologies (Whittaker et al., 2019). These examples are not mere oversights or biases, but a form of slow violence 5 .
Koopman’s (2019a, 2019b) historical analysis of data formats, which were cemented in by routine and bureaucratic measurement decisions, runs parallel to scholarship on the temporalities and sociotechnical nature of infrastructure. For example, bureaucrats encoded the birth certificate in the United States with a gender binary which reflected a time, place, and standpoint (those bureaucrats were likely white men) (ibid). These gender categories have continued to shape both who we are (present) and who we might become (future) to the current day. That is, these formats, “preclude[d] what could have been other options” (Koopman, 2019a: 180). Or as Ocean Vuong (2020) writes, “I used to be a fag now I’m a checkbox”—acknowledging both the previous limitations of sexual orientation on demographic forms and the incompleteness that remains even with an increased range of checkboxes. These data formats or structures and imaginaries about what ought to be counted and how, “pin us down” to identifiers or identities we may not choose and “speed us up” by making things easier to find, analyze, and classify (Koopman, 2019a).
In Mimi Onuoha’s, visual art installation, The Library of Missing Datasets, she describes missing data as the “blank spots that exist in spaces that are otherwise data-saturated” (2020). She suggests that what we ignore reveals more than what we give attention to, and that these blank spots can illuminate subtle biases and indifferences. Why are data missing? Onuoha (2019) suggests four possibilities: (1) Those who have the resources to collect the data lack the incentive to do so (and possibly, have incentives not to); (2) the act of collection involves more work than the benefit the presence of data is perceived to give; (3) The data resist quantification; or (4) there are advantages to nonexistence.
Data infrastructure and formats embed ideas of desirability into both the present and future. As crip technoscientists have shown, these imaginaries do not benefit all equally and are often in need of disruption (Hamraie and Fritsch, 2019; Kafer, 2013). To probe such questions, we need the work of queer and disability scholars who are accustomed to interrogating “norms that were based on bodies, minds, or experiences unlike our own” (Kafer, 2013: 143). Particularly, regarding data which speeds up and pins down norms or socio-technical imaginaries, we need contestation and resistance to the infrastructures’ thrust to fix, quantify or box off possibility. This is a step into the arena of proliferation and regeneration—in line with the stubborn desire for change of Charles Santee in Sioux Falls. While this paper is about accessible infrastructure and the ADA, we aim to show that the work of disability scholars, particularly work that questions and disrupts norms, is integral to understanding and critiquing data as new infrastructure in the digital or smart city.
In the spirit of renegotiation and contestation, this paper does not come to a final destination. Rather, we foray - making a first attempt to look critically at data as infrastructure and missingness or neglect instead of surveillance. We pull from disability scholars in questioning things that are mundane or cemented in. Drawing from recent discussion on mapping/studying up (Huntley and Shelton, 2021) we turn our gaze to municipalities in the United States and their open data portals (rather than the potentially “marginalized” populations affected by these data practices).
With respect to our focus here on accessible transportation, a dearth of data on key safety features such as curb cuts, cross controls and cross walks has material consequences for the safe routing of persons with disabilities while also reducing the power of the ADA. This deficiency in transportation data persists despite rapid advances in similar areas. For example, high quality routing applications (for those without physical impairments) have become free and ubiquitous, leaving many of us worrying that our phones are starting to collect too much information about where we’ve been and where we’re going (see for example, Armstrong and Ruggles, 2006; Auxier et al., 2019; Beresford, 2006; Elwood and Leszczynski, 2011).
Most readers of this journal will associate negative outcomes with the term “surveillance,” but the word means care, guidance, and stewardship in addition to the more authoritarian oversight, regulation, and supervision (Merriam-Webster, Inc, 2021). The opposite of surveillance is carelessness, indifference, neglect, or ignorance. Critical data studies have focused less on analysis of careless, indifferent, neglectful, or ignorant data practices, and yet, in this paper we argue that their impacts can be just as pernicious. Specifically, within this transportation data deluge—which both helps us navigate and threatens our privacy—what are the barriers to collecting and creating tools around data that would expand the independence and safety of persons with disabilities in their urban travel?
We answer that question by looking at the relationship between legislation, municipal data practices, and the consequences for persons with disabilities. Specifically, we trace the history of the ADA and open data. We look at the open data practices of a regionally stratified sample of municipalities to reveal the interplay between “common sense” data priorities, political power, and routine injustices.
The ADA and data
The ADA of 1990 was landmark legislation and a great achievement for the disability rights movement. The ADA was influenced by the social model of disability—that barriers in the environment transform impairments into disabilities. Thus, ADA legislation aims to reduce barriers in employment (Title I), public accommodations and services (Titles II & III), and telecommunications (Title IV).
Title II of the ADA bans disability-based discrimination in state and local governments. This legislation comes with many guidelines for the accessibility of pedestrian right of ways including curb ramps, removal of obstructions, and safe road crossings. New accessible infrastructure standards were released in 2010 (Department of Justice, 2010). The regulations require that local governments: (1) perform a self-evaluation; (2) notify the public about ADA compliance; (3) designate an employee to carry out ADA responsibilities; (4) develop a procedure for resolving complaints; and (5) develop a transition plan for achieving ADA compliance.
Directly after the ADA’s passage, municipalities struggled to comply in order to avoid a $50,000-$100,000 fine (Mills, 1995). The Unfunded Mandate Reform Act of 1995 restricted the federal government’s enforcement ability and ADA compliance has since then largely been enforced by citizens through complaints and lawsuits (Dilger, 2020; Gwin, 2014).
The administrative requirements of Title II to perform a self-evaluation, inform the public, and develop a transition plan all require data and data sharing. While open data is only mandated at the federal level through the OPEN Government Data Act (passed January 14, 2019), many municipalities have followed suit with their own policies or initiatives (Wang and Lo, 2016). The term “open data” describes data that can be freely accessed, used, modified, and shared for any purpose (Attard et al., 2015). Open data are hyped as a rich source not only for innovation, but transparency and accountability, too (Arribas-Bel, 2014; Boulton et al., 2011; Gonzalez-Zapata and Heeks, 2015; Jetzek et al., 2014). Their value lies both in what they measure, and in what they ignore, giving citizens a metric for understanding their city’s priorities and indifferences (Levy and Johns, 2016; Martini, 2016). There are no established metadata standards for open data and few guidelines about what to include, making them a wild west of localized quantification (Kitchin, 2014). Limited public funding for technology and open data infrastructure has often resulted in data openness without context (Ruijer et al., 2018). These dumps of “zombie data” are accessible and open but without provenance, meaning, or purpose (D’Ignazio and Klein, 2020).
Municipal open data are not, of course, the only source of information about the accessibility of urban environments. A variety of grassroots efforts have made strides in collecting these data for the dual purposes of ADA compliance assessment and safe routing. These include: Project Sidewalk (Froehlich et al., 2019, 2020; Makeability Lab, 2021), Accessimap (Agence nationale de la recherche, 2021), the open maps accessibility project and associated accessibility parties (OpenStreetMap Wiki, 2020; OpenStreetMap Wiki, 2021), Accessmap.io (Taskar Center, 2021), and the mapping access project (Hamraie, 2018; Hamraie and Critical Design Lab, 2020). These projects are creative and have raised awareness on urban inaccessibility. They also rely on crowdsourcing and the work of academics. In this paper, we do not discount these efforts. However, we aim to critique the political and social conditions that have contributed to a widespread neglect of data on environmental accessibility at the national level.
There is a scarcity of systematic analyses of what data are missing and what the social consequences might be of that missingness. In the case of accessibility, the lack of information about transportation infrastructure not only impacts an individual’s ability to safely navigate, but also has implications for political power and legislative enforcement of the ADA. In the following pages we present our methodology and the results of our analysis. We then interpret those results through the lens of infrastructure and disability studies. We point to the sociotechnical nature of data and the slow violence that arises from data indifference or neglect.
Methods
The aim of this analysis was to identify the extent to which municipalities in the United States make data publicly available that represent environmental features that facilitate safe travel for people with disabilities. As a proxy for public availability, we analyzed open data portals across the United States. We then explored the completeness of these data against other urban characteristics to better understand the local conditions for data inclusion or absence.
Study area and data collection
We used a regionally stratified sample of open data portals across 178 United States municipalities to answer the question: to what extent do municipalities collect and maintain open data on environmental features that impact accessible travel for persons with disabilities? The sample of 178 municipalities is based on 2010 US Census population counts and includes: all municipalities with populations over 150,000, the 10 most populous municipalities for each census subregion, and the most populous municipality of each state (see figure 1).

Municipality sample.
Database scoring
Open data are data that are freely available to access, share, and use (Open Knowledge Foundation, 2020). Physical versions of data could also be open (such as newspaper archives on microfilm in a library), but these data are increasingly downloadable over the internet. To ascertain the presence of an open data portal, we conducted internet searches 6 from June 2019 to March 2020. Search terms included the municipality name and “open data,” “data,” or “gis.” If these search terms did not result in anything, we investigated the municipalities’ website for any information on data or transparency. Municipalities with no open data received a score of 0. We checked all municipalities with scores of 0 again at the end of the review period (April 2020), as some municipalities were in the process of developing a portal.
We reviewed municipalities with open data for their inclusion of geodata on 14 environmental features that are barriers to or facilitators of safe travel for people with disabilities. If a municipality had open data but did not include data on any of these features, they also received a score of 0. The list of features is based on a two-year empirical study by Lobben and Perdue (in progress, see Perdue, 2016) in which interviews, focus groups, and national surveys were conducted with participants across four impairment types: vision, hearing, electric wheelchair, and manual wheelchair. Table 1 combines Lobben and Perdue’s 14 environmental features (left column) with ADA standards (McNally 2011; Department of Justice 2010). We also collected data on the presence or absence of data on infrastructure and paths for cyclists due to an emergent observation about municipal prioritization of certain modes of transportation (i.e. cars, bikes).
Environmental data types for accessibility and ADA standards.

Many of these features were easy to find in the open databases. For example, geodata on street locations were found by searching for “street,” “centerline,” or “road” (see table 2). Street information was never embedded as a field in another dataset. However, information about the speed limit of streets was found in street datasets and on a few occasions as a field within a “sign” dataset. Two features were not as conceptually obvious—ground and overhead obstructions. Lobben and Perdue’s survey questions that determined the importance of these features for route planning can be found in Table 3. Based on these survey questions, we used various other features as proxies for ground and overhead obstructions after first searching for “obstruction” explicitly. At the time of our analysis, only one city, Washington, DC, had standalone “obstruction” layers. When open data portals included 200 or less datasets, we scanned the entire open data catalog to derive these patterns.
Search terms by feature.

These data were always found within another dataset.
Received 0.5 pt, would identify concrete.
Survey questions for obstruction features.

Data about municipalities came from the American Community Survey 2018 5-year estimates for census designated places. These data were used to answer the question of why some municipalities had better open data on accessibility features than others.
Analysis
The extent to which municipalities collected and maintained open data on accessibility features was straightforward to ascertain. Using the dataset that we created (see supplementary material) on the inclusion of features, we compiled descriptive measures. We also looked at the quartile distribution of scores for only those municipalities with scores of 1 or higher (n = 107).
The features that we looked for are not only useful to people with disabilities. In fact, safe and accessible travel is only a very ancillary benefit of many of these features (e.g. streets). To better understand trends in data collection we looked at total data score (out of 14) by inclusion of features. This helped us understand some of the trends in open data completeness and feature inclusion. For example, we were able to answer questions such as, “if a municipality only has one dataset of interest, what is it likely to be?”
We then looked at Pearson correlations between variables. Since the variables are all binary, these are just rates of overlap, but they allowed us to see trends in kinds of data that municipalities included. This was particularly useful for understanding the presence of rare data. It allowed us to answer questions related to grouping such as, “if a municipality has data on curb ramps, how likely are they to have data on cross controls?”
Finally, we did an examination of municipal characteristics and accessible open data score. The purpose of this analysis was to better understand what, if anything, set municipalities with higher scores apart. In exploratory analysis we looked at a variety of municipal characteristics including median age, poverty rate, disability rate, housing insecurity, median income, population size, latitude, and longitude. We also explored spatial correlations. Exploratory analysis suggested that median income, population size, latitude, and longitude 7 had the strongest relationship with score.
To understand how median income, population size, latitude, and longitude together predict municipality open data score, we ran a basic linear regression with municipality score as the dependent variable. We then visualized the outliers based on regression residuals and standard deviation of the residuals. The residual is the difference between the actual and predicted value. We defined outliers as all municipalities with residuals at least 1 standard deviation above or below the actual value.
Results
The results reported here include both the entire municipality sample (n = 178) and the municipalities with an open data portal and at least one accessibility feature (n = 107). Tables 4 to 6 and Figure 2 cover the more limited sample because we were looking at trends in those municipalities with data open and online. Tables 7 to 9 and Figure 3 cover the entire sample to capture the relationships between municipality characteristics and score. In this case, municipalities with no data are meaningful.

Municipality score by feature inclusion.

Municipality sample (cities with scores greater than 6 are labeled).
Quartiles of municipality scores (n = 107).

Feature inclusion rate (n = 107).

Feature inclusion rate (%) by score.

Pearson correlations (n = 178).

Included where meaningful, not for binary measures.
Linear regression results (n = 178).
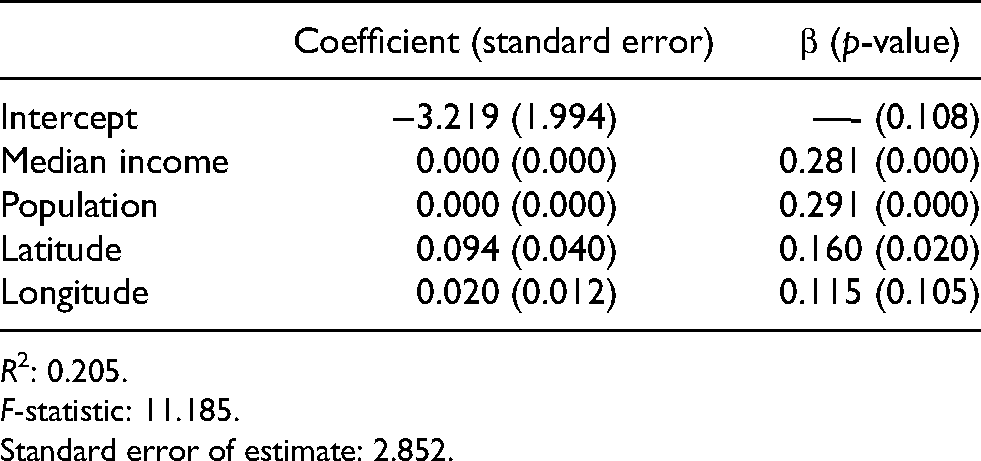
R2: 0.205.
F-statistic: 11.185.
Standard error of estimate: 2.852.
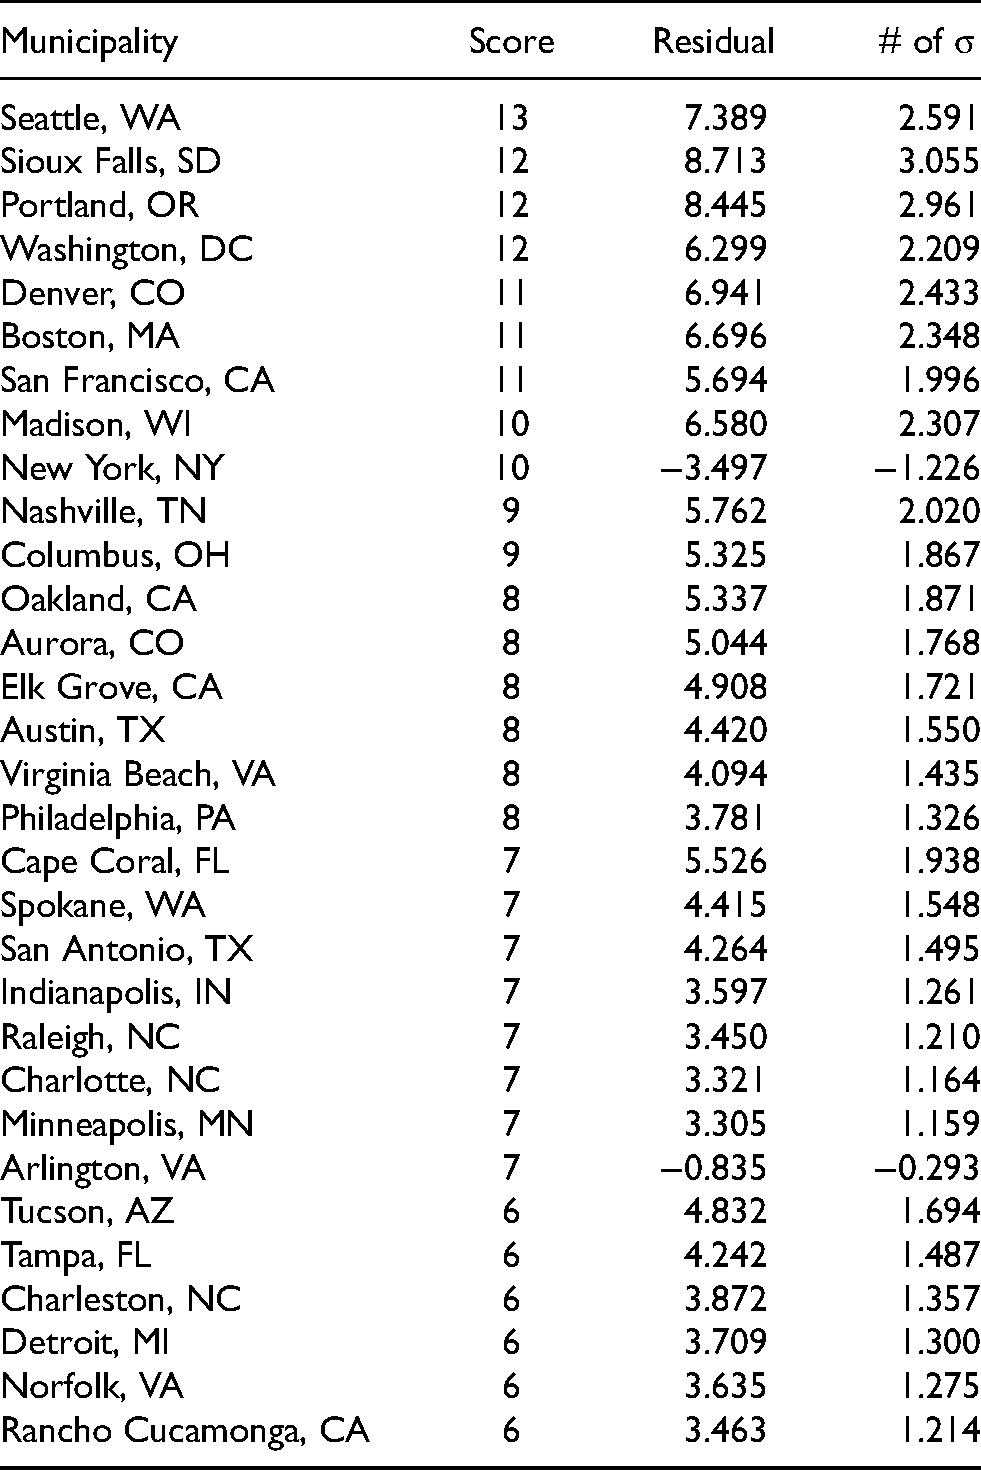
Regression residuals for municipalities with scores of 6 or more.
Data inclusion
Just under 78 percent of the 178 municipalities sampled had an open data portal (138 total). Among these, 107 municipalities had information on at least one of the features we were looking for (77.5 percent). Half of those municipalities had data on 3 or fewer features and only the top quartile had more than half of the 14 features (23 municipalities had 7 or more, see table 4).
Ninety percent of municipalities with information on at least one accessibility feature had spatial information about streets (see table 5). Just more than half had information about the speed limit on streets (53%), followed by slope (44%), overhead obstructions (37%), number of lanes in streets (36%), sidewalks (34%), ground obstructions (30%), crosswalks (19%), sidewalk condition (18%), curb ramps (17%), cross controls (17%), sidewalk material (14%), flashing beacon cross controls (14%) and audible cross controls (7%) 8 .
Looking at municipality score by inclusion of data, we found street information in most municipalities with scores under 5 (see Table 6 and Figure 2). Sixty-seven percent of the municipalities with a score of 1 have street information, 92 percent of those with 2, all of those with 3, 85 percent of those with 4, and 86 percent of those with a score of 5 (see Table 6). Only among those with 8 or more features, do features other than streets appear in equal proportions. For those municipalities, there are an even number with information on streets, speed limit, and slope (6 municipalities, see Figure 2). For scores higher than 8, there are almost equal numbers of municipalities with each feature and few municipalities had those scores (see N in Table 6). Information on curb ramps, an important part of ADA design requirements, is only found in one municipality with a score of 4 (Los Angeles) and this information is incomplete and only includes ramps installed in 2014. Otherwise, curb ramp information was only included in municipalities with scores of 7 or higher. Notably, the most common feature with clear application to ADA compliance is crosswalks or sidewalk condition (see table 1), both found in less than 20 percent of municipalities with information on any feature of interest
Patterns and relationships
There are significant Pearson correlations between inclusion of feature information and score (see table 7). For example, audible cross controls are a descriptive field within a cross control dataset so there is a strong correlation between the two (0.904). There are also correlations between less-related features. For example, between data on curb ramps and cross walks (0.648) and curb ramps and sidewalks (0.527). The strongest feature correlation with score is between score and sidewalks (0.750), meaning municipalities with more accessibility features (higher score) were more likely to include sidewalks.
There are also relationships between characteristics of municipalities and score. There is a significant positive relationship between score and median income (0.281, p < 0.001), population size (0.310, p < 0.001), and latitude (0.185, p < 0.05). Northern cities tend to have higher scores (see Figure 3). While disability rate is correlated with income (−0.586, p < 0.001) and latitude (0.176, p < 0.05), there is no correlation with score. There is a significant negative correlation between disability and inclusion of information about curb cuts, albeit at a higher p-value (−0.132, p < 0.1). Given other correlations, this relationship is likely spurious.
Next, we ran a linear regression to understand how municipality characteristics come together to predict score. Fitted to a linear regression, median income, population size, latitude, and longitude predict about 21% of the variation in score (see Table 8). The coefficients for median income, population, and latitude follow the same patterns observed in the Pearson correlations. Municipalities with higher median income and larger populations tended to have higher scores.
Notably, every city with a score over 6 (except for New York and Arlington, VA) is an outlier with the predicted value at least one standard deviation below the actual score (see Table 9). According to the model, we would expect New York to have a higher score—13.5 instead of 10. The model predicted Arlington, VA fairly accurately (7.8 compared to an actual score of 7). Sioux Falls is the largest outlier with a score over 3 standard deviations larger than expected (the model predicts a score of about 3 compared to 12 in actuality). Portland, Seattle, Denver, Boston, Madison, Washington, DC, Nashville, and San Francisco all have scores above 9 that are at least 2 standard deviations higher than expected based on location, population size, and median income.
Discussion
US municipalities have, in general, neglected to provide vital data for the safe routing of disabled people. Of the 178 largest municipalities across the United States that we sampled, only 60 percent provided both open data and at least one piece of information that we were looking for. In most cases the included data were only ancillary to accessible travel and useful to another mode of transportation (e.g. car, bicycle).
The lack of geographic data on various accessibility features mandated by the ADA has an impact that is two-fold. First, it reduces the safety and even joy of travel for people who variably depend on these features and determine their routes around them. Second, it has a political impact. Data in this case could be used as a tool for evaluating ADA compliance and demanding better. The ADA is an unfunded mandate leaving enforcement in the hands of concerned citizens (Dilger, 2020; Gwin, 2014; Mills, 1995), but information (particularly quantitative information) is politically powerful (Jasanoff, 1998; Koopman, 2019a). Open and accessible data on public infrastructure would give advocates the tools to demand ADA compliance while also fulfilling the Title II administrative requirement for self-evaluation and transparency (ADA National Network, 2020) 9 .
In the following pages, we explore missing data as both indifference and neglect. It is on one hand the expression of a sociotechnical imaginary of how people do or ought to move through space, on the other hand it is an enactment of political power to silence critique. The slow violence of data neglect has physical and social domains. Lack of knowledge about the environment impacts the physical safety of travelers with disabilities and at the same time reduces the ability to tell a robust story about ADA (non)compliance.
Imaginary modes
Data formats, sociotechnical imaginaries of transportation, and the right to the city
Early on in this research, we asked a software engineer at Google why their routing application (or any mainstream routing application for that matter) could compile the data for routing cyclists but not wheelchair riders. He gave a simple and sensible answer—a wheelchair is not a mode of transportation. According to Google Maps and the American Community Survey, modes of transportation include walking, biking, taking a taxi, driving, public transit, flying, and other (see Figure 4).

Modes of transportation data source: Google Maps (2020), American Community Survey.
Why are these the only modes of transportation? What is the difference between riding a bicycle or a wheelchair? According to the 2009 National Household Transportation Survey in the United States, fewer than 11% of daily trips were made by walking and only about 1% by bicycle (Kuzmyak and Dill 2012). The American Community Survey suggests these numbers have not changed very much in 10 years. In 2010, 0.5 percent of workers biked, and 2.8 percent walked to work. In 2018, these patterns were the same (considering the margin of error) - 0.6 percent biked, and 2.7 percent walked to work (ACS 2010/2018, Florida 2019). In contrast, 12.6 percent of the US population has a disability and 7 percent of the population has an ambulatory disability (over 20 million people). These commuting and demographic data suggest that there are likely at least 10 times more wheelchair riders than cyclists. Yet, the municipalities in our sample are over 4 times more likely to have information about bicycling infrastructure than curb ramps (74 compared to 18).
While the focus of this research was not on modes of transportation and we did not do a thorough review of public transit datasets, our results do point to trends based on generally accepted ideas that municipal governments and corporate enterprises have about what constitutes a relevant mode of transportation. Information for drivers (car, bus, taxi) was more likely to be included than information for cyclists (96 municipalities compared to 74). Information for cyclists was almost twice as likely to be included as information for pedestrians. Sidewalk information was found in 36 municipalities. And half as many municipalities included information directly related to accessibility (curb ramps, 18). These findings suggest that how we define and delimit modes of transportation influences the data collected and planning priorities.
A troubling or hopeful development in this sphere is the recent attention to collecting and maintain data on curb ramps for route delivery robots (Biswas, 2019; Hsu, 2019). These robots require much of the same amenities as a wheelchair rider (e.g. sidewalk width/material/quality, curb ramps) and have in a few cases failed to “recognize,” and thus, endanger people with disabilities. On one occasion, a delivery robot failed to acknowledge a guide dog (Girma, 2020) and in another a robot blocked entry onto a curb ramp in a busy intersection (Ackerman, 2019). Aside from the rich metaphorical material of the robot’s failure to see, recognition being the first fight in the very early disability rights movement, these encounters raise numerous questions about the right to the city and the actors behind imagining how the city ought to be. Most concretely - where are the data that the robots are using to get around and why aren’t they made public? What is the likelihood that these wheeled urban dwellers are prioritized in the so called “smart city” over wheelchair riders and other pedestrians that have unique environmental needs as they move through space? Who is training these robots to “see” and what or who else are they overlooking? 10
Blank spots
Indifference, neglect, and political power
The ADA was a hard-won piece of legislation, which banned infrastructural discrimination based on disability. This 30-year-old legislation requires municipalities to implement accessible design in transportation infrastructure including curb ramps, sidewalks, and cross controls. However, implementation has largely been pushed along by complaints and lawsuits (squeaky wheels) rather than municipal initiatives.
Recall the reasons for data missingness proposed by Onuoha (2019): (1) Those who have the resources to collect the data lack the incentive to do so (and possibly, have incentives not to); (2) the act of collection involves more work than the benefit the presence of data is perceived to give; (3) The data resist quantification; or (4) there are advantages to nonexistence. Reasons 3 and 4 only partially apply to this case. Geodata about infrastructure (the desired data that are missing) do not resist quantification. In fact, some cities collect these data, so it is possible. There may indeed be advantages to data nonexistence (4) and we are open to debate in this area. However, Onuoha is referring to human data in this case—the individual act of avoiding various quantifications. An example of this might be the choice to opt out of social media platforms.
The first two possibilities—that those with the resources lack the incentive and that the act of collection involves more work than the perceived benefit—are most applicable. In application to municipal data in our sample, we suggest that for those curating open data portals the incentives to collect and maintain accessibility data are low and related to imaginaries of the city and data formats - data stewards are unlikely to see the benefit. First, if municipalities collect data that reveals their compliance or non-compliance with ADA standards, it would either force an immediate fix or provide thorough documentation for a citizen complaint. This relates to reason two - the act of collection involves more work than the perceived benefit - particularly for those who do not depend on accessible infrastructure.
Our interpretation is supported by the findings of a recent qualitative study in New England that found that less than 1 in 10 municipalities were compliant with Title II requirements (Brault et al., 2019). When asked why, many participants responded that they had not had issues, did not think it was necessary, did not have enough resources (personnel/money/time), or did not know they were not complying. That is, non-compliance was driven by indifference, ignorance, neglect, and carelessness (the opposite of surveillance).
These trends reveal biases in what data we deem worthy of collection, and the unforeseen consequences for inequality. These data practices comprise the conditions for slow violence or truncated freedom, inclusion, and opportunity for vibrant life. The lack of data, combined with indifference towards collecting it, threatens the physical safety of disabled travelers and the political recognition of this population under the ADA.
We cannot ascribe definitive causality to the fact that every city with a high data score was an outlier in our predictive model. However, there is evidence that these municipalities either had a culture of accessibility or had collected data in response to high profile ADA compliance complaints or lawsuits. For example, the model predicted a score of 4 for Boston compared to the actual score of 11. Boston was also the location of the first ever Disability Pride March in 1990. Similarly, San Francisco also had a score of 11 which was about 6 points higher than expected. In the 1960s at Berkeley, the independent living movement was launched with attention to curb cuts for wheelchair riders. San Francisco was also the location of one of the most noteworthy protests of the disability rights movement, the 504 Sit-in in 1977. Recently a class action lawsuit was filed against the city and county—Kirola v. City & County of San Francisco in 2017. While the suit was not successful due to insufficient evidence, it did expand the city’s understanding of their responsibilities under ADA. Sioux Falls, the greatest outlier with a score of 12 instead of the expected 3, undertook ADA compliance after a resident, Charles Santee, filed a 26 page complaint with the Federal Highway Administration, alleging that the city’s infrastructure was dangerous to wheelchair riders and non-compliant with the ADA (Smith, 2016). The Federal Highway Administration investigated and agreed with the complaint, giving the city 90 days to respond. The very thorough data collection on their open data portal is direct result of that action. Other high-profile cases include Reynoldson et al., v. City of Seattle (2017), Denny v. City & County of Denver (2016), and Hines et al., v. City of Portland (2018). All these actions were settled with the allocation of financial resources toward evaluating the infrastructure, sharing the results with the public, and coming up with a transition plan.
Conclusion
Data about the accessibility of US municipalities is infrastructure in the digital city. What is counted and how, reflects the sociotechnical imaginary of a time or place—the norms and values. Beyond critique of data as surveillant, data are also the opposite—indifferent, neglectful, ignorant. Missing data produce biases. In other fields these biases might be called the conditions of slow violence.
These conditions move out of individual minds and bodies and manifest in “the built environments and social patterns that exclude or stigmatize particular kinds of bodies, minds, and ways of being” (Kafer, 2013: 6). They are maintained because they are familiar. As Jasanoff and Kim write, “[w]hat we ‘see’ in familiar surroundings looks right, epistemically as well as normatively. So the socially conditioned eye can take for granted that all-male orchestras or all-black passengers on the backseats of buses, or even scenes of filth and abject poverty simply represent the rightful order of things” (2015: 14). In this analysis, we draw on critical disability studies to disrupt the familiar.
This paper has been about accessible infrastructure and disability. However, approaching municipal data (of any kind) as the infrastructure of the digital or smart city holds promise for advancing critical data studies. Data and machine learning push information towards digestible classification (“pin down”) and sorting (“speed up”) (Koopman, 2019a; Onuoha and Nucera, 2018). The robust conversation around data bias and data harms proves that the kinds of classification and sorting that occur in many cases only benefit a few.
Returning to Ocean Vuong, “I used to be a fag now I’m a checkbox” and the line after “The pen tip jabbed in my back, I feel the mark of progress.” His words suggest an ambivalence towards the “progress” of more nuanced data collection. There is a violence to the pen tip jab in our reading. This work on missing data is not a treatise on the quantification of everything. Rather, we are dipping our toes in the waters of new ways of critiquing data across temporalities that stretch forward and back. Whether more or less data should be collected, we do not know and cannot answer without more dialogue. Instead, we hope to move towards “another way of being in both the world and time, a desire which resists mandates to accept that which is not enough” (Jose Esteban Munoz in Kafer, 2013: 25). In the field of new technology and data we must be vigilant about that which is not enough. We believe that queer and crip technoscience hold a lot of promise for work and analysis that is as disruptive as it is practical.
Footnotes
Declaration of conflicting interests
The author(s) declared no potential conflicts of interest with respect to the research, authorship, and/or publication of this article.
Funding
The author(s) disclosed receipt of the following financial support for the research, authorship, and/or publication of this article: This work was supported by the National Institute for Transportation and Communities (grant number NITC 16 Dissertation Fellowships 2020, #1374).