
Abstract
Social bots – partially or fully automated accounts on social media platforms – have not only been widely discussed, but have also entered political, media and research agendas. However, bot detection is not an exact science. Quantitative estimates of bot prevalence vary considerably and comparative research is rare. We show that findings on the prevalence and activity of bots on Twitter depend strongly on the methods used to identify automated accounts. We search for bots in political discourses on Twitter, using three different bot detection methods: Botometer, Tweetbotornot and “heavy automation”. We drew a sample of 122,884 unique user Twitter accounts that had produced 263,821 tweets contributing to five political discourses in five Western democracies. While all three bot detection methods classified accounts as bots in all our cases, the comparison shows that the three approaches produce very different results. We discuss why neither manual validation nor triangulation resolves the basic problems, and conclude that social scientists studying the influence of social bots on (political) communication and discourse dynamics should be careful with easy-to-use methods, and consider interdisciplinary research.
Introduction
Social bots are no longer unknown and obscure creatures, but have entered the political agenda. In December 2018, the European Commission (2018: 4) released its Action Plan against Disinformation, addressing social bots as a technique ‘to spread and amplify divisive content and debates on social media’ that could be used to disseminate disinformation. Regulation measures have been passed that demand the labelling of bot accounts, e.g. in Germany and California (e.g. Nelson and Jaursch, 2020; Sacharoff, 2018). Twitter regularly reports about ‘malicious automation (malicious use of bots)’ as a means of platform manipulation in their Transparency Reports, and how many such maliciously automated accounts were deleted by the company. 1 Thus it is not a contested notion that automated accounts are active on the platform and some of them in a harmful way. Raising awareness in the academic field of political communication, previous studies searched for social bots involved in the 2016 US presidential election campaigns (Bessi and Ferrara, 2016; Hindman and Barash, 2018; Shao et al., 2018; Woolley and Guilbeault, 2018), in the run-up to the 2016 Brexit referendum (Bastos and Mercea, 2019; Howard and Kollanyi, 2016), during the 2017 French presidential election (Ferrara, 2017), the 2017 German elections (Neudert et al., 2017), and the spring election in Israel 2019, as a project based on a hackathon for developing new detection methods at the University of Haifa has shown. 2 The objective of most studies is not improving bot detection nor the development of bot detection tools; they are rather end-users of available tools to assess how many social bots are involved in specific discourses and if they have any effect on discourse dynamics and opinion formation at all. In this paper, we argue that while the number of bot detection tools grows dynamically, scholars in social science need to be more aware of the limitations of these tools. We raise the question to what extend the results of studies using bot detection tools depend on the bot detection method that is used.
Our paper is written from the perspective of social science, which has awakened to this phenomenon and has joined monitoring bot activity in recent elections and campaigns. The main reason for this paper is that social scientists like ourselves do study social bots because bots have become part of political communication, while developing detection tools is in most cases beyond our professional training. From this perspective and to inform fellow social scientists, we raise questions in this paper that we alone cannot answer, and we point to basic problems and weaknesses of bot detection tools that are widely used by social scientists, but it is beyond our technological capabilities to fix them. Our contribution is an empirical basis for critical thinking about computational approaches in social science, and outlines the importance of more interdisciplinary collaboration.
From the outset, the development of bot detection tools was and still remains primarily an endeavour of computer scientists, with social scientists as end-users of the simpler variants of available tools. Social bots have been identified by various researcher teams across the globe and with various methods – different detection tools, based on different criteria, and different thresholds to label an account as a bot. The variety of methods, however, inhibits a comparison of the existing studies and to our knowledge, there is hardly any study so far that empirically tests how bot detection tools yield different results. One rare exception, published in January 2021, compared Botometer, DeBot and Bot-hunter on a dataset from the US 2018 midterm elections – the authors concluded ‘that minimal overlap existed between the bot accounts detected within the same tweet corpus. Our findings suggest that social bot research efforts must incorporate multiple detection sources to account for the variety of social bots operating in OSNs, while incorporating improved or new detection methods to keep pace with the constant evolution of bot complexity’ (Schuchard and Crooks, 2021: 1). We present here a similar approach, a comparison between three different bot detection methods on the same dataset: a single-indicator approach based on the activity of Twitter accounts that is used at the Oxford Internet Institute, and two multiple-indicator tools, Botometer and Tweetbotornot, both based on machine learning. We are not internally validating these methods (i.e. their accuracy), we are not manually or forensically validating these quantitative methods in a qualitative manner (i.e. manually searching for false-positives or false-negatives), and we are not claiming to know if one method is better than another.
There are (at least) two main challenges in the detection of automated social media accounts, and our study is no exception: (1) the ground-truth problem concerning the validity of results and (2) the impossibility of replication. Ground-truth refers to the fact that researchers (at least those not working at Twitter) cannot say with certainty how many fully or partially automated accounts exist in the total population, or in a given sample A that could then be compared to a manually or automatically coded sample B with the aim to validate the results of a detection tool in this sample. There is no ground-truth data available or even empirically accessible. All means of detection can only approximate automation, by finding accounts with similar patterns, features and characteristics that were previously detected, or with patterns that diverge from typical use patterns of regular, non-automated accounts. The second key problem is replication. Data ages rapidly, because social media are dynamic environments. Accounts may be deleted or account owners may delete followers or content. Account behaviour and network structure change with any new message sent, with any like received or any new follower added. Detection tools also change, and any release of a new version of a machine learning based tool means that results are incomparable to results from an earlier version. This leads to the situation that analysis is time-sensitive and replication must necessarily come to different results, because the accounts, their behaviour and structure will have changed. The development of tools and the replication of studies is further hindered by the inadequate access that researchers have – or rather, do not have – to social media data (Bruns, 2019; Freelon, 2018). In January 2021, Twitter has opened a new academic track for API access, 3 which is a laudable effort and bot-detection research will benefit from this in the future.
Against this background, it is obvious that bot detection is anything but an exact science. Within the scope of this study, we cannot assess which instrument is ‘better’ in terms of making the most correct predictions about the real amount of automation (because we do not have a perfect tool or knowledge about the correct number of automated accounts). But we can compare if available tools find a similar number of bots, and if they identify the same accounts as automated. Thus, the logic of this paper is not to compare bot detection tools with ground-truth data, but to compare how they work and what they find against each other. We believe that this approach will help social scientists to receive a practical understanding of the challenges and shortcomings of social bot detection.
Background and literature review
Terminologically, bots are a dazzling phenomenon and describe a broad array of very different technologies, from chat bots to gaming bots to (social) spam bots – while it is often unclear what the ‘social’ means in social bots, aside from the focus on social media platforms. With the term bots or social bots (used synonymously here), we refer to partially or fully automated user accounts on social media platforms, in our case Twitter. They are not only created for satirical, fun or commercial purposes (e.g. Bucher, 2014), but also for political purposes (Ferrara, 2018; Kollanyi, 2016). Recent studies have focused on bot interference in political communication, such as the spread of partisan content, misinformation, or false news (Shao et al., 2018). Researchers argue that ‘the noise, spam, and manipulation inherent in many bot deployment techniques threaten to disrupt civic conversations and organisation worldwide’ (Howard et al., 2018: 86). The term computational propaganda is used to describe the phenomenon of intentionally spreading disinformation and attempting to manipulate public opinion through social media networks by making use of automation and digital tools such as social bots (Woolley and Howard, 2019). Researchers applying agent-based modelling in networks have even concluded that, in some settings, only 2–4% bots would be sufficient to turn the opinion climate in networks and that they can easily ‘sway public opinion – or the expression thereof’ through effects of spiral-of-silence dynamics (Ross et al., 2019: 407). Spiral of silence theory has posited that whether people express their political opinions or not, depends on how they perceive public opinion – an effect that has been empirically proven many times in the past 25 years. It is still to be examined to what extent the simulation's results by Ross et al. (2019) can be transferred to real Twitter networks. Morales (2020) suggests a similar effect using a quasi-experimental design. After Twitter had deleted more than 6000 automated accounts that retweeted Venezuela's then-President Maduro in 2013, he shows that Twitter users’ willingness to express criticism of the president as well as support for the opposition significantly increased. These bot accounts represented less than 0.5% of Maduro’s followers, but retweets of Maduro’s tweets dropped by 81% after their suspension. The research design, however, lacks control for external events like changes in media coverage, which could explain those effects, too.
With the number of studies on this topic increasing, researchers seek more clarity regarding definitions of bots and their activities. Based on a broad literature review, Stieglitz et al. (2017) conclude that, in contrast to other types of bots (such as chat bots), a high degree of human behaviour imitation and malicious intent characterise social bots. Gorwa and Guilbeault (2020: 233) have created a comprehensive typology differentiating social bots from other automated programs, such as web crawlers and chat bots, noting that social media accounts that ‘exhibit a combination of automation and of human curation, often called “cyborgs”’, are the most challenging for researchers. By analysing a random sample of Twitter users, Chu et al. (2012) estimate that the Twitter population comprises human, cyborg and bot accounts in a 5:4:1 ratio. Even though it has been shown that bots are not (yet) as successful as humans in engaging other users in meaningful discussions, messages from bots seem to be retweeted as often as those from humans, indicating that Twitter users do not distinguish between bots and humans (Ferrara, 2018; Freitas et al., 2016).
Bots adopt hashtags to promote certain ideas within a discourse or to distract the political debates or (oppositional) groups that form around a specific hashtag (Krebs, 2011; Woolley, 2016). Bot-making tools are readily available, for example, on code repositories as Github (Kollanyi, 2016), and previous research has shown that searching Twitter automatically for hashtags and retweeting them is one of these tools’ capabilities (Ferrara, 2018). In their investigation of available software and markets for (social) bots, Assenmacher et al. (2020) found that rather simple amplifying actions, e.g. posting, favouring or sharing of tweets, can easily be automated, while they could not find any tools for creating ‘artificially intelligent’ bots, e.g. bots that are able to reasonably interact or even discuss with other users.
Neither Twitter users (Boshmaf et al., 2011; Ferrara et al., 2016; Freitas et al., 2016) nor researchers can easily distinguish between automated and non-automated accounts. Detecting social bots has become a specific research field, particularly in computer science (e.g. Subrahmanian et al., 2016). A common approach is to train machine learning algorithms on a data set with labelled bot and non-bot accounts. Those feature-based classifiers often yield high accuracies (the ratio of correct predictions to the total number of predictions) and are subsequently able to classify unseen data. A weakness of these classifiers lies in their inability to detect new classes of bots that have not been represented in the training data, as shown by Echeverría et al. (2018). Hence, comprehensive training data is crucial for these tools. This is, however, inhibited by limited ground truth as well as the highly dynamic and changing behaviour of social media accounts (Grimme et al., 2018). Against this backdrop, describing the training data in detail and linking it to a definition of ‘bot’, i.e. a clear description of what the classifier is able to detect, seem crucial. Both steps, however, are often missing – a shortcoming that is hardly discussed in the literature.
Grimme et al. (2018) demonstrated that it is relatively easy to create social bots that cannot be detected by the machine learning classifier Botometer. They generally question these classifiers’ underlying assumption that bots share common characteristics that makes them distinct, and therefore detectable from non-automated accounts. Hence, they call to rather focus on identifiable automated campaigns and malicious attacks of social bots than on the detection of single automated accounts. Recent approaches in computer science turn towards unsupervised machine learning and group-based detection methods for the same reasons, e.g. by searching for similar temporal retweeting activities of otherwise unconnected accounts (Mazza et al., 2019), by detecting cross-user activity correlations (Chavoshi et al., 2016) or by comparing accounts’ ‘digital DNA sequences’ in order to find groups with high behavioural similarities (Cresci et al., 2017a). These studies all report yielding better results than per-user methods that classify individual accounts. However, the rates of false negatives, i.e. undetected bots, remain unclear and individually automated accounts are neglected.
Most social scientists have so far preferred using tools built by computer scientists or easy-to-employ methods, varying from single-indicator methods, such as the number of published tweets per day (Howard and Kollanyi, 2016), to multiple-indicator methods based on machine learning and including hundreds of variables (Davis et al., 2016; Kearney, 2018). Three of these methods are particularly interesting for and important in the current body of research, as they enable social scientists without a computational background to use them relatively easily: the single-indicator method to check heavily automated activity (Howard and Kollanyi, 2016), and the two multiple-indicator methods Botometer (Davis et al., 2016) and Tweetbotornot (Kearney, 2018). All of these tools have been critically reviewed in previous work (as we will show below). Despite the rapid growth of available bot detection tools and methods, these methods featured prominently in the literature in the past years, recently, e.g. Boichak et al. (2021), Abrahams and Leber (2021) or Haunschild et al. (2021), with almost all studies using only one bot detection method without assessing discrepancies between methods. Thus, we seek to compare different bot detection methods by testing them against each other on the same data set from five political discourses in five Western democracies. Since these methods rely on different premises, key variables and calculations, and it is possible that – depending on the key variable and calculation – they all classify different accounts as bots, raising questions about the validity of their results.
Based on the literature review above we ask:
RQ1: Do the bot detection methods identify the same number of automated accounts? RQ2: Do the bot detection methods identify the same automated accounts?
“Heavy Automation,” Botometer, and Tweetbotornot
Out of a plethora of bot detection approaches, we chose for our study “heavy automation”, Botometer and Tweetbotornot for comparison because (a) they all claim to detect (semi)automated Twitter accounts, (b) they have been used by social scientists in the past and present, and (c) they appear promising to social scientists who are not able to build their own tools. The team led by Phil Howard at the Oxford Internet Institute identified social bots based on an account's activity. All Twitter accounts generating more than 50 tweets per day were labelled ‘heavily automated’ and regarded as bots, as they noticed: ‘these accounts are often bots that see occasional human curation, or they are actively maintained by people who employ scheduling algorithms and other applications for automating social media communication’. (Howard and Kollanyi, 2016: 4). There are four downsides to this approach: (1) Very active human Twitter users, such as political activists or media organisations, are perfectly capable of sending more than 50 tweets per day (Howard and Kollanyi, 2016; Musgrave, 2017). In this vein, the team's approach blurs the boundaries between bots, trolls and human activists. (2) Bots programmed to send up to 49 tweets per day would not be detected; (3) passive bots that only boost follower numbers, but do not disseminate any content cannot be identified; and (4) bots may become more sophisticated over time and vary their activity by staying below a certain threshold. On the plus side, this approach is not black-boxed and does not generate opaque probability scores, but identifies hyper-active and potentially manipulative accounts based on a visible activity level that is atypical of common Twitter users. While it is not clear whether these accounts are automated, they are certainly trying to influence discourses and public opinion.
Using the heavy automation approach, Howard and Kollanyi (2016) analysed Twitter discourses during the Brexit referendum in 2016, finding that these ‘heavily automated’ accounts published a total of 14% of the tweets. The authors also searched their sample for self-disclosed bots and found that only a marginal number of accounts openly label themselves as bots. These bots and accounts that used a known bot launching platform generated only 0.8% of the tweets. In the run up to the US presidential election in 2016, Kollanyi et al. (2016) concluded that bots pushed pro-Trump messages more often than pro-Clinton messages by using the heavy automation approach. According to them, ‘highly automated’ accounts published almost 18% of the tweets related to the presidential election, with this percentage increasing to 25% in the days shortly before the election.
In the case of the German national elections, Neudert et al. (2017) found that ‘heavily automated’ accounts generated between 7.3% and 15% of the Twitter traffic on party-related hashtags, with some variation between the six parties. These scholars also compared the result with the heavy automation analyses during elections in France and the UK in 2017: the identified accounts disseminated between 5.7% and 16.5% of the content, with the lowest levels shown in Germany. Given the difficulties to distinguish between hyperactive and (semi-)automated accounts with this approach, the team recently started to refer to ‘amplifier accounts’, i.e. social media accounts including those that they had previously labelled as social bots (Neudert et al., 2019). Nevertheless, social scientists might be tempted to continue using this approach for ‘bot’ detection out of convenience, assuming that automation goes hand in hand with high levels of activity, even though empirical evidence is ambiguous.
The second tool in our study, Botometer (Davis et al., 2016), is a particularly well-established bot detection tool that many influential studies and organisations, for example the PEW Research Center, use (Wojcik et al., 2018). As of December 2018, Botometer has, per day, handled over 250,000 requests to identify bots (Yang et al., 2019). Both Botometer and Tweetbotornot (Kearney, 2018), the third tool in our study, are based on machine learning and are partially black-boxed: We know their basic categories of variables, but not the details of how they weigh the categories and calculate the result scores. Thieltges et al. (2016) argue that creating more complex classifiers is the first step towards an ethical ‘devil's triangle’ that cannot be solved, since more complex classification leads to less transparency. Conversely, making classifiers more transparent would educate bot creators, resulting in more bot variations and a decrease in detection robustness, which would again increase the need for more complex detection methods.
Botometer, formerly known as BotOrNot, is based on supervised machine learning and is publicly accessible via an API since 2015 (Davis et al., 2016). The developers, computer scientists at the University of Indiana, define social bots as ‘automated or semi-automated accounts designed to impersonate humans’ (Yang et al., 2019: 48). The tool generates 1209 features (v3 since May 2018) from any Twitter account, grouped into six classes: network, user, friends, temporal, content and sentiment features (for more details see Davis et al., 2016). Using the random forest algorithm, the computer scientists trained a classifier that generates a score for each feature and an overall score (Davis et al., 2016). In its third version, the classifier is based on training data sets containing 57,155 manually verified social bots and 30,853 legitimate human accounts. Currently, the classifier's training data includes spam bots, political bots, porn bots, vendor-purchased fake followers and more (Yang et al., 2019). Botometer delivers a score between 0 and 1 for each account that is tested, indicating to what extent this account behaves human- or bot-like. Since 2017, the team included language-independent evaluations and introduced the complete automation probability (CAP) score by means of Bayes’ theorem. Compared to the overall ‘score’, CAP was created for users checking only individual accounts via the website, not a whole data set. These users do not see the entire population, and often mistake scores for individual probability (Yang et al., 2019).
Botometer has to date been used in various studies: Botometer's developers estimated that the bot population on Twitter ranges between 9% and 15% (Varol et al., 2017). Bessi and Ferrara (2016) concluded that bots were responsible for about one-fifth of the Twitter conversations about the US presidential election. They further estimated that bots accounted for about 15% of the total Twitter population involved in these discussions (Ferrara, 2018). Wojcik et al. (2018) argued that bots often send tweets containing links to popular websites. Pozzana and Ferrara (2018) used Botometer to further analyse the differences between bots and humans’ session-related behavioural trends. In addition, Shao et al. (2018) used this tool to first identify bots in order to show that bot accounts contribute disproportionately to the spread of low-credibility content. Woolley and Guilbeault (2018: 206) classified Twitter accounts with Botometer to show ‘that bots won a significant amount of attention and interaction from human users’ by creating retweet networks. Vosoughi et al. (2018: 1146) investigated the diffusion of true and false news on Twitter, finding that humans and bots spread false information, which diffused ‘farther, faster, deeper, and more broadly’ in social networks than true information did. Recently, Boichak et al. (2021) studied inauthentic behaviour in US and German elections using Botometer.
While prominently used, Botometer has been criticised, too. Though the classifier yields high accuracy rates, if there are types of bots that are not included in the training data, it is unlikely that bots of these types are found in new data sets. Additionally, while it is laudable to include so many different kinds of social bots, it makes it difficult to interpret the results retrospectively, that is, manually identify what kind of social bot was detected and why – and whether the score may be an artefact of the more than 1000 indicators. Rauchfleisch and Kaiser (2020) tested Botometer's (v3) diagnostic ability on different data sets: taking into account the lower occurrence of bots compared to non-bot accounts in the general Twitter population, they can show that the tool's bot/human classifications are often imprecise. Applying various thresholds that have been used in previous studies, they estimate that the tool produces between 41% and 76% false positives and 71% and 90% false negatives, also depending on data and language. 4 Sayyadiharikandeh et al. (2020) responded to that critique by adopting a new version of Botometer (v4) in September 2020. Based on their observation that bot accounts show higher heterogeneity than human users, i.e. humans share consistent characteristics while there is a variety of bots, they implemented specialised models for distinct bot classes. As a result, the authors report better generalisation and Botometer now provides a ‘bot type score [describing] how much the account acts like a specific kind of account’, including the six types echo-camber, fake follower, financial, self-declared, spammer and other bots (Botometer, 2020).
The third tool in our study, the R package labelled Tweetbotornot, formerly known as botrnot, was developed by Michael W. Kearney and published on Github in March 2018. Hindman and Barash (2018) used Tweetbotornot to analyse the role of bots in disinformation campaigns in the US, finding that most accounts spreading fake or conspiracy news were probably bots or semi-automated accounts. Haunschild et al. (2021) analyse topic networks in the context of scientific knowledge diffusion on Twitter with this tool. Similar to Botometer, Tweetbotornot is based on supervised machine learning (gradient boosted model) and assesses the probability of a Twitter account being a bot, delivering a score between 0 and 1 for each account that is tested. This method's ‘default model’ uses user-level metadata, such as the number of friends, followers, posts, time of the account creation; tweet-level metadata, such as the percentage of retweets versus quotes versus pure tweets, and tweets’ frequency and repetitive timing; and tweet text, such as the number of spaces, punctuation, capital letters, mentions, links, line breaks and Unicode characters. The classifier was trained on 10,000 Twitter accounts with over 7000 bots. Based on this set of training data, it showed an accuracy of 93.8% according to Kearney. 5 While the programmers of Botometer published their training data, Kearney's training data is not publicly available. This is also problematic against the background that Kearney defines ‘Twitter bots’ simply as ‘automated’ accounts, leaving the tool's capabilities opaque. 6 Since Tweetbotornot shares its functional principles with Botometer, general concerns about the tool's reliability and validity also apply here (Grimme et al., 2018).
Choosing a threshold score to delineate humans and bots is one of the challenging tasks in this research field. While the heavy automation approach sets the threshold for an account being a bot at 50 tweets per day, Botometer and Tweetbotornot do not recommend a fixed threshold. This led scholars to using a variety of different thresholds: Wojcik et al. (2018) set a rather low threshold of 0.43, which the Botometer team criticised but set the threshold even lower in their study published 1 year later claiming that a 0.3 threshold ‘corresponds to the same level of algorithmic sensitivity of a score equal to 0.5 in prior versions of Botometer’ (Luceri et al., 2019). Woolley and Guilbeault (2018) set a threshold of 0.7, Keller and Klinger (2019) of 0.75 and Broniatowski et al. (2018) of 0.8. Hindman and Barash (2018), who used Tweetbotornot, circumvented the problems related to thresholds by not setting one at all but comparing average scores for different groups of accounts. Such an approach runs the risk of being tautologic as the criteria for assigning users to groups, e.g. users with high levels of negative versus positive content, might also be included in the classifiers’ variables. In terms of thresholds, Kearney states for Tweetbotornot that ‘although the error rate during validation was small, due to there likely being a lot more non-bots than bots on Twitter, the number of false positives (actual non-bot accounts that receive bot probabilities greater than 0.50) may still be relatively large’. 7 While a higher threshold reduces the risk of false positives (Woolley and Guilbeault, 2018), it still requires justification. To transparently show that another threshold would have produced a different result, we argue that the score distributions should be shown in density plots.
Data and methods
Data collection
To test different bot detection methods, we focused on political discussions on Twitter in Sweden, Germany, the UK, the US and Italy. We started with hashtags that were not only heavily discussed on Twitter and become ‘trending topics’, but that the journalistic mass media in the relevant country also covered, between July and September 2018. The selection included:
#chemnitz referring to far-right riots that occurred in Chemnitz, Germany, #brexit referring to UK debates on leaving the European Union, #genova referring to the sudden and tragic collapse of a bridge in Italy, #kavanaughvote referring to the appointment of Brett Kavanaugh as US Supreme Court justice after sexual assault allegations, #val2018 referring to the 2018 Swedish national election.
We then accessed Twitter’s Premium search API using Python (3.6) with full access to these hashtags’ previous 30 days of data, gathering sufficient data for each case to capture the trends’ peaks. First, we obtained data via the API's ‘count endpoint’, indicating the overall number of tweets and retweets containing a specific hashtag. The count data not only provided the number of (re-)tweets using the specific hashtag per day and hour, but also allowed us to trace the development of each hashtag trend over time. The count data showed that, on a single day, each trend had a clearly distinguishable peak within a few hours, indicating that most tweets with this hashtag were sent during this time.
Starting from the busiest hour during the trending hashtags’ peaks, we downloaded data by hour until we reached about 50,000 tweets per hashtag (see Supplemental Material). This included metadata, such as the author's screen name, the tweet content, and the author's self-description. This approach provided us with a total of 263,821 tweets from 122,884 unique user accounts for our sample. We aimed at a sample size of around 50,000 tweets per hashtag to have comparable samples for each hashtag. To ensure we only included tweets relating to the political discourses, we downloaded tweets in the countries’ official languages. One side effect of using hashtags as a starting point is that the sample only contains active accounts, which means that this sampling strategy neglects human or bot accounts that remain passive and just increase an account’s follower numbers.
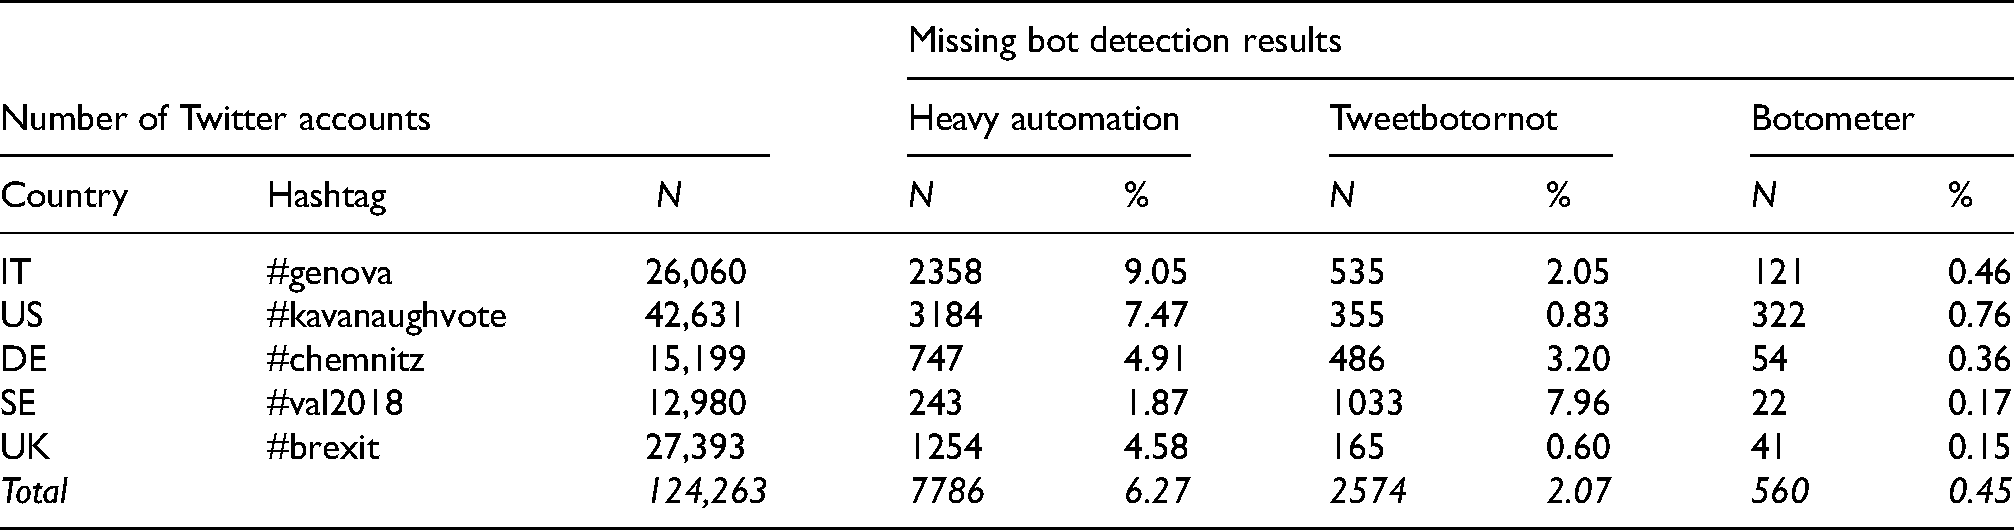
The heavy automation approach also required us to download the timeline data of all the accounts in the sample by means of Twitter’s REST API. All the accounts in our sample used the hashtags at least once and we subsequently tested which of them had tweeted more than 50 times that day. Unfortunately, we could not retrieve the timelines of all the accounts in our sample due to some having strict privacy settings or having been deleted. In addition, Twitter’s REST API only grants access to a user's most recent 3200 tweets. This limitation means that we might not have captured some highly active accounts and might even underestimate the number of heavily automated accounts. Consequently, we could not calculate the volume of tweets of 2538 (9.05%) accounts using the hashtag #genova on the relevant day(s), of 3184 (7.47%) accounts using the hashtag #kavanaughvote, of 747 (4.91%) accounts using the hashtag #chemnitz, of 243 (1.87%) accounts using the hashtag #val2018, and of 1254 (4.58%) accounts using the hashtag #brexit. We collected all of the data (tweets and timelines) during September and October 2018, undertaking the data cleansing and editing by means of Python (3.6) and R (R Core Team, 2018) (for an overview, see Table 1).
The number of Twitter accounts per hashtag and number of missing values per bot detection method (total and percentage).
Bot detection
In the last step, we conducted the bot analysis by applying the three different approaches to bot identification to all the accounts we had extracted from the samples of (re-)tweets: We labelled all ‘heavily automated’ (Howard and Kollanyi, 2016) accounts that had published more than 50 tweets per day as bots. We tested each account via Botometer's (v3) API (Davis et al., 2016) and the R package Tweetbotornot, using the ‘default model’ (Kearney, 2018), shortly after the data acquisition. Bot analyses were finished by the end of October 2018. While prior research using Botometer set the threshold at a 0.5 score, we chose a higher bot threshold of a 0.75 score (Broniatowski et al., 2018; Keller and Klinger, 2019; Varol et al., 2017) to minimise the risk of false positives. Considering Kearney's statement about false positives when applying a score of 0.5 for discrimination (see our discussion above about setting a threshold), we decided to use the same, higher, threshold for Tweetbotornot, too. For both classifiers, the developers did not recommend a specific threshold, so there is no good reason to set different thresholds when comparing the performance of the two on the same data set.
Setting the threshold for probability scores was a key decision in the research process, because this threshold determines whether we identify an account as a human or a bot. Consequently, the threshold had a direct influence on how many bots we found.
Our method of comparing three existing bot detection methods did not involve additional manual coding by human coders. Rather than a validation, this would have been a fourth method of bot detection. Studies have already shown that human coders are by no means better able to identify automated accounts (Cresci et al., 2017a, 2017b), at least in manual content analysis, while sophisticated digital forensics is a different story. Different from studies that work with labelled data sets of clearly identifiable accounts in order to measure a tool's accuracy, precision or recall, manual validation when working with data from the general Twitter population is no solution to assess validity: we expect to find a small number of accounts that are reliably classifiable, while a large amount of accounts will be ambiguous. In the best case, manual content analysis would be redundant: based on criteria in a codebook that is already included in the tools based on machine learning, such as frequency or sequence of tweeting. In the worst case, manual coding tries to ‘validate’ the results of elaborate algorithms with the mere gut-feeling of a human coder. And indeed, a study by Münch et al. (2019) shows that human coders come to different ratings than Botometer, but it remains unclear what categories/variables were used for the coding and no reliability scores are reported for the coding.
Results
We observed some variance with respect to the number of identified bot accounts in the various political discourses, but – in terms of our research questions – an even greater variance between the different bot detection tools. Overall, the heavy automation and Tweetbotornot methods found the highest percentages of bot accounts and tweets sent by bots, whereas Botometer classified a considerably lower number of accounts as bots. The density plots (see Supplemental Material) further substantiate our finding that, for each classifier, overall scores were distributed similarly across the five data sets. The plots also show that setting the thresholds differently would change the quantity of bots found, but not the finding that there is only some variance between the five discourses.
Overall, we identified 27,363 heavily automated accounts, which amount to 22.0% of all accounts in our sample. As shown in Table 2, the percentages of heavily automated accounts participating in each discourse vary distinctly. The hashtag #kavanaughvote had the largest percentage of heavily automated accounts at 40%, whereas the hashtags #genova, with only 11%, #chemnitz, with 14%, #val2018, with 16%, and #brexit with 20% had lower percentages.
The number of accounts classified as bots by detection method (total and percentage).
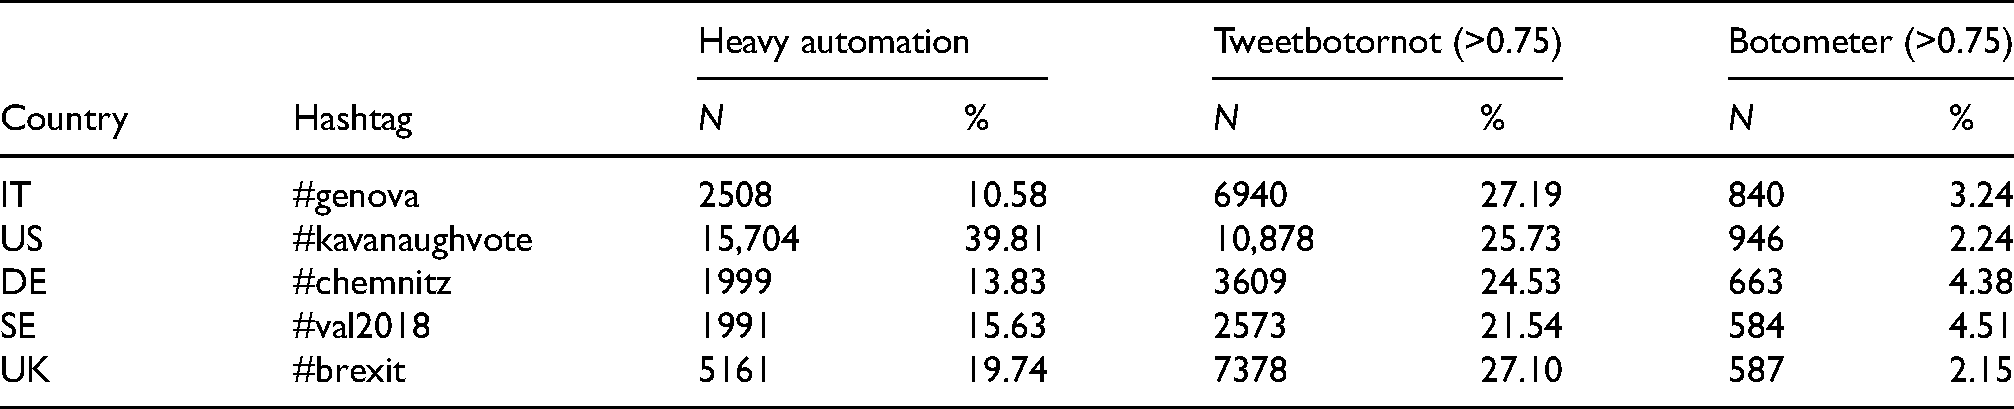
The highest number of bots in our sample, consisting of 31,378 bot accounts (25.3%), was obtained when applying Tweetbotornot’s machine learning algorithm. Despite a rather high bot-threshold of 0.75, the bot prevalence varied between 22% and 27% of the accounts in each discourse – the highest number of all three methods. Our findings reveal that, overall and for four of five individual hashtags, Tweetbotornot found more bots than the heavy automation approach. However, when ranking the hashtags by bot prevalence, we get two quite different pictures: While #genova ranks highest among Tweetbotornot’s results, we find the lowest number of bots for this hashtag when we compare heavy automation’s results. Results of the other four hashtags vary significantly and with no clear and comparable pattern. This indicates a serious challenge for comparative research.
Botometer results differ only slightly between the hashtags and are, overall, quite low. In total, Botometer only classified 3620 accounts, which amount to 2.9% of the total sample, as bot accounts. With regard to the bot prevalence for each hashtag, the percentages range from around 2% in #brexit and #kavanaughvote to 3% in #genova, and more than 4% in #chemnitz and #val2018.
While both tools are based on machine learning classifiers, Tweetbotornot and Botometer show extremely dissimilar results: While #chemnitz and #val2018 have the smallest bot prevalence according to Tweetbotornot, the Botometer results show that these two hashtags have the highest percentage of bots, although on a significantly lower level. Similarly, Botometer puts #kavanaughvote on the lower end of the range of hashtags regarding bot prevalence, but, according to heavy automation, this hashtag has the highest bot results. Alongside the differences between the overall number of bots, the inconsistency between the rankings illustrates that the two classifier methods can produce quite different results, which is probably due to the different calculation models, the training data used, and the different weighting of the variables.
Notable differences were also found between the three bot detection methods with regard to tweet dissemination (see Table 3). According to the heavy automation approach, the bots sent most tweets about #val2018 (51%) and #kavanaughvote (46%), whereas they distributed the fewest tweets about #genova (22%).
The number of tweets sent by accounts classified as bots by detection method (total and percentages).

Tweetbotornot found similar high percentages. Interestingly, the hashtags reveal just a little variance: Tweetbotornot estimates that bots sent between 28% and 32% of the tweets in our sample. Conversely, Botometer finds that only between 2.3% and 3.6% of the tweets were sent by automated accounts.
It is important to keep in mind that heavy automation's classification relies on identifying accounts that send more than 50 tweets per day, with at least one tweet using one of the five hashtags. Some accounts were therefore heavily involved in the discourses. We found many accounts that published more than 50 tweets containing the hashtag in each sample. Some exceptionally hyperactive accounts even sent more than 100 tweets containing the hashtag within only a few hours – and Botometer did not classify them as bots. In the last step, we were therefore curious about the overlaps in the results, which we addressed in our second research question (RQ2): Do the different detection methods find the same bots? To investigate this issue, we extracted the three subsets of bots that each bot detection approach identified and calculated the number of accounts that each of the other two methods classified as bots within the subset (see Table 4).
The number of commonly classified bot accounts (in total and according to each subset).

Only valid percentages are shown (compare Table 1 for the number of missing values).
Overall, with a percentage of 34.8, Tweetbotornot classifies a slightly higher percentage of accounts as bots in the subset of heavily automated accounts compared to the percentages in the original sample, which ranged from 21.5% to 27.2% (25.2% average). Likewise, at 32.9%, we find more heavily automated accounts in the subset of Tweetbotornot's bots than in the overall sample, where the heavily automated accounts ranged from 10.6% to 39.8% (a 19.9% average). This result might be due to Tweetbotornot’s classifier assigning a higher weight to tweet activity. In contrast, the number of bots that Botometer classified was even lower in the subset of heavily automated accounts than in the overall sample (1.5% vs. 3.3%). This suggests that Botometer’s classification does not assign much weight to the sheer number of account publications, but more to other features, which suggests that accounts do not need to be highly active to be classified as bots by Botometer. Upon inspecting the subset of accounts that Botometer classified, which is by far the smallest, we also find a lower percentage of bots classified as heavily automated accounts (11.7%) than in the overall sample.
There is a considerably higher overlap between Botometer and Tweetbotornot, as the latter classified 53.3% of the accounts as bots in the respective subset (compared to 25.2% in the overall sample). Further, Botometer classified slightly more accounts in the Tweetbotornot subset (6.0%) compared to the overall sample (3.3%). Since the two classifiers differ greatly regarding the number of bot classifications – Botometer’s number of bots is only a tenth of Tweetbotornot’s number of bots in the total sample – the overlap in this subset only ranges on a very low level.
We therefore answer our research question by acknowledging that the detected bot prevalence and activity vary considerably between the different approaches (Figure 1). Depending on the bot detection method used, researchers will find very different results and levels of bot prevalence and activity. This is an important issue, as it obviously makes a difference whether researchers report that 30% of bots are involved in political discourse, or only 4%.

The number of commonly classified accounts in percent (N total = 113,372 (all accounts with results from all three methods)).
Discussion
By comparing three different bot detection methods, we tested whether different methods lead to different results regarding the number of bots, tweets from bots and whether these methods could be combined. We found that, depending on the bot detection method, the number of Twitter accounts labelled as bots and the number of tweets that these accounts sent varied greatly. Moreover, this pattern remains consistent across all the different cases studied. This implies that research results obtained by different methods cannot be compared. To say it more drastically: the number of automated accounts scholars find depends heavily on the method they use. Since all three methods rely on quite different understandings of what ‘bots’ are, they all identify different types of accounts with hardly any overlap. Drawing from previous studies as well as our own, we can assume that all the tools produce false positives, accounts with no automation labelled as a bot, and false negatives, accounts that actually are automated but not detected as such. Our study vividly demonstrates the discrepancies in results caused only by the choice of method – regardless of performance differences between data of different languages and Twitter populations, which previous studies have shown (Rauchfleisch and Kaiser, 2020).
One of the methodological limitations of our study and of bot detection in its current state in general, is the problem of reproducibility: As mentioned earlier, social media is highly volatile, Twitter accounts are constantly deleted or newly created or simply change their behaviour. Machine learning classifiers used via an API, however, analyse accounts at the present moment, which leads to differing scores for the same account over time. Further, since we conducted our analyses, Botometer has introduced a new version (v4). Thus, the scores we collected in our analyses cannot be reproduced. In fact, when we re-tested the accounts labelled as bots by Botometer (v3) in our study with Botometer v4 in 2021, we could not retrieve any result for 26% of these accounts, and 52% would not be classified as bots (according to our threshold) at this time and with this new version.
Our key take away is that we can only have limited confidence that the available tools give us solid information about the bots in our data. Whichever method researchers use, they will face validity and reliability problems. These problems are related to methodological limitations just as much as they are a question of definition and terminology. Developers of feature-based classifiers such as Botometer and Tweetbotornot would help social scientists (and other end-users) a lot with clear terminology and describing their training data, disclosing the specific kind of ‘bot’ their tools are able to find. It is an advantage of single indicator methods that classification is not black-boxed, but they are hardly capable of detecting automation and we endorse efforts of (terminological) clarification, e.g. the OII team's decision to refer to ‘amplifier accounts’ rather than ‘heavily automated accounts’. Social scientists should consider interdisciplinary research for keeping up with recent developments in the field of bot detection, which is rapidly changing. The tools we have used are being regularly updated, and there is a continuous stream of new detection tools entering the arena. This does not mean that our results are short-lived – the problems our study points to, are not results of a bug that could be easily fixed. Indeed, the more tools there are, the more salient these problems get: What are the premises, definitions, training data; what kind of automation do these tools detect, exactly; and how reliable are their results when applied to unseen data?
Triangulation cannot improve the situation much. We only included three approaches in our study, but they disagreed fundamentally regarding the number of bots they found, as there was hardly any overlap in the bot populations that they identified individually. We had anticipated that using more than one method would improve bot studies’ validity, as one method should counterbalance the other method's weaknesses. But this did not prove true. Not only did the number of bots and bot-sent tweets vary, but also the three methods even ranked the amounts differently. This again shows that bot detection is not replicable – neither with the same method (due to constant data changes and the bot detection scores), nor with another method.
Consequently, social scientists are stuck between a rock and a hard place: the technological level of innovation in the field is beyond most social scientists' training, but ignoring the existence of automated accounts when studying Twitter is no solution either. Researchers should be extremely critical and demand maximal methodological and data transparency from studies on bots and similar phenomena. Scholars need to build institutions to share data, to make their datasets available without publicising them. By transparency, we mean that developers should be more precise about the premises, definitions and training data underlying their tools, and scholars should always report (and critically reflect) thresholds, outliers and the limitations of the tools used. We would also urge scholars to pursue more comparative studies of bot detection methods on a larger basis than we did here, e.g. comparing dozens of detection methods on the same data sets – in order to map the fragmentation of the field and the different kinds of automation they detect.
A problem here is that social media platforms do not provide adequate data access to effectively built detection tools and train them. While Twitter reports how many bot accounts the platform removes, Twitter does not share data from these deleted accounts. As a result, researchers are merely peeking through the key hole at the moment, and it is not possible to hold Twitter (or other platforms) accountable. As long as we do not have more reliable tools to detect social bots, we will face severe difficulties to assess if these accounts have an impact on processes as election campaigns and public discourse around the world, if they are problematic or not. Twitter made a step into the right direction recently, by opening full data access for accredited academic researchers. One way or another, this problem needs to be resolved for researchers to make meaningful contributions to the role of bots, cyborgs, fake accounts, and the like in public discourses.
In the current situation, independent researchers and regulation authorities are unable to effectively monitor if platforms like Twitter are doing enough against platform manipulation by automated accounts, or if they are even doing what they claim they do. It is nearly impossible to systematically assess from outside the social media companies and without their data access how many automated accounts (as one part of coordinated inauthentic behaviour) are active and what their effects on discourses actually are. In addition, research has shown that hyperactive users – automated or not automated – on social media platforms are shaping discourses with a high share of interactivity and by distributing opinions that clearly diverge from other users (Papakyriakopoulos et al., 2020). Thereby they create loud minorities, possibly influencing the opinion climate by setting spiral-of-silence dynamics in motion (i.e. minority groups becoming louder, radical groups more aggressive in their communication, as they falsely perceive themselves to be a silent majority, see Scheufele and Moy, 2000).
Based on the above, we close by once again emphasising that our study has limitations. We only focused on active Twitter accounts which had used one of the hashtags, thus we cannot make any statement as to what extend the inclusion of passive accounts, e.g. followers, had led to different results. The heavy automation approach did not allow us to calculate some users’ number of tweets due to data inaccessibility, especially regarding #genova and #kavanaughvote. Further, this analysis was only focused on periods in which a topic was actually trending, therefore missing potential bot activity in timeframes before and after the trending period. In addition, we only examined one hashtag in each country. We could not determine the different approaches’ validity and accuracy, as this would have required a labelled dataset with disclosed bots. Consequently, we could only examine the different detection approaches’ reliability and differences with regard to the number of identified bot accounts applied to political discourses on Twitter. Finally, bot detection tools change constantly due to their developers updating and improving them, which is a more general limitation. These changes cause problems for longitudinal comparisons and make replication impossible.
It seems that social bots remain a challenging phenomenon for researchers and are still a largely uncharted territory in the social sciences. Perhaps one way forward would be to focus on the effects of hyperactive accounts, on the dynamics of coordinated inauthentic behaviour rather than on the degree of automation. In the end, it is humans who are controlling automated accounts, too. Developing better tools and pushing for better access to training data would be necessary if regulation authorities were to hold social media platforms accountable.
Supplemental Material
sj-docx-1-bds-10.1177_20539517211033566 - Supplemental material for Bot, or not? Comparing three methods for detecting social bots in five political discourses
Supplemental material, sj-docx-1-bds-10.1177_20539517211033566 for Bot, or not? Comparing three methods for detecting social bots in five political discourses by Franziska Martini, Paul Samula, Tobias R Keller and Ulrike Klinger in Big Data & Society
Footnotes
Acknowledgements
The authors thank the Joint Seed Funding program of the University of Zurich and Freie Universität Berlin for their support of this project, our colleagues and the anonymous reviewers for their helpful comments and suggestions.
Declaration of conflicting interests
The authors declared no potential conflicts of interest with respect to the research, authorship, and/or publication of this article.
Funding
The authors received no financial support for the research, authorship and/or publication of this article.
Supplemental material
Supplemental material for this article is available online.
Notes
References
Supplementary Material
Please find the following supplemental material available below.
For Open Access articles published under a Creative Commons License, all supplemental material carries the same license as the article it is associated with.
For non-Open Access articles published, all supplemental material carries a non-exclusive license, and permission requests for re-use of supplemental material or any part of supplemental material shall be sent directly to the copyright owner as specified in the copyright notice associated with the article.