
Abstract
This article describes how the City of Los Angeles is showcasing data-driven services to the public through dynamic visualisations of open data. I frame an analysis of this aspect of datafication in local government through linguistics and cultural theory; drawing on this set of literature I theorise the use of public data as both a performative tool and a performance of data-driven city services. I then discuss examples of interactive maps on the City of Los Angeles’ open data websites, produced by the Bureau of Sanitation, the Controller’s Office, and the Department of Transportation. The article concludes with some general thoughts on how open data maps are a new form of impression management; they set up a relationship in which government and citizens are in alignment, sharing an orientation towards administrative problems that begins at the same point, framed by an administration’s datasets.
The symbolic power of data
One of the longstanding jobs of government administrations has been to create statistical knowledge used to manage populations and resources. Transactional records, geographic boundaries, indexes, and census points have long guided decisions and yielded predictions about the world. Statistics provide a rationalised ‘documentary intelligence’ that aims to make a population or the functions of an administration legible and hence manageable (Scott, 1998: 39). One goal of this administrative project is a comprehensive ‘view from nowhere’ that can claim general validity of a phenomenon, rather than experiential, participatory, or anecdotal ways of knowing (Jasanoff, 2017). Such rationalised ways of seeing have been amply recorded by Foucault (1979) through his description of state recordkeeping to manage populations and health; in De Certeau’s (1984) meditation on the distinction between lived, embodied ‘place’ versus impersonal, objective ‘space’; in Scott’s (1998) influential history of comprehensive and utopian land-use mapping; and in McKittrick’s (2006) account of race-based techniques that allowed for the capture, production, and control of human life as an economic resource. Porter (1996) describes ‘cultures of objectivity’ that valorise quantitative methods to carry out administrative tasks. ‘Objectivity’, claims Porter, has become an honorific word bestowed on decision-making procedures that appear disinterested and unbiased. Writing in 1991, Rose describes the ‘numericization of politics’ as numbers take on power in modern political life, and the ‘politics of numbers’, as numbers are enrolled to define state power and shape resource provision.
Historically, government administrations collected numbers painstakingly through censuses and surveys on a non-continual basis. Today’s paradigm shift towards a data saturated world can be attributed in part to the scale and velocity of data collection, thanks to pervasive and ubiquitous computing and the gains in functionality through automation and algorithmic processing, as well as to a rise of data collection and processing at the municipal scale. Municipalities can now manage urban systems by collecting real-time information from environmental sensors, cameras and smart meters, analytics from government webpages and social media, machine-readable cards or IDs (both of employees or recipients of benefits), and citizen feedback through online forms, among others (Kitchin, 2014: 2). ‘Smart city’ literature explores how city administrations harness data for a more efficient, participatory, and sustainable urbanism, using algorithms to approach complex infrastructural and social problems, from traffic and waste management to water reduction and homelessness – though always in ambiguous relation with growing surveillance capacities (Townsend, 2013). City governments have also begun turning to legacy databases and documents to discover what can be rendered as value-added secondary data, often to measure agency performance, determine service allocation, or make predictions about issues such as housing conditions or crime (Bergh et al., 2018).
This bulk of scholarship on the ‘smart’ and data-driven city has, however, paid very little attention to how representing these data practices now act as a form of impression management. Scholars have looked critically at how, since the late-aughts, cities such as London, New York, and San Francisco have turned to dynamic dashboards and urban indicators rendered as maps and graphs to help make service and policy decisions (Halpern, 2015; Kitchin et al., 2015; Mattern, 2015). Administrators risk treating these graphical constructions, these scholars note, as panoptic, seamless views of the city, forging a perspective that obscures the complexities of city life and partialities of the underlying data’s construction. Left out this literature, however, are accounts of how cities have also used these data visualisations to showcase their services to the public, expanding their repertoire of communication modes beyond static press releases, quarterly reports, and government websites. These public-facing dashboards and data visualisations at times make the underlying data available, which invites a new dynamic with citizens: the public can scrutinise the evidence used by government to underpin service decisions and policy, and then – using a quite specific skillset – react, working as ‘data publics with a sense of the state’s performance’, as Ruppert (2015) has noted.
Beyond their instrumental use, these dashboards, maps, and graphs play a cultural role that draws on a larger social imaginary of data as enabling more effective and democratic public service. As I discuss next, I consider the cultural force of data visualisations a particular type of performativity. Many scholars have pointed out that the collection and processing of data has a performative quality: data is not a mere one-to-one representation of phenomena but rather a construction used to act on the world (Bowker and Star, 2000; Desrosières, 2002; Gitelman, 2013; Latour, 1987; Porter, 1996). This performative power can be carried out in many ways. The logical use of data to determine city service decisions – what I consider instrumental power – is distinct from the cultural performance of data to provide new modes of engagement with the public, which is a symbolic power. In the next section, I theorise these two different performative functions of data, before providing several case studies of open data maps that present Los Angeles as a data-driven city to its citizens.
Performativity of data and data as performance
Once data is constructed, people can use it to do things. This simple statement isn’t controversial, but it does a great deal of epistemological work. By focusing on how people use data to make decisions and act on the world, and on how data alters their very perceptions of the world, attention shifts from questions of validity – from claims of how accurately the data represents the world – to the question of the data’s rhetorical and epistemological power as people use it to act, justify statements, and create new concepts, along with the political consequences of all of these things.
Several scholars have drawn on the concept of performativity to theorise how the production of numbers and data facilitate types of actions, often referencing Austin’s classic linguistic theory on the transformative and productive power of speech acts (Espeland and Mitchell, 2008; Mackenzie, 2006; Ruppert, 2017). In How We Do Things With Words, ‘constative speech’ are statements that can be assessed for their validity – for how accurately and truthfully they represent phenomena. ‘Performatives’, in contrast, are those speech acts that carry out an action, such as declaring (‘I now pronounce you husband and wife’) or swearing (‘I promise I won’t do that again’) (Austin, 1975). Austin was not concerned with the validity of these statements but with how they function to change reality through their very utterance.
Scholars have applied Austin’s concept of performatives to numbers and, more recently, to data to describe this action-oriented function. In ‘A Sociology of Numbers’, for instance, Espeland and Mitchell (2008) draw on Austin to describe the work that can be done with numbers beyond representation. By codifying phenomena numerically, we can measure and compare, predict and monitor. Measurement facilitates the creation of ontologies that reshape the world and transform its irreducible complexities into stable categories, giving rise to many sociological concepts that we now take for granted such as ‘unemployment’, ‘IQ’, and ‘public opinion’, which alter the very things they purport to represent (Espeland and Mitchell, 2008). Scott’s classic example is of the forest, subject in early modern Europe to measurement and economic valuation, two processes that formed the foundation for the landscape’s severe disfiguration through forest management. The same applies to economic abstractions. Mackenzie (2006) describes how economic models do not simply express price patterns that were already existing, but dynamically alter them.
Other scholars discuss performativity via Judith Butler (2006), who uses the concept to expose the role of symbolic systems in power relations that construct the cultural and social lives of humans (Crooks, 2019; Matzner, 2016). Here scholars draw on performativity to explore how data produces human subjects. Such work evokes Hacking’s (1986) argument that numbers ‘make up people’ by bringing new clinical classifications of human beings about (for instance, those with multiple personality disorders), more often than not to discipline them. Hacking (1999: 34) describes how human classifiers (of pregnant teenagers, of domestic abusers) have a ‘looping effect’ on those classified, altering them once they become objects of scientific study. As Crooks (2019) points out, because such categories are constructed, and hence contingent, performativity then provides a theoretical entry point for making disputes about the different meanings of data categorisations a focus of analysis.
Critical cartography and critical data visualisation literatures also draw on the concept of performativity. This scholarship argues that maps and data visualisations are not objective, scientific reflections of pre-existing reality, but symbolic inscriptions that cohere around organised and parameterised graphical expressions reflecting ‘a specific set of power-knowledge claims’ (Crampton and Krieger, 2005: 12). As such, maps are always based on interpretations about what phenomena to represent, how, and the construction of relations between components. Kitchin and Dodge (2007: 335) characterise maps as active, ongoing processes brought into stability through knowledge practices that are ‘learned and constantly reaffirmed’ – maps say as much about the context of viewership as what is being viewed. To Pickles (2004: 12), ‘the cartographic gaze’ codifies phenomena into different relations and categories that then bear on how we understand and instrumentalise them – graphic visualisations are ‘mythic’ abstractions, but their claims of accuracy have very real effects (94). Writing about the urban dashboard trend since the 2000s, Mattern (2015) argues that these digital graphs and maps allow administrators to rationalise and track city processes and also act upon them. Maps and data visualisations are consequently performative in that, through both their construction and use, they shape the objects, geographies, and identities they purport to represent, while also shaping the agency of the viewer, who now comprehends the world through these constructions. This literature also explores interventions, such as counter-mapping and feminist data visualisations, that can intervene in the epistemologies of graphic production by democratising the design process or critiquing the dominance of quantitative methods over the qualitative, narratological, and embodied (Ignazio, 2015).
There are in actuality several types of performativity implicit in this literature. Rose (1991) makes such a distinction clear when he talks about the difference between using numbers to enact versus authorise state power and to discipline subjects. ‘Calculating power’ is Rose’s term for using numbers as mechanisms of rule itself, to enact certain policies and resource allocation. Calculating power is not normally public facing but done in administrative offices as part of routinised bureaucratic decision-making. Here data is used instrumentally to take action in the world through sorting, tracking, and prediction – similar to the Austinian performative. In contrast, what Rose describes as ‘calculated power’ is public facing – it is the use of numbers to justify or authorise political power in a democracy. Here, numbers are used to create an impression of the state as legitimate, and it is the impression itself – how effectively it confers authority to the state – that has force in the world.
So, on the one hand, numbers and data are performative when people use them to facilitate or create new types of actions or to produce objects and human subjects. With data-driven algorithms, which make decisions using the data fed into them, the performative nature of data becomes mechanised and automatic. This kind of performativity is instrumental. People use numbers to categorise, sort, commensurate, rank, make if/then decisions about, and track objects and humans, now more and more through automated means. In the context of cities, data gathered on street cleanliness conditions will rank streets to determine which will be cleaned. Data produced from forms filled out by the homeless will tell authorities who should receive housing. Automatic traffic light algorithms will use data inputs to determine when lights will turn green – no human need be in the loop. Here numbers are performative in very much the same way that certain utterances bring about ontological change in the world: humans use them to create the conditions to act, or, as seen more and more in online settings, for algorithms to act.
Yet Espeland and Mitchell also talk about how numbers can signal legitimacy, authority, fairness, and expertise. Though the authors do not make the distinction themselves, this type of performativity diverges significantly from the Austinian meaning. This use of numbers to create impressions is not performative in the sense that Austin intended it – words whose primary function is to facilitate action leading to a change of state, rather than to represent – but is much closer to Goffman’s (1999) idea of performance of the self. 1 With Goffman, the action under concern is that of creating an impression intended to influence. A performance is an ‘activity that services to influence in any way any of the other participants’ (8). Goffman writes that performances often present individuals as coherent, idealised, polished end-products, and the audience must decide whether or not to accept these presentations as legitimate. The performer fails if the audience believes she doesn’t have the authorisation to play such a role. Identity is contingent on these interactions; it becomes shaped and produced through impression management, and the fostered impression can take on an agency as real as any common-sense notion of ‘the actual’ underlying it. For this reason, an analysis of a Goffman performance is less concerned with the correct or incorrect carrying out of an action but with the expression and force of that action’s symbolic meaning.
Goffman applied this dramaturgical metaphor to face-to-face interactions in almost all cases in his writings. Scholars since have applied this analysis beyond the individual to analyse corporate actors. Manning (2008), a sociologist of policing, writes ‘an organization is an actor, or performer … it could create and disseminate impressions to its advantage’ (687). Institutions, like individuals, can draw on a ‘sustaining imagery’ to manage impressions, rationalise their work, and signal their authority (687). Observing the case work of police units in the DC area, Manning (2008) noted that closing a case generated a visible record of an achievement, either ‘an arrest, evidence, or an informant’, that signalled efficiency and success (690), and high volumes of case closures allowed police to represent themselves in a good light. White and Hanson (2002) similarly look at how private corporations use the corporate annual report – one of the key documents shareholders use to learn about their companies – to manage public impressions and create a coherent, flattering corporate identity.
Goffman, by focusing on face-to-face actors, appears to give primacy to the ontologically distinct self as a performer. But once applied to organisations, the concept of performance challenges the idea that individuals can exist as distinct, embodied entities. White and Hanson (2002) point out that Goffman’s definition of ‘self’, described in The Presentation of Everyday Life, has an inherent ambiguity. He sometimes describes the self as an emergent corporate arrangement: There will be a team of persons whose activity on stage and in conjunction with available props will constitute the scene from which the performed character’s self will emerge, and another team, the audience, whose interpretative activity will be necessary for this emergence. The self is a product of all of these arrangements, and in all of its parts bears the marks of this genesis. (245)
A part of institutions’ repertoire of impression management tools, as some scholars have also picked up on, includes their display of data gathering and analysis. Fiore-Silfvast and Neff write about the ‘social performance of data’ in the context of medical records. In this setting the collection of medical data ‘represent a notion of actionability’ and of evidence-based change that legitimates medical decisions because data is broadly associated with efficiency, objectivity, and accountability. Fiore-Silfvast and Neff (2014) call this function the data’s ‘social valence’. Similarly in his research on audits, Michael Power (1999) deploys the term ‘performative’, but he uses it to describe how trust in audits reflect ‘ideals of their capability which legitimate the field of knowledge as a whole’ (9). Audits are used to make decisions and take action in the world in the Austinian sense, yes, but they also are deployed to project the appearance of an efficient, accountable, and cost-effective administrative style based on rational number crunching. These identity performances deploying numbers have performative force in the world to be sure, but one that is symbolic and rhetorical, not instrumentally used to act.
In the following analysis, I treat open data maps published on the City of Los Angeles’ websites as a type of identity performance. These maps make departmental activities and city processes visible and measurable, creating a statistical form of evidence for whether and how the city is meeting its policies and service goals. These maps also show that the City is drawing on data to guide decisions and allocate resources – key to claims that Los Angeles is a forward-looking city using technology for ‘smart’ innovation. Goffman’s concepts steer the focus away from how administrators use the data to make decisions and actions and towards how the data is deployed to manage impressions of administrative activity as efficient, legitimate, and democratic.
In the next sections, I explore these maps as an impression-management technique used by the City of Los Angeles during the years 2013–2017.
Methods and setting: Open data Los Angeles
The insights presented below arose as part of a long-term study that drew on interviews and participant observation of Los Angeles’ open data program. For the wider research agenda, I spoke to City staff about invisible clerical and technical work that goes into creating Los Angeles’s administrative datasets as open data and data visualisations, including maps. I conducted interviews with staff in nine City departments and with open data advocates and activists over five years, from 2013 to 2017. 2 Below, I discuss open data projects that resulted in four online maps, as described to me by three interviewees who were involved in the maps’ design, one in the Department of Transportation, one in the Bureau of Sanitation, and one in the Controller’s Office.
Research began in 2013, the first year of Los Angeles’ open data program and the launch of its first open data portal, ControlPanel.LA, that published City financial data maintained by the City’s Controller office; later that year the City’s Mayor, Eric Garcetti, set a policy requiring each city department to publish at least one publicly relevant dataset on a new city-wide site that went live the following year. The policy later expanded with the addition of another open data website called Geohub, a repository of interactive maps that draw from departments’ open geospatial data. During these years Garcetti directed funds to departments to implement new data-driven initiatives that reflected the City’s commitment to more rationalised approaches to service and resource allocation. As I will describe next, a handful of departments have displayed the process and progress of these data-guided projects through the dynamic maps on the City’s open data websites.
The maps analysed here are all created through the ArcGIS Online software supplied by the GIS company ESRI, a long-time vendor of the City of Los Angeles, and displayed either on Geohub or ControlPanel.LA. The software allows users to examine the maps at various scales, from the global down to household plot level; clicking on points of the map yields pop-up boxes of geographic, demographic, and various types of administrative data pulled from back-end databases available for download. A search bar allows users to type in specific addresses. The software also allows designers to add contextual guides such as timelines and scrolling side bars of text. Below is an example of a map showing Los Angeles’ Ratio of Households Living Above and Below the Poverty Line that displays these features (Figure 1).

Ratio of households living above and below the poverty line.
While the majority of maps on Geohub offer a single layer of geographic data plotted on a map, the maps analysed in the next section are among a minority that offer much more contextual detail through scrolling text, timelines, and additional demographic data layers, added to tell stories of administrative processes. The four maps selected are representative of staff’s decisions to explore the maps’ functionalities and use them to communicate their data-driven approaches to administrative work.
In the next section I draw on several of Goffman’s techniques of impression management – fronts, idealisation, the promissory nature of a performance, and mystification – to analyse these open data maps. I do not see them as representations of city processes but as ‘instruments of power’, as Pickles (2004: 67) puts it, reflecting particular interests: in this case, city administrations’ concern in showcasing their evidence-based policy work. I ‘read’ the maps through contextual information provided on their webpages and staffs’ descriptions of their construction, which reflect choices made about what to formalise as data and what to reveal about those processes. In a final section I look closer at how agencies address a specific type of citizen through the maps, a participatory ‘data public’ that frames complex city issues through administrative data.
Techniques of impression management of open data maps
Goffman describes several techniques that work as a performer’s typical bag of tricks. One central technique for Goffman is the front. Fronts are impressions that become standardised over time and signal to an audience through their stabilised symbolic meanings. Fronts are not the same as bald deceptions; they are rather strategies that draw on the widely accepted symbolic, cultural value of an action: A given social front tends to become institutionalized in terms of the abstract stereotyped expectations to which it gives rise, and tends to take on a meaning and stability apart from the specific tasks which happen at the time to be performed in its name. The front becomes a ‘collective representation’ and fact in its own right. (17)
Many of the maps on Geohub take on cultural significance by showcasing a data-driven approach to public service. Take the City’s Vision Zero project, ‘a data-driven road safety policy’ that uses collision data to locate areas of high collision-related death, with the goal of reducing death and injury to zero by 2025. According to the webpage, the project draws on a similar program in Sweden that started in 1997 and led to a significant drop in pedestrian and cyclist deaths. Los Angeles’ interest in this process comes from its tragic track record: it has long had one of the highest rates of traffic deaths in the US, with more than 200 people a year losing their lives while traveling on city streets. 4
Vision Zero data is presented online through a website with a blog, ongoing reports, and a safety toolkit that explain the various safety measures implemented. The initiative also has published various maps, timelines, and pie charts on Geohub. There, viewers can explore three dynamic, interactive maps. The High Injury Network is a set of streets selected through an analysis of the Department of Transportation’s data on the highest concentration of traffic collisions that result in serious injury or death in the city. The map exists along with a scrollable sidebar that supplies context for the data. In one viewing, the High Injury Network streets overlay with the Community Health and Equity Index, aggregate data that paints a picture of the populations most burdened by health problems; the map clearly shows that some of the most dangerous streets are in the neighbourhoods already most vulnerable to great health risks. The map also pinpoints schools that were identified by Transportation for their locations in areas at high risk for fatalities.
Another map, ‘Vision Zero Los Angeles: A data driven approach’, (Figure 2) describes the processes of creating the High Injury Network and the City’s resulting consultations with community stakeholders in impacted areas. The map also links back to the underlying data library, which citizens are invited to explore and use.
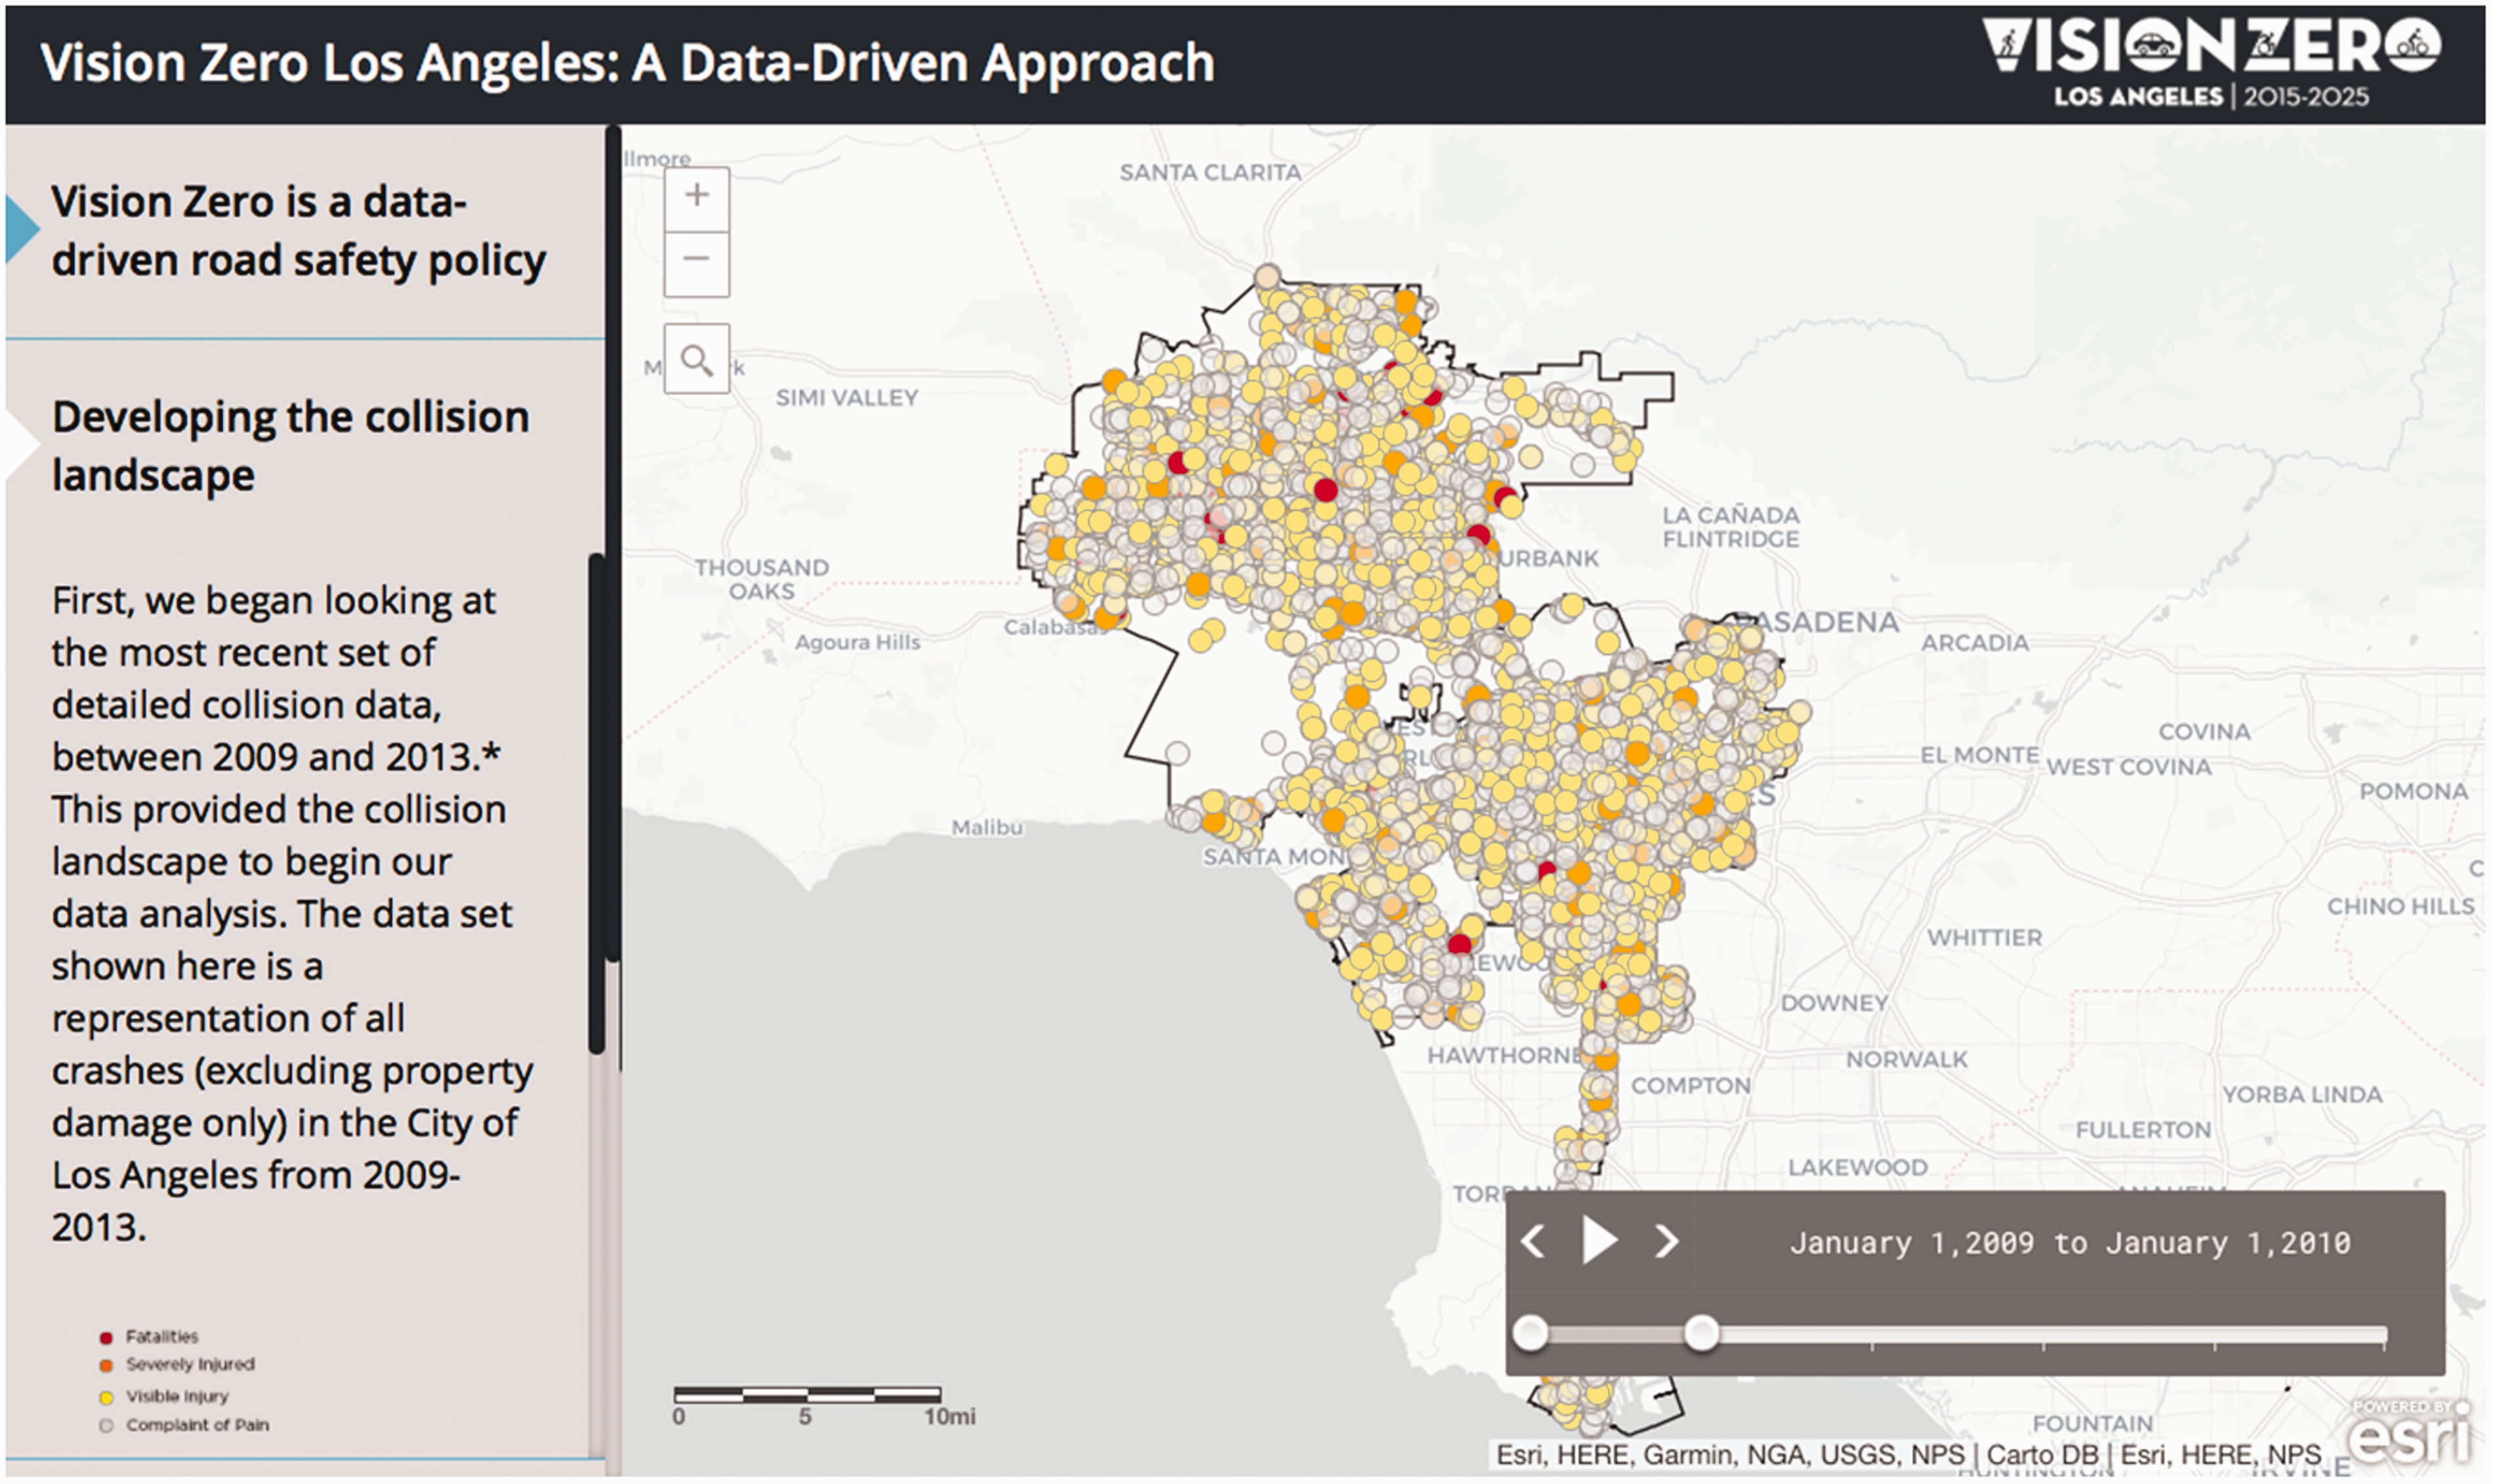
Vision Zero Los Angeles: A data driven approach.
The map is both performative and operates as a performance. 5 Performative, because the data dictates to the City the most impacted areas and where it should direct outreach. The analysts use the data to pinpoint communities they can work with and to direct the flow of resources, such as in efforts to improve Figueroa Street in East LA by adding a series of buffers between the cycling lane and care lanes. 6 At the same time, the Vision Zero visualisations showcase to the public the data driving the decision-making process, displaying some of the mechanisms that direct its actions to reduce fatal collisions. Static reports that synthesise the underlying data would not be as revealing about the mechanics behind data analysis as the interactive maps that link back to the original data points. Said one of the staff who worked on Vision Zero: ‘The program shows the expertise of planners and engineers that know how city is built’; and it does this by showing ‘when the data comes in and feeding that to the public’. 7 Making visible the instrumentality of the data, here, is the performance, since it draws on the widely held public understanding – ‘front’ – that data-driven decision-making will lead to just, rationalised, and efficient outcomes.
Another, subtler point Goffman makes about performances is that they are initially promissory in character: The others [audience] are likely to find that they must accept the individual on faith, offering him a just return while he is present before them in exchange for something whose true value will not be established until after he has left their presence. (2)
Many maps on Geohub have this promissory character. Consider another example of data-guided decision-making, the Bureau of Sanitation’s (BoS) Clean Streets Initiative, a result of a 2015 executive directive by Mayor Garcetti. The Initiative gave funding for more crews to respond to bulky item pick-up requests and illegal dumping reports and to drop 5000 new trash cans in the City. Clean Streets also standardised the data collection of the two-person waste crews in each of the five waste collection districts that the City is broken into; before, each had its own data collection methods when its drivers hit every street in the city – 22,000 miles – each quarter of the year.
8
Now, thanks to standardisation, BoS has a single dataset created by the field crews, who count incidences of litter, weeds bulky items, and illegal dumping. A GIS supervisor then runs an algorithm to score each street segment, ranking them on a three-point score as ‘clean’, ‘somewhat clean’, and ‘not clean’. Using a dashboard of the data, managers assign clean-up resources to grids with higher scores. Said a BoS staff member, By providing the collection crew the exact location and visual evidence of the item, the collections crews are now able to better plan and execute their routes, and this has increased the speed with which they can collect items from the street.
9
The Initiative showcases its progress on Geohub through the Clean Streets Index (Figure 3), a map that visualises a street-by-street ‘cleanliness assessment system’ to allocate city services. Since 2016, according to the website, the Initiative has resulted in 82% reduction of ‘not clean’ streets. As of this writing, the map only shows the quarterly assessment for 2018 (rather than an extended time series), and the city is mostly a swathe of green, punctuated with small red patches in parts of North Hollywood, the West Hills, and South LA. The red patches are the areas to focus on: if BoS continues to act on the data, it will target these areas for clean-up – the map makes this case and synchronises the public’s expectations with BoS’s intentions. Said my BoS interlocutor, it is this public-facing aspect that makes Clean Stat so useful: There is no doubt that all of this data has helped sanitation improve its efficiency, but the best part is that it has helped us show the scope of the problem to the public. It has taken an issue that was an emotion driven discussion and turned it into a data driven discussion allowing us to have better dialog about policy and resources.

Clean streets Index.
Another Goffman technique is idealisation. Goffman’s understanding of idealisation does not equate it directly to dishonesty; like a front, it caters to an audience’s expectations about what is acceptable. The performance will often ‘incorporate and exemplify the officially accredited values of the society’ (23), reflecting a community’s assumptions and understandings by accentuating some actions and concealing others. A related term in the Goffman lexicon is ‘mystification’: ‘the control over what is perceived’ through social distance. Performers mystify through a degree of detachment that allows them to perform their duties, almost ritualistically, without the constant glare of up-close inspection. For public bureaucracies, idealisation through distance might be as important as its rituals of transparency: it is what allows institutions to carry out services without a public constantly searching for disfunction and human error.
All data visualisations are abstractions and simplifications, and as such, they do not transparently reveal the City but mediate and comprise it; these forms mystify by making some things visible while keeping others from view. The CleanStat map, for instance, presents a seamless bureaucracy that responds to data in a timely way, but it also hides that there are ongoing problems of waste. Said one of the Sanitation staff: The concern is if Sanitation become increasingly good at identifying these items and collecting them at a faster and faster pace, then are we forgetting about our efforts to educate the public on how and when to properly dispose of these items. If they assume that by just putting it out there that the city will pick it up, then are we disincentivizing the public to be the city’s partner in keeping the streets clean? I think that’s more of a social question of which I am in no way an expert. What I can tell you is that CleanStat has made us better at collecting items and identifying places where items cause blight but the number of items that we collect has not declined.
10
Of course, data visualisations and datasets also mystify much about the processes of their shaping. Espeland (2015) talks of quantification as ‘a systematic stripping away of the components of narrative’ (62) about the construction of the data, its roles in political relations, and types of expertise involved. Consider the case of Control Panel’s Domestic Violence map 11 (Figure 4): the Controller’s office in 2015 audited the LAPD for its crime reports over the past five years in an effort to understand how the City was responding to domestic violence; a staff member told me their approach was ‘the first time we integrated a data and innovation lens to auditing’. 12 The resulting interactive map shows that domestic violence cases are evenly distributed around the City, even while domestic violence services remain wildly ad hoc – both geographically uneven (only 10 of the City’s 21 districts has Domestic Abuse Response Teams (DARTs)) and underfunded. Viewers can contextualise the geographic data showing sites of police domestic violence reports – scrubbed of household scale data – with additional layers of data on neighbourhood density, City Council district, area incomes, and census tracts. In the scrolling sidebar next to the map, text explains that ‘On a typical day, 131 people call the City of Los Angeles’ 911 number for help because of domestic violence’. The map functions as an advocacy tool – the Controller has used both the audit and map to call for DARTs in each district and more domestic violence funding, going on record in the Los Angeles Times to point out that New York, San Francisco, and Chicago all spend more on domestic violence services (in 2013–14 New York put up $107.2 million to Los Angeles’ $3.2 million) (Walton, 2015). Unlike the first two maps discussed, this map doesn’t show data-driven responses but uses the data to argue that future policy should be based on records of widespread domestic violence.

Domestic violence in Los Angeles.
What the map does not reveal is that its data did not come directly from the LAPD, but went through an auditing and cleaning process within the Controller’s office. The process of cleaning the data surprised the Controller’s auditors; thumbing through the reports – 15,000 of them in 2014 alone, written by officers at the scene of a crime – they found that police had miscategorised 30% of crimes by using the categories ‘battery-simple assault’ or ‘battery-aggravated assault’ rather than ‘intimate partner-simple assault’ or ‘intimate partner-aggravated assault’, obfuscating that an incident was between partners or family members. Said one of the Controller’s staff, only ‘once you dig into the report, [you found] it was a girlfriend/boyfriend situation’. 13
The map presents a neat translation from police reports to geographic data points, but, like most maps, this is a mystification of data work, presented as clean and finished, an idealisation of the bureaucratic process. The map never mentions the Controller office’s intermediary role, and it hides the extent that the LAPD underreported acts of domestic violence to such a large degree that could – or already has – affected how the City’s resources are distributed. The map wants viewers to focus on the main finding – that domestic violence is not immune to any geographic location, class, or race – not the processes of its making. The map withholds in order to convey its message in a straightforward way; it communicates the rhetorical power of the Controller’s audit without revealing the data work behind it and the biases in police reporting.
Audiences in the data-driven city
Goffman’s performance techniques offer a heuristic to understand these dynamic maps as a form of impression management for administrations aspiring to ‘smart city’ governance. We are now left with the question of audience. Performers and their audience, according to Goffman, make each other up mutually. The performer calibrates a performance in response to the audience: ‘when an individual appears before others his action will influence the definition of the situation which they come to have’ (3). A final analysis on the City’s performance through these maps should look at how the notion of particular audiences is incorporated into the impression the City wants to present. What kinds of publics do their creators presume will use them, and how do those assumptions proscribe a certain type of citizen? Several authors have asked these same questions out of concern that visions of the smart city limit practices of citizenship, reducing it to technocratic acts of data management and tinkering (Currie, 2018; Gabrys, 2014; Irani, 2015; Mattern, 2015; Ruppert, 2015; Shelton and Lodato, 2019). Here I add to this literature by looking at how the maps constitute particular citizen subjects; my concern is less with the actions the maps might enable than with the kinds of knowledge relations they propose between city and citizen.
All of the maps described above were published alongside larger campaigns: to build new infrastructure that protects cyclists and pedestrians, to clean up Los Angeles’ streets, and to increase domestic violence funding. The city promoted these campaigns through press releases, town halls, and interviews with the press and websites – the maps described above were only one component of wider efforts to engage citizens on these projects. There are indications these maps have received positive public notice, often through local press and blogs, such as the website CityLab’s coverage of the Clean Streets Index, which it called ‘forward-looking’, and Streets Blog LA’s coverage of the Vision Zero map. 14 The Clean Streets Index was added to Esri’s Maps We Love, and one 2017 article reported it has had 40,000 views (Ladin-Sienne, 2017). 15
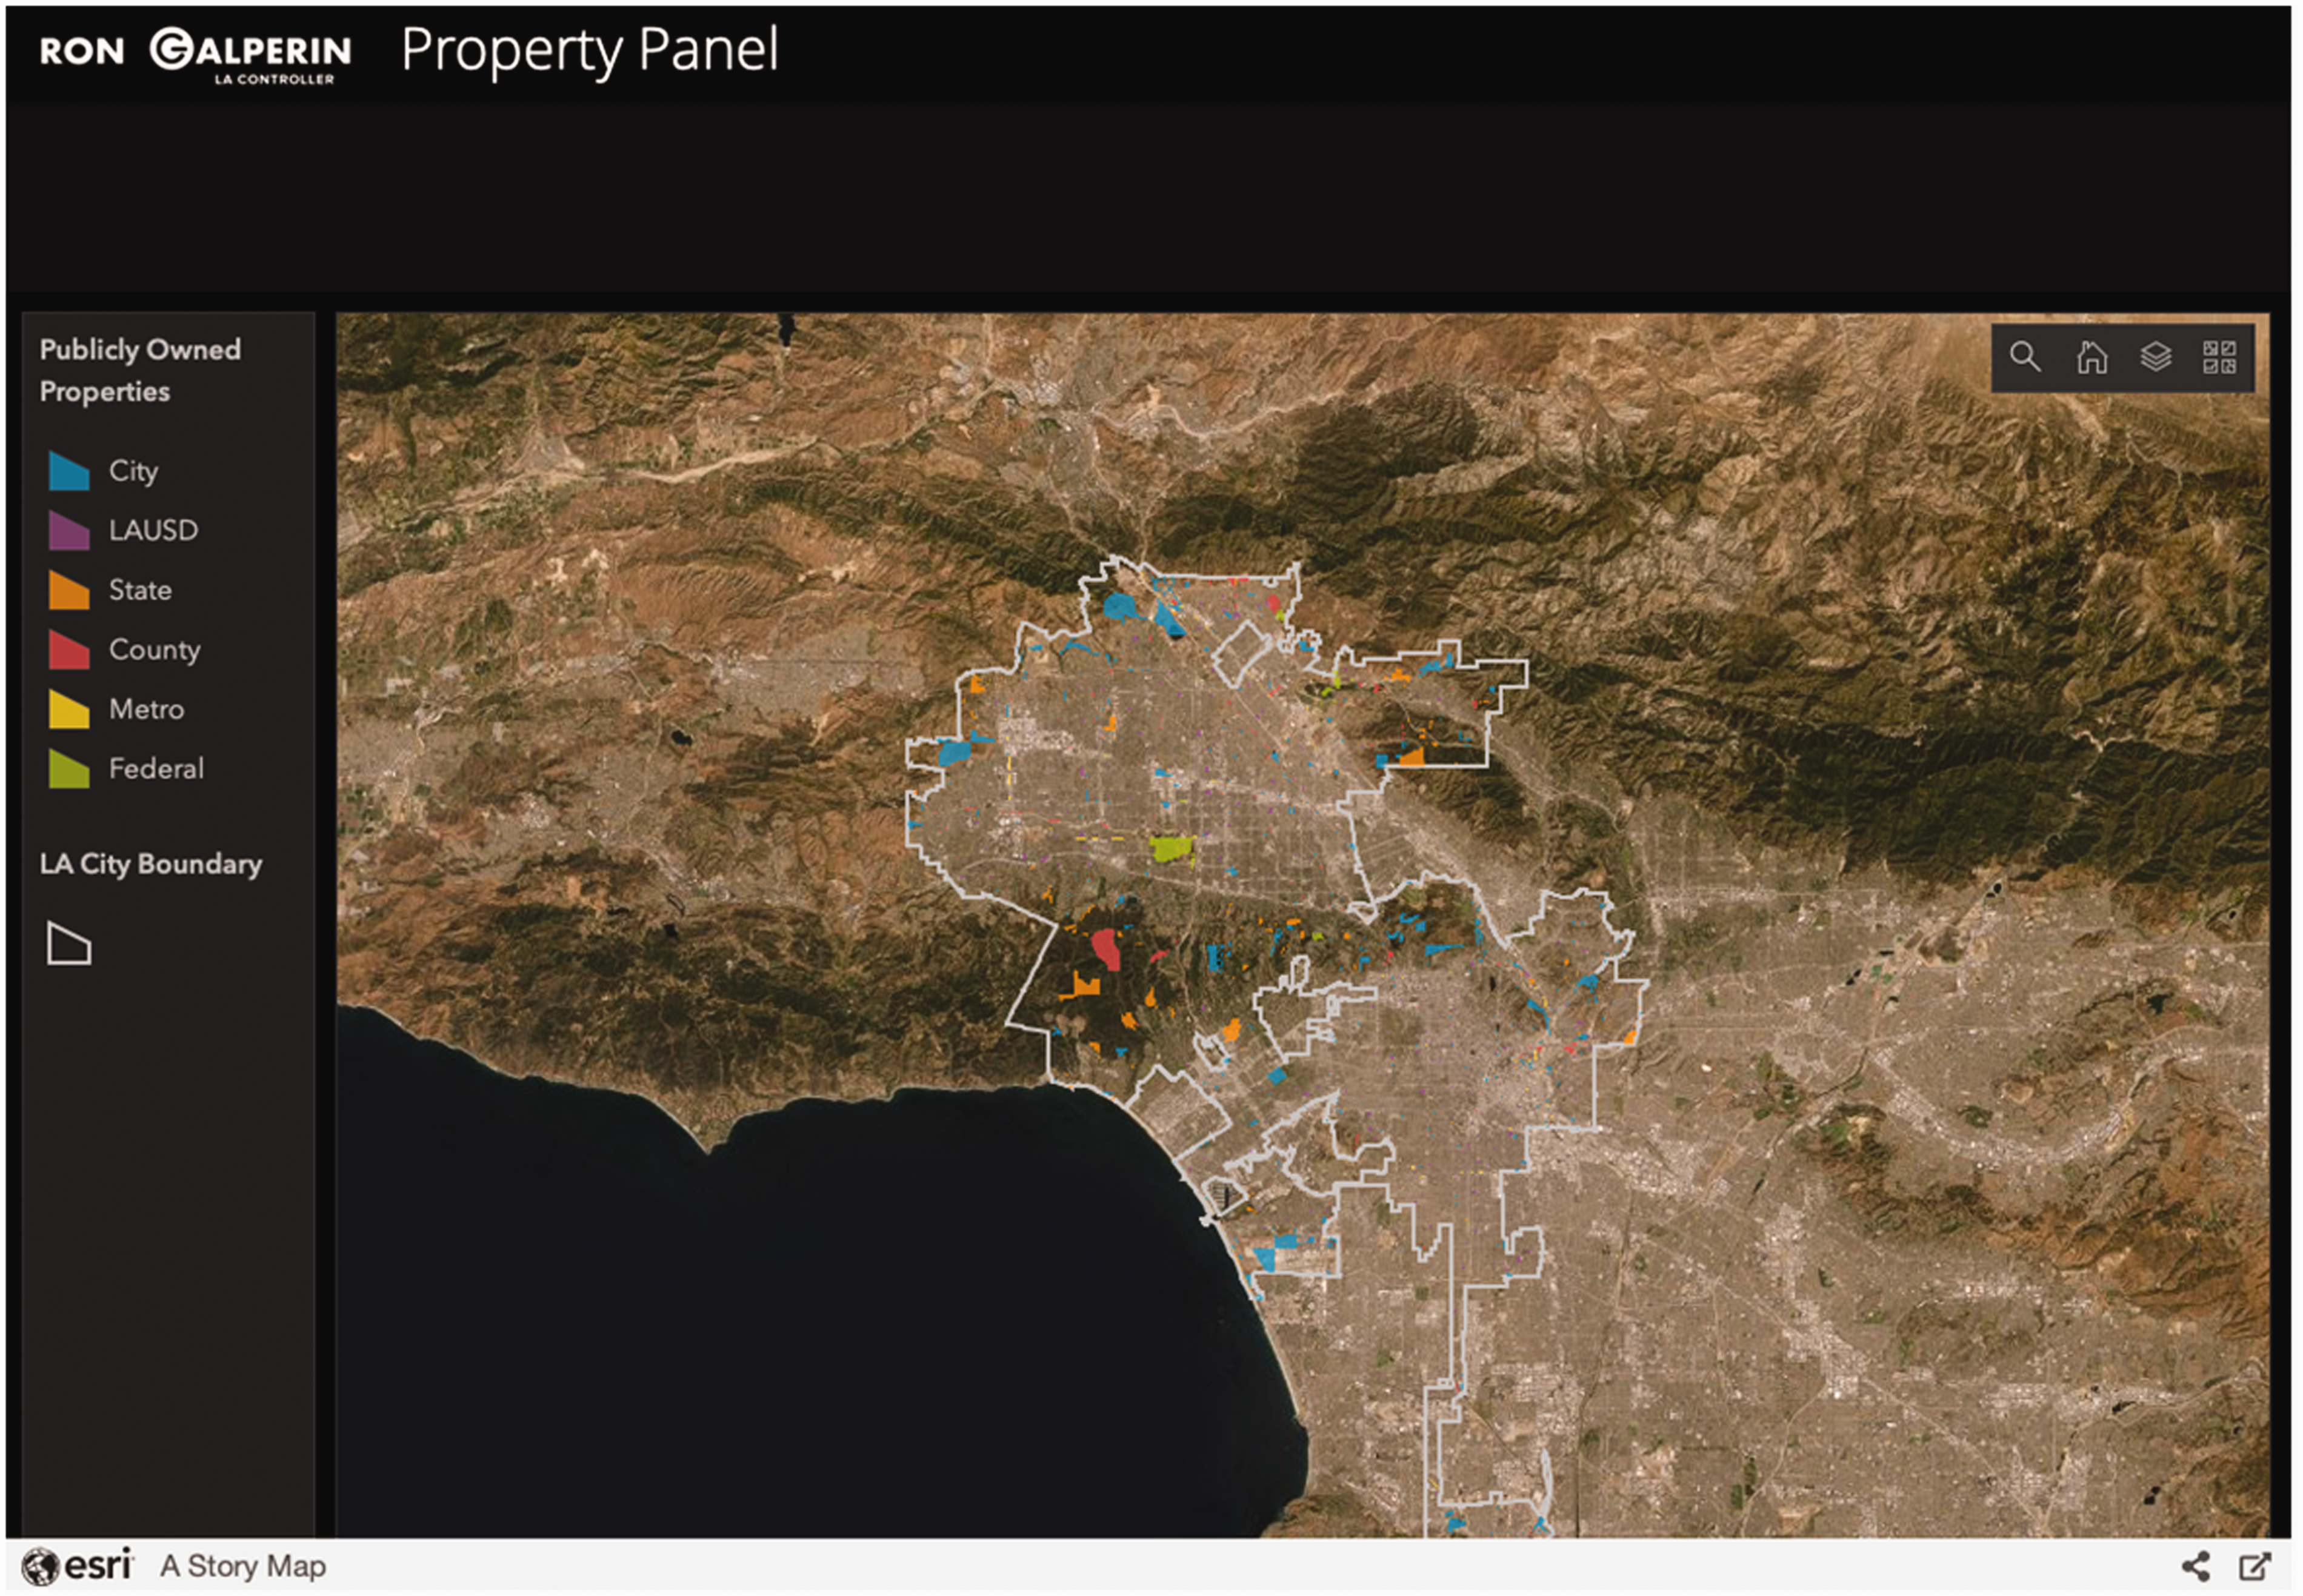
Property panel.
Yet beyond actual usage, the maps’ interfaces anticipate particular citizen subjects as an audience, which becomes clear in the kinds of use-cases suggested by the maps’ creators. The maps, for one, address a monitorial citizen who is now also a collaborator of the administrative state, taking part in its management and oversight (Schudson, 1998). ‘Get Involved!’ says the scrolling text on the CleanStat index map. ‘You can help by scheduling a bulky item pickup, reporting illegal dumping or volunteering for one of our community clean-ups’. The citizen who might respond to these open data maps is less an antagonist than a co-conspirator and co-auditor of the City working alongside its civil servants to bring about better service. Ruppert (2015: 137) has described these citizens as ‘data publics’, who act as ‘data analysts and interpreters enrolled in a citizen science of government’. With the Vision Zero maps, for instance, a user can click on their address to see if their neighbourhood or child’s school is within a High Injury Network, then use that knowledge to advocate to the Vision Zero program for new bike lanes or parklets that reduce collisions.
Another audience type is the ‘entrepreneurial’ citizen, a term Irani (2015) uses to describe civic hackers who build applications, often drawing on open data, to address political or civic problems such as traffic and water conservation. On the Vision Zero website, users are told they ‘can explore, visualize, and download Vision Zero’s location-based Open Data, as well as use and develop web and mobile applications that support this initiative’. The entrepreneurial citizen participates through a material practice of making and tinkering with software; she has specialised technical skills for coding, software design, data cleaning, and analysis.
Finally, the third audience type is the active citizen who will organise civic activity around the maps’ findings. An example of how the maps aim to build publics can be found with a final example, the Controller’s PropertyPanel LA map (Figure 5), an open data account of all city-owned property assets, ranging from parks and libraries to vacant land, commercial properties, and residential buildings. 16 Before the map, ‘the City did not know what it owned’, an employee told me. 17 The Controller’s office tracked down all the city-owned real estate details over two years, turning up over 9000 holdings and revealing the City as one of the largest property owners in the country (Poston and Walton, 2016). The public-facing aspect of the project is important, said the employee, in order ‘to work with non-profits and academics and companies that have a stake in public property’. 18 The Controller now collaborates with neighbourhood land trusts to prioritise vacant lots in their communities, and the office is assessing if holdings can be converted to affordable housing. The office also partnered with the non-profit, LA Open Acres, to host pop-up events and design community gardens in vacant lots in the historically poorer South Los Angeles neighbourhoods. In this instance, staff used the map to bring together publics to reclaim urban space.
In all of these cases, the City presents its data-driven projects as democratic and collaborative. The maps make the case that rational, technocratic policy can be democratised; they set up a relationship in which government and citizens are in alignment, sharing an epistemological orientation towards administrative problem solving that begins at the same point – one framed by the administration’s datasets. For instance, Vision Zero frames the problem of bicycle and pedestrian deaths as one of pinpointing high-injury intersections that can be redesigned, but this is only one way to frame the problem. Another framing might demand that Los Angeles City reduce its number of cars overall. The citizen addressed by these maps is therefore very different from one who presents versions of the City’s performance through alternative frames or through metrics that provoke controversy and grassroots calls for change. Take, for instance, the Urban Displacement Project run by researchers at the University of California, Berkeley, the University of California, Los Angeles, and Portland State University. The project centres around digital maps of Los Angeles, Portland, and the Bay Area that show the increasing levels of gentrification, leading to displacement through eviction and lack of affordable housing. The key difference between this project and the City’s maps is not that the former is highly critical – the domestic violence map created by the Controller’s Office was itself very critical of the state of domestic services in Los Angeles – but that the framing of the problem is citizen-led and is used to contest issues, not to collaborate with administration on issues already selected and framed. 19 Another alternative act of citizenship is one that altogether resists the City’s pursuit of data-driven efficiency, which has led to monitoring and tracking citizens in more and more granular ways, as the grassroots group Stop LAPD Spying (2018) has adeptly revealed and challenged. So, while the City’s performance aims to engender a particular set of relations between City and citizen, other, more contestational forms of citizenship are possible and happening already.
Performing through open data maps – Main findings
This paper has argued that cities now draw on a new type of impression management in the form of dynamic open data maps. Administrations use these maps to show citizens that the city is currently making decisions based on data analysis, and they address a type of citizen who will collaboratively monitor the city’s progress and make use of the underlying data. I have also argued that these maps are both performative – staff use their underlying data and subsequent analysis to make changes in services and monitor policy goals – and they are performances – they present a particular image of city administration as competent, trustworthy, and open to citizen feedback. Displaying data used to make decisions and set policy shows an evidence-based approach to activities that offers institutional legitimacy, such that the mechanisms of calculating power confer authorising power.
I have drawn liberally from Goffman’s description of performance techniques to tease out some of the ways this performance is carried out. The ‘cultural valence’ of data provides a front to signal efficiency and politically neutral decision-making. The maps also have a promissory character: they are a record of past and anticipated decisions that city staff can be held accountable to. The maps are nonetheless idealised versions of city processes, and they engage in mystification; while they claim to be open, the construction processes of the data, how often it is updated and put to use in administrative offices, can never be fully transparent to citizens. The maps do not reveal the city so much as mediate it through new forms that reflect cultural imaginaries around data and bureaucracy.
Finally, the city’s performance – its public relations – through these maps engages a particular type of audience. Whether or not these monitory or entrepreneurial publics come into being through the map is not of so much consequence here; the performance of addressing citizens in this way does enough symbolic work for the City to claim an empowering transparency agenda in which citizens collaborate with administration. Further, City staff invite these citizen subjects to engage with the City on problems already specified in advance, rather than from a place of contestation about what societal issues are most pressing and how to frame them. This citizen subject is also at odds with the disempowering data collection of individuals and groups by the state and commercial companies for purposes of surveillance, profit, and control.
Datafication now may take the form of impression management by showcasing the workings of government bureaucracy; the maps discussed here strive to present data analysis as a new form of administrative auditing through civic participation in local government. Yet this work does not reveal so much as perform the City’s administration as a certain type of bureaucracy, one that must now weigh the ethical concerns of data collection against the glossy promises of analytics in the big data era.
Footnotes
Acknowledgements
Special thanks to my interviewees in the departments of Sanitation, Transportation and the Controller’s Office.
Declaration of conflicting interests
The author(s) declared no potential conflicts of interest with respect to the research, authorship, and/or publication of this article.
Funding
The author(s) received no financial support for the research, authorship, and/or publication of this article.