
Abstract
Scholars are becoming increasingly interested in whether and how government use of Big Data will affect public policy outcomes. Despite such growing scholarly interests, however, little evidence exists on the role Big Data can play in improving government service. We undertake one of the first quantitative studies revealing the potential utility and limitations of “Big Data-based policymaking” by exploring its recent use by the Seoul Metropolitan Government. In 2013, the government introduced the “Owl Bus”—a late-night bus system—the routes of which were selected based on government analyses of Big Data relating to citizens’ late-night taxi and mobile phone use. The findings suggest that the average number of passengers utilizing the Owl Bus routes was significantly greater than that on other daytime bus routes with comparable characteristics. That said, we also present the potential limitations of evidence-based policymaking in general, especially when politics and equity considerations are factored in.
Introduction
There is growing optimism that government use of Big Data—the massive amount of digital data collected from various sources—will make public policymaking more citizen-focused by taking citizen preferences into account more accurately than before (Batty, 2013; 2016; Clarke and Margetts, 2014; Kim et al., 2014; Kitchin, 2014a; Malomo and Sena, 2017; Manzoor, 2015; Margetts, 2012; Margetts and Sutcliffe, 2013; Poel et al., 2018; Taylor et al., 2014). 1 Policymakers can directly observe the choices of citizens as recorded by a variety of digital systems, including mobile devices, social media, and the Internet. These observations may be used to infer citizen preferences, thereby helping policymakers implement policies that maximize their intended benefits.
However, there are also voices that cast doubt on the utility of Big Data analyses. Some scholars have raised concerns that the large amount of data analyzed by governments is often non-representative of the entire population (Ash et al., 2018; Dalton et al., 2016; Shearmur, 2015). This is because data are often generated through a non-random sampling or based on a relatively small number of people within the population (Robertson and Feick, 2018). More generally, policymaking based on such data may incorporate only limited kinds of observations, while ignoring the wider consequences of politics, culture, and governance that shape the lives of the citizenry (Kitchin, 2014a). Further, there are also concerns that evidence-based policymaking may be conducted by a small number of technocrats or corporate interests that understand the technical aspects of the analyses better than do most citizens (Kitchin, 2014a; Zook, 2017).
Despite such growing scholarly interests, however, there is little empirical evidence on the role Big Data can play in improving government practices associated with the delivery of public services. In this study, we explore the recent use of Big Data in the public policymaking of the Seoul Metropolitan Government (hereafter, “Seoul Government”) in order to gauge the potential of this increasingly rich data environment. The Seoul Government has actively experimented with the application of Big Data in several policy areas and, in September 2013, implemented the so-called “Owl Bus”—a bus system that operates from midnight to 5:00 a.m. Specifically, the Seoul Government cooperated with a major Korean telecom corporation to access data regarding citizens’ late-night use of mobile phones, based on which specific bus routes were selected to maximize citizens’ use of the bus system.
The Owl Bus has been hailed by news media as an example of the successful application of Big Data in improving urban policies and the lives of citizens. Unfortunately, however, its launch was not without issue. Among the many existing concerns raised against Big Data (Batty, 2016; Kitchin, 2014a; Zook, 2017), several politicians have focused on the efficiency issue, criticizing the new bus system as a populist policy that benefits current citizens (and the mayor himself) at the cost of future generations who will have to repay the city’s increased debt through additional taxes. This criticism is based on evidence that the Seoul Government has provided significant annual subsidies (i.e., approximately 200 million USD) to bus operators to cover losses resulting from the new operations. The dispute can thus be narrowed down to the efficiency gains of the Owl Bus and whether this new late-night bus system has created sufficient demand to justify its operating costs. An empirical investigation into this dispute is a challenge because bus operators do not release their route-level revenues and costs. Nevertheless, we provide some indicative but compelling evidence that may be helpful to evaluate the efficiency implications of this new policy and the potential gains from the use of Big Data in the public sector.
To be clear, this study focuses on efficiency among many possible goals of public policy (i.e., whether and to what extent the use of Big Data may improve the efficiency of public service). In this study, we define efficiency as the ratio of service output to input, as measured by the ratio of passenger flows (i.e., the total number of passengers boarding and alighting from the bus at each bus station) to the number of bus runs. This study thus examines whether station-level passenger flows per run are greater for routes selected using Big Data than for other routes. To analyze this, we compare station-level passenger flows per run between the late-night Owl Bus routes and other (i.e., daytime routes) bus routes that have comparable characteristics. Although the daytime bus service is not a sufficiently valid counterfactual that can explain what the overnight bus service would have achieved without the government’s use of Big Data, this simple analysis can still provide insights into the debate on whether the implementation of the Owl Bus has contributed to the efficiency of the city bus service in Seoul.
Overall, our findings suggest that during 2015–2016, the average number of passengers per run was significantly greater for the Owl Bus service than for other daytime bus services with comparable characteristics. Specifically, station-level passenger flows were approximately 23–33% greater for the Owl Bus than for three control groups we created using various daytime route sets. To be clear, our analysis does not provide direct evidence of whether or to what extent the use of Big Data has contributed to the success of the Owl Bus service. However, the results reveal a remarkably clear difference in passenger flows between the Owl Bus and the control groups. Such evidence suggests that the implementation of the Owl Bus service positively contributed to improving the average efficiency of city bus operations.
Notably, we also find that the Owl Bus service has a higher variation in the number of passengers than do the control groups. Apart from a significantly greater number of passengers per run, the variations (as measured by standard deviations) in the number of these passengers were also much larger in the Owl Bus routes than in the three control groups. This evidence indicates that there is a still potential for Big Data to further improve public service efficiency.
This study extends several findings of past scholarly work. First, it contributes to the literature that examines the potential role of new technology or data-rich environments in management and public policymaking (e.g., Bollier and Firestone, 2010; Brady, 2018; Bright and Margetts, 2016; Clarke and Margetts, 2014; Cook, 2014; Einav and Levin, 2014; George et al., 2014; Guerrero and Lopez, 2017; Khoury and Ioannidis, 2014; Mergel et al., 2016; Michael and Miller, 2013; Schintler and Kulkarni, 2014). Second, it helps promote research that analyzes the role of Big Data in urban policymaking, such as its implications for “smart cities” (Glaeser et al., 2016; Kitchin, 2014b; Meijer and Bolívar, 2016; Thakuriah et al., 2017; Yeh, 2017; Zook, 2017). Finally, the results of the present study have implications that could benefit data- or evidence-based policymaking (e.g. Lavertu, 2016) and, more broadly, promote the use of new technology in governments (e.g. Criado et al., 2013).
The late-night owl bus service in Seoul metropolitan city
In 2013, the Seoul Government experimented with the use of Big Data in policymaking by introducing the Owl Bus system. 2 In fact, the government had considered launching a late-night bus service as part of its policy agenda in 2011, but it was not implemented until the end of 2012 because the government was unsure whether there would be sufficient demand for the service. For 19 days in December 2012, the Seoul Government extended operations of the city bus system for an extra 2 hours until 2:00 a.m. After the 19-day experiment, the city government analyzed citizens’ responses and evaluations of the policy as expressed on various social media platforms, including Facebook and Twitter. To verify the potentially significant demand for the service, in April 2013, the Seoul Government initiated a pilot late-night bus system with two bus routes; this system was expanded to the current Owl Bus service in September 2013.
The Seoul Government claimed that significant efforts were made to select routes for the Owl Bus system that would maximize citizens’ use of the service. The city government took advantage of Big Data from two different sources: data on overnight taxi usage and access to mobile devices. Specifically, the government cooperated with a major Korean telecom corporation to analyze five million late-night taxi trips and three billion cases of mobile phone access from midnight to 5:00 a.m. in order to predict routes as well as operation intervals that would maximize efficiency (i.e., facilitate the greatest number of passengers per bus trip). The utility of mobile phone call data for analyzing and predicting traffic flows is well reported in prior research (Järv et al., 2012, 2014).
Figure 1 illustrates the overall process by which the Seoul Government determined the optimal routes and intervals of the Owl Bus service. First, the entire city area was divided into 1250 cells of identical sizes. Then, location data from citizens’ late-night mobile phone usage were analyzed to estimate the population density (i.e., potential bus passengers) of each cell. In Figure 1(a), areas with high population density are presented in red. Second, for each cell, the weighted average of population density was calculated by considering the population of adjacent cells. The change in this estimated population density over time was used to infer the origin-destination population flow. Then, the government selected the routes that were expected to have the greatest number of passengers based on spatial optimization using the population flow of an area with a 1 km radius. In Figure 1(b), the selected route is presented as a green line. Third, the government predicted the volume of traffic at each bus station, which was used to determine the time interval between runs. In Figure 1(c), the predicted volume of traffic is presented in accordance with the width of the route.
The process of the utilization of Big Data. (a) Estimation of population density; (b) determination of the bus routes; (c) determination of the interval between bus runs. The figures are provided by the Seoul Metropolitan Government; more information can be found at the following website, https://zeronova.kr/2013/08/07/seoul-bus-route-optimization/.
Despite the careful analyses performed, critics were skeptical about the utility of Big Data. Their primary concern was its non-representativeness, which could undermine the credibility of any analyses using the data. Although late-night mobile phone usage data may be used to extrapolate the size of population in the area using late-night taxi services, they may not necessarily represent the demands of citizens with regard to the late-night bus system (Kitchin, 2014a). That is, Big Data analyses clearly cannot convey the actual demands for the policy; they merely convey the proxy for the demands. The critics would thus argue that the data analyses may fail to provide accurate advice to policymakers. On the other hand, the proponents may still advocate the use of evidence-based policymaking, arguing that although Big Data cannot accurately capture the real world, policymakers can still draw some valuable insights from it. In what follows, we thus weigh the validity of such competing views using the recent case of Big Data-based policymaking in Seoul, South Korea. We focus on one specific goal of public policy—efficiency—to shed light on the potential uses and limitations of Big Data analyses in the public sector.
Methods and data
This study analyzes the Owl Bus experiment initiated by the Seoul Government to examine the potential utility of Big Data in the public sector. Our empirical strategy is to compare station-level passenger flows between two groups: (1) those who use the Owl Bus routes, which are determined based on a careful analysis of potential demands using Big Data; and (2) other daytime bus routes that are comparable to the Owl Bus routes based on a number of characteristics. The dependent variable—station-level passenger flows per run—is measured by dividing the total number of passengers boarding and alighting from the bus at each station by the number of bus runs. Our observations of the number of passengers (i.e., the total number of those boarding and alighting from the bus) per run were thus made at the route-by-station level. Specifically, the model used in this study is as follows

Here,
Equation (1) compares the passenger flows between the Owl Bus and the daytime bus systems. One drawback is that routes taken by the Owl Bus and all the other daytime buses may have vastly different characteristics that are unobservable to researchers. To alleviate this concern, we created the following three control groups (i.e., three subsets of daytime bus routes) that may have characteristics similar to those of the Owl Bus routes. The first control group includes daytime bus routes that intersect one of the Owl Bus routes. This is because the Owl Bus tends to ply across the most populated areas in Seoul, and it is not a fair comparison if the control group’s buses do not do the same. The second control group imposes another restriction. Among the routes constituting the first control group, we selected those only from the Seoul trunk system, of which the Owl Bus is a part. The third control group is the most selective. Among the routes in the second control group, we chose those operated by the same company that operates at least one of the Owl Bus routes because operating companies may have different characteristics (e.g., driving policies) and if not properly controlled, these differences may bias the results. In sum, our main empirical strategy is to compare station-by-route level passenger flows between the Owl Bus and each of these three control groups (hereafter, control groups 1, 2, and 3).
The data used in this study were collected from a number of public websites. The station-level number of passengers who boarded or left a bus on a particular date was drawn from the Seoul Open Data Plaza, a public website maintained by the Seoul Government. Our observations relied on a two-year period dataset comprising data recorded from January 2015 to December 2016. The main analyses (with the exception of that for the “day of the week” variation, which will be explained below) were performed at the monthly level (rather than at the daily level) owing to the capacity of the statistical package we used. The station-level passenger flows by hour of the day were also drawn from the same website but as a separate dataset. Lastly, characteristics related to the bus routes, including the duration of operation, interval between bus runs, daily number of bus runs, name of the operating company, and type of bus route, were collected from the Seoul Public Transportation website maintained by the Seoul Government and merged with the passenger flow data.
Results
Average number of passengers per run
We begin our analysis by presenting histograms that depict the number of passengers per run (see Figure 2). In Figure 2(a), we show the distribution of passenger flows for the Owl Bus route, while in Figure 2(b)–(d), we demonstrate the distribution for control groups 1, 2, and 3. The key statistics (i.e., the number of observations, mean, standard deviation, maximum values, and minimum values) associated with the histograms are presented in Table 1. Two things become immediately apparent from the comparison of the four histograms and the associated statistics in Figure 2 and Table 1, respectively. On average, the Owl Bus routes had a significantly greater number of passengers per run than did any of the three control groups. However, the variations (as measured by standard deviations) in the number of passengers per run were much larger in the Owl Bus routes than in the three control groups.
Comparison of the distribution of passenger flows. (a) Owl Bus routes; (b) control group 1; (c) control group 2; (d) control group 3. Vertical lines represent the mean values of the passenger flows. Comparison of passenger flows.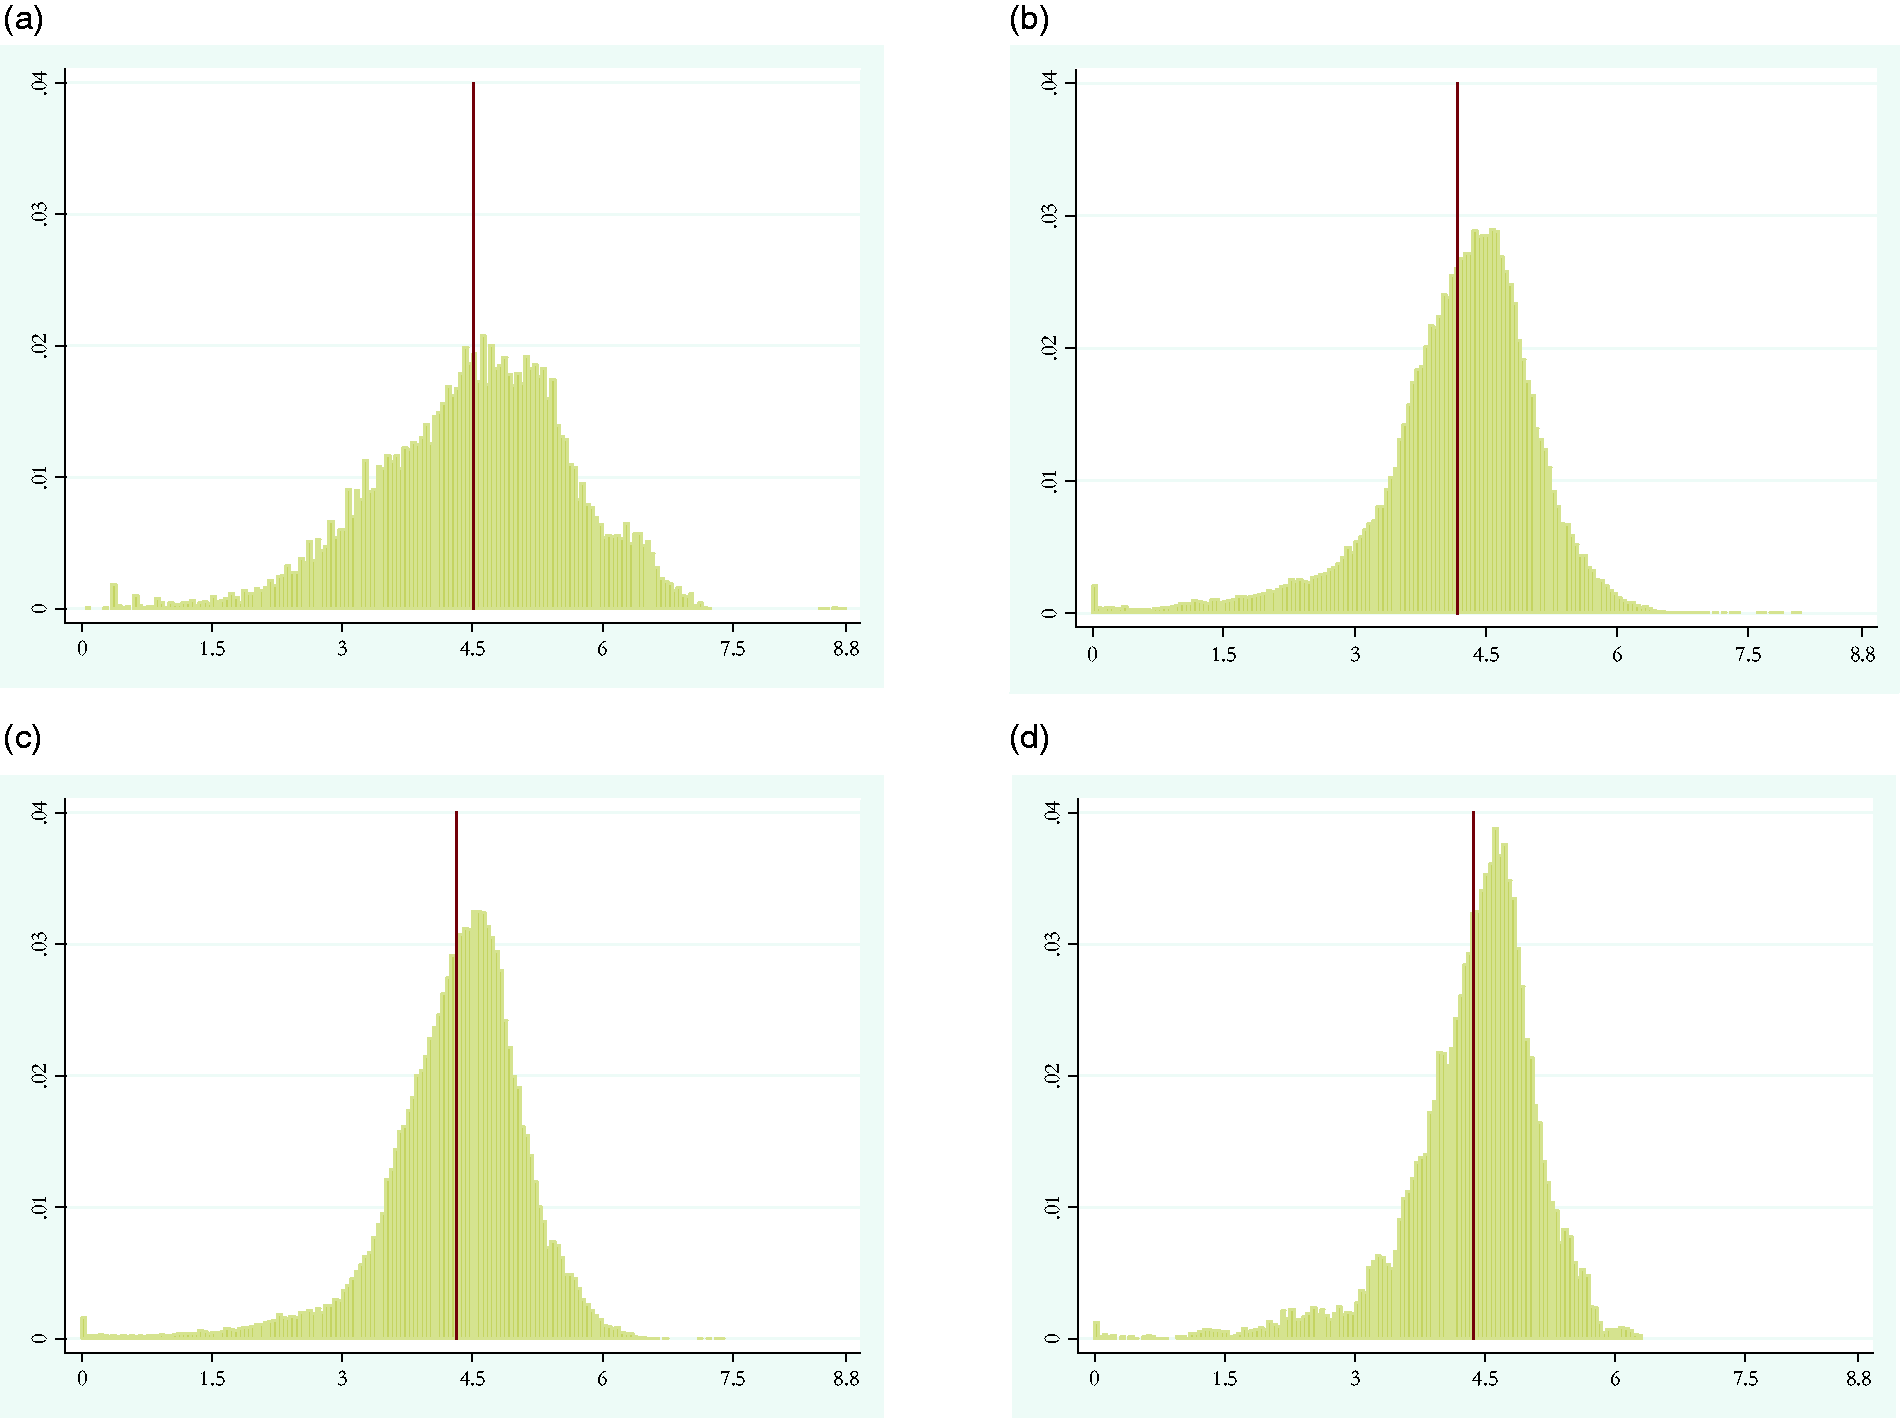

Comparison of passenger flows: Owl Bus vs. control groups.

p < 0.05.
Standard errors in parentheses. All models include nonparametric monthly time controls, route, and station fixed effects. Due the difference in how we defined each of the three control group, the bus route type variables (trunk, branch, circulation, and rapid) are included as covariates only in column 1, and the operating company indicators (i.e. fixed effect) are included only in columns 1 and 2.
Variation in the passenger flows
The results presented in Figure 2 and Table 2 not only indicate the remarkable success of the Owl Bus service but also suggest that there is room for improvement. In Figure 2 and Table 1, we notice that the variation in passenger flows is substantially larger in the Owl Bus routes than in any other control group, which suggests that the Owl Bus service is operated inefficiently in some circumstances.
In order to have a clearer understanding about the large variations in passenger flows, we investigated why the number of passengers in the Owl Buses differs across a number of variables. We first determined whether the passenger flows show large variations by hour of the day. Because the Owl Bus is operated from midnight to 5:00 a.m., Figure 3 presents histograms of the passenger flows for each hour between 1:00 a.m. and 4:00 a.m. We excluded the first and last hour of operation (i.e. before 1:00 a.m. and after 4:00 a.m.), as these buses do not operate at full capacity. The findings from Figure 3 suggest that the number of passengers per run is not noticeably different based on the hour of the day. Interestingly, the variations in passenger flows are similarly large for all 3 hours of operation (see Figure 3(a)–(c)).
Distribution of passenger flows of the Owl Bus routes, by hour of the day. (a) During 1–2 a.m.; (b) during 2–3 a.m.; (c) during 3–4 a.m. Vertical lines represent the mean values of the passenger flows.
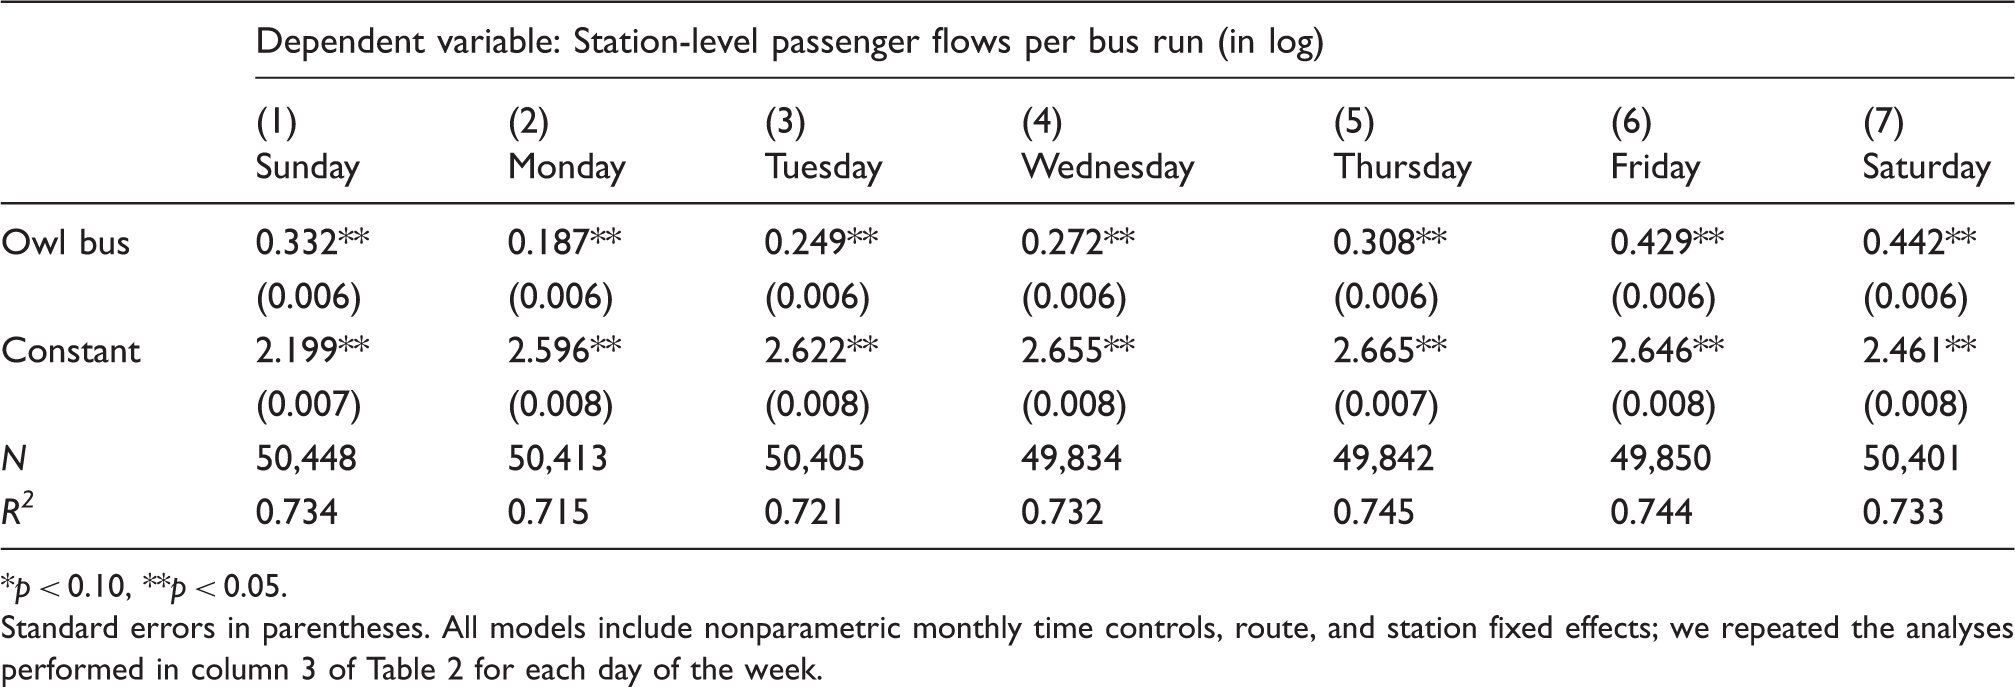
Second, we also explored the extent to which the number of passengers varies over time during the year (see Figure 4(a)) and by day of the week (see Figure 4(b)). As can be seen in Figure 4(a) and (b), our findings suggest that the number of passengers did not vary noticeably either over time or by day of the week. This observation is supported even when we compare the station-level passenger flows per run (with full fixed effects) between the Owl Bus and the other daytime bus routes. For instance, we repeated the analyses we performed in column 3 of Table 2 for each day of the week; the results are presented in Table 3. Although the coefficients vary, the Owl Bus routes had a significantly greater number of passengers per run throughout the week. The passenger flows per run were approximately 44% greater on Saturday for the Owl Bus than for the control groups. This figure becomes approximately 19% on Monday, but the late-night service still has a significantly larger number of passengers than a comparable daytime service.
Total passenger flows over time and by day of the week. (a) Over time; (b) by day of the week. One route (N65) was excluded from the analysis as we could not collect enough data (the route started its operation on 28 November 2016). Comparison of passenger flows by day of the week: Owl Bus vs. control groups. p < 0.10, **p < 0.05. Standard errors in parentheses. All models include nonparametric monthly time controls, route, and station fixed effects; we repeated the analyses performed in column 3 of Table 2 for each day of the week.
Comparison of passenger flows: Owl Bus (only line N30) vs. control groups.

p < 0.10, **p < 0.05.
Standard errors in parentheses. All models include nonparametric monthly time controls, route, and station fixed effects. Due the difference in how we defined each of the three control group, the bus route type variables (trunk, branch, circulation, and rapid) are included as covariates only in column 1, and the operating company indicators (i.e. fixed effect) are included only in columns 1 and 2; circulation type indicator is not included as none of the circulation type routes intersect with line N30.
The large variation across serviced routes
The results suggest that the Owl Bus service has had a greater number of passengers per run than other daytime bus routes with comparable characteristics. Such findings may overshadow the criticism that the Owl Bus service is a populist policy that undermines the fiscal stability of the city government. Our evidence suggests that, contrary to the skeptics’ expectations, the Owl Bus system has been, on average, more efficient in its operations than have daytime bus routes with comparable characteristics.
What is puzzling, however, is the evidence of a large variation in the number of passengers across the Owl Bus routes (see Figure 4). The primary benefit when public administrators rely on Big Data is a reduction in the risk of policy failure in the face of uncertainty. In the case of the Owl Bus, we expect that the availability of Big Data will assist city government officials in choosing optimal routes for the Owl Bus service so that the average expected number of passengers would be maximized while, simultaneously, any variance would be minimized. If such reasoning holds true, then the evidence showing that one Owl Bus route lags far behind in terms of the number of passengers is an unexpected anomaly.
In order to examine the potential contributing factors, we conducted interviews with three city government officials. All three interviewees as of January 2017 worked at the City Transit Headquarters of the Seoul Metropolitan City Government, the department responsible for the city’s transportation policymaking. They all occupied (currently or formerly) positions closely related to the city’s urban bus service and the Owl Bus service. Before the interviews, we sent a formal introductory letter to each interviewee explaining the aims of the research. In the letter, we outlined the questions that would be asked during the interview along with evidence of the substantial variation in the number of passengers across the Owl Bus routes. The interviews were semi-structured as we decided on the specific wording and sequence of the questions during the course of the interview, as required. The two main questions included in the introductory letter were as follows: (1) What are the main factors contributing to the large variation in the number of passengers across routes? (2) If the main benefit of relying on Big Data is to reduce uncertainty in policy outcomes, a policy based on Big Data analyses should have a smaller riation in the outcomes. How, then, can the city government explain the apparent conflict between the claimed utility of Big Data-based policymaking and the unusually large variation in policy outcomes across the Owl Bus routes? The interviews were conducted in January 2017, took an average of 2 hours each, and were transcribed. 4
After the three interviews, we realized that the answers from the three different public officials were remarkably similar. Their views were straightforward; equity consideration factored into the decision-making process. The utilization of Big Data on citizen behaviors was certainly very useful in selecting optimal bus routes that would maximize the expected number of passengers. However, one problem was that most of the profitable routes generally (though not necessarily) connect downtown to the Gangnam areas, which are high-income neighborhoods. Thus, if the government had introduced only routes that were deemed profitable, then citizens in many low-income neighborhoods would have been marginalized, which is where equity considerations come in. For instance, one interviewee explained: The big data analyses tell us that late-night traffic is the highest in the (wealthy) Gangnam areas. Some may call it politics and others may call it justice, but governments cannot introduce late-night bus routes only in those areas, even if doing so would be the smartest way to spend public money from an efficiency point of view.
Conclusion and discussion
In this study, we examined whether the bus routes (i.e., the Owl Bus routes) selected based on the demand predictions from the use of Big Data analyses achieved a greater level of efficiency than other comparable bus routes. The findings indicated that for 2015–2016, the average number of passengers per run was significantly greater for the Owl Bus service than for other comparable daytime bus services. Specifically, the station-level passenger flows were approximately 23–33% greater for the Owl Bus than for the control groups we created using various sets of daytime routes. We also found that these advantages in efficiency were achieved throughout the week (i.e. from Sunday to Saturday); Saturdays recorded the greatest advantage with 44% larger passenger flows, whereas Mondays recorded the lowest with 19% larger passenger flows.
Our findings suggest that the Owl Bus service achieved success in terms of efficiency. The evidence still shows, however, some potential for further improvement as the variation in passenger flows was substantially larger for the Owl Bus service than for comparable sets of daytime bus service. The large variation seems to be partly because of the different levels of efficiency achieved across the serviced routes. Out of the eight routes operating as of the end of 2016, one had a substantially lower number of passengers per run—approximately 64–96% lower than comparable sets of daytime bus routes.
In order to gain further insight, we conducted interviews with three city government officials who participated in the establishment and operation of the Owl Bus service. The results of our interviews lead us to conclude that government use of Big Data has serious potential to make public policymaking more citizen-focused by more accurately deciphering citizen preferences. Evidence-based policymaking may provide the government with more accurate information thereby reducing the risk of bureaucratic institutions being captured by the elite or those with vested interests. It may also reduce the uncertainty about the expected effects of government policies and help persuade those who oppose them.
Despite these benefits, however, this study’s findings also suggest that the government’s use of Big Data is certainly not a panacea. Democratic institutions are governed by politics and, more often than not, political considerations of some policy goals may overrule the outcomes of data analyses. In the case of the Owl Bus, evidence of the large variation in the number of passengers across routes may be attributable to the government’s consideration of equity. The most profitable late-night bus routes generally connect downtown and high-income neighborhoods. From an equity point of view, however, the government could not implement the service only in those areas. If it did, low-income neighborhoods would be further marginalized and the already unequal regional distribution of public infrastructure would have been exacerbated. This is why governments sometimes make decisions that conflict with evidence guided by the analysis of Big Data. That is, as policymakers often consider not only efficiency but also equity in making their decisions, the general existence of the tradeoff between these two primary goals of public policies may lead them to sacrifice one to improve the other (Okun, 2015).
To be clear, the policymakers in the Seoul Metropolitan Government may have considered a wide variety of goals in deciding whether to implement the late-night bus policy. We investigated efficiency because the Korean media and politicians focused on efficiency, producing competing evaluations of this policy; critics argue that operating a bus system late at night is a complete waste of public resources as there are insufficient demands for the policy, whereas proponents argue that the demands for the policy are large enough to compensate for its operational costs based on Big Data analyses. This study provides an empirical analysis that weighs these competing arguments, showing the potential utility of Big Data-based policymaking.
Before we conclude, we must note the limitations of our study. This study presents evidence supporting the potential utility of policymaking based on Big Data analyses. However, we admit that, in some cases, Big Data may not contribute to our understanding of how the world works. For instance, the vast amount of available information may lead to our inability to separate facts from fake information (Shenk, 1997). Further, as reported in past literature, the large amount of data collected for analyses may be biased and problematic (Batty, 2016; Kitchin, 2014a; Zook, 2017). Specifically, Big Data may not be representative of the whole population (Kitchin, 2014a). In the case we studied, citizens’ late-night taxi and mobile phone use data may serve only as a proxy, rather than represent the actual demand for the late-night bus service. This issue may have contributed to the considerable variation in the performance across bus routes. There are also concerns that, when the data analyses are outsourced to corporations, policy decisions may be shaped by a specific type of ideology (e.g., neoliberalism), tied to corporate interests (Zook, 2017). There are also many critical issues related to data infrastructure management, including privacy, security, confidentiality, and intellectual property. Future research, especially some in-depth case studies, could enhance our understanding of Big Data and policymaking by taking a broader view that encompasses these potential uses and limitations.
Footnotes
Declaration of conflicting interests
The author(s) declared no potential conflicts of interest with respect to the research, authorship, and/or publication of this article.
Funding
The author(s) disclosed receipt of the following financial support for the research, authorship, and/or publication of this article: Funding was provided by National Research Foundation of Korea (NRF-2017S1A3A2067636).