
Abstract
Social scientists and data analysts are increasingly making use of Big Data in their analyses. These data sets are often “found data” arising from purely observational sources rather than data derived under strict rules of a statistically designed experiment. However, since these large data sets easily meet the sample size requirements of most statistical procedures, they give analysts a false sense of security as they proceed to focus on employing traditional statistical methods. We explain how most analyses performed on Big Data today lead to “precisely inaccurate” results that hide biases in the data but are easily overlooked due to the enhanced significance of the results created by the data size. Before any analyses are performed on large data sets, we recommend employing a simple data segmentation technique to control for some major components of observational data biases. These segments will help to improve the accuracy of the results.
Introduction
Social scientists and data analysts are increasingly making use of Big Data in their analyses. These data sets are often “found data” 1 arising from purely observational sources rather than data derived under strict rules of a statistically designed experiment. However, since these large data sets easily meet the sample size requirements of most statistical procedures, they give analysts a false sense of security as they proceed to focus on employing traditional statistical methods. We explain how most analyses performed on Big Data today lead to “precisely inaccurate” results that hide biases in the data but are easily overlooked due to the enhanced significance of the results created by the data size. Before any analyses are performed on large data sets, we recommend employing data segmentation techniques to control for some major components of observational data biases. These segments will help improve the accuracy of results.
Big Data’s problem of being precisely inaccurate
The sort of Big Data that analysts and social scientists frequently use in their research can be described as “found data” which is composed of observational data collected on website traffic, sensor data, or any large-scale source of user activity. This data is often labeled as “big” because it can easily contain many millions of records reflecting user behaviors on a website such as viewing, clicking, downloading, uploading, evaluating, and purchasing of digital resources. In most cases, these data are snapshots of time that are collected on an entire sample of individuals who are active in that particular moment. Examples of this sort of data are website log files or traffic data, social media data dumps (e.g. Twitter, Facebook, LinkedIn, etc.), online professional networks (e.g. where teachers learn about jobs and post teaching resources), or even massive open online courses with user interactions and performance (e.g. Coursera). As cell phones and wearable devices begin to collect sensor data, Big Data will only get bigger and the problem referenced in this article will only continue to become more amplified and more prevalent.
Ironically, we are taught in statistics classes that “more data is better”. However, the size of today’s “big” data has made it cumbersome to work with and prevents most researchers from performing basic data due diligence. Meanwhile, with the rise of open source data, analytic program have made it increasingly simple to ingest enormous datasets and perform statistical analyses. Most statistical tests employed by these programs are based on test statistic calculations of the form:
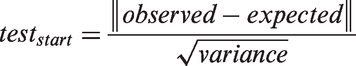

The key thing to note is that the sample size in the denominator and, as a result, Big Data often produces extremely small variances (essentially zero). This leads to very large test statistics and thus extremely statistically significant results. 2 In addition, the large sample size makes these tests very sensitive, producing a surplus of statistically significant results, which, from a researcher’s perspective, are far more interesting to study than questioning the basic principles of data collection. These highly significant results caused by near-zero variances give the researcher a false sense of precision.
The sheer size of Big Data can also lead analysts to confuse it with the statistical ideal of a “population” whereas, in fact, it is a very biased sample. Since observational data from online sources are not derived from statistically rigorous designed experiments, they often can contain many types of biases.
One form of bias encountered in web data is population bias. Many researchers treat their Big Data as a “census”, meaning that it is a complete and representative collection of the entire population. However, in many cases it can contain a misrepresentative mixture of subpopulations. For example, websites (and consequentially the data from them) are frequently trolled by “robots” which are computer programs designed to behave like users, but they are instead collecting data from web pages. Data collected from social websites, for example, can over-represent certain user groups and include some pages that are not even people at all (fan pages).
Another major form of bias encountered in web data is referred to as “activity bias”. 3 This arises because the data collected is skewed to the users who are active on the website during the measurement period. Since most users show up once to a website and never return (at least not in the observed window of time), the conclusions drawn from the data are specific only to the sample of people active at that time. The size of the data, and the fact that they are often analyzing the whole database, leads a researcher to erroneously believe that they have an entire, statistically representative population. The hidden biases in Big Data have the dangerous potential of causing a researcher to draw conclusions that are far from the truth.
A recent example of this can be observed in the use of Google search data to assess peak flu levels. In 2009, Ginsberg et al. reported that a model was developed using over 50 million Google search terms to predict weekly flu cases in the US. It predicted flu cases more precisely than the Center for Disease Control and was touted as an excellent example of the usage of Big Data. However, the model began over-reporting flu levels as soon as 2011 – as high as double the number of actual cases (Butler, 2013; Lazer et al., 2014). The model was dependent for its precise calibration on a large set of search terms that were active at the time the model was developed. As small deviations in the search terms of the massive Google user base began to occur, the model quickly became precisely inaccurate.
To summarize: the use of found data and standard statistical procedures that rely on typical statistical assumptions tends to produce a large number of statistically significant effects for what really may be a non-representative subpopulation. All too often these sorts of analyses will afford precisely inaccurate results.
Using data segmentation to address inaccuracy
In this section, we will propose a set of strategies that can be employed by the analyst to overcome some of the aforementioned issues of Big Data analysis. While these suggestions will not remove all the errors found in the analysis of Big Data, they will at least force one to think more deeply about the hidden dangers in the data before blindly skipping to the analysis phase. And, in all cases, they will improve the quality of the analysis.
One could argue that the more flagrant error in being “precisely inaccurate” is the imprecision produced by a biased sample. So, we suggest addressing this by performing a simple segmentation analysis of the data to help to control for the fact that the sample entails a mixture of populations. 4 In many regards, this is a well-known problem in statistics when analyzing observational data in an effort to make it more representative of the population. This sort of analysis is done when one first applies community detection algorithms (Leskovec et al., 2010; Yang et al., 2013) or even segmentation techniques used in database marketing (Blattberg et al., 2008; Bult and Wansbeek, 1995; Derya, 2011; Shih et al., 2003; Wei et al., 2010). The former segments users on the locus of their activity (in, say, different foci; see Feld, 1981), while the latter segments users on the quality of their activity. While the use of both in tandem may be advisable (i.e. segmentation on locus and level of observed activity), for the sake of brief exposition we will focus on the latter as it is likely less familiar to a social science and data analyst audience.
It has been our experience, having analyzed data sets from online and digital sources, that the data tends more often than not to be biased to the set of individuals who are active in the period being measured. In addition, the majority of these individuals take very few actions (rare events) while a very small set of them are extremely active. By contrast, past sampling strategies collected panel data on individuals’ reported (or observed) activities and concerns within regular units of time. With the biases of big (“found”) data, individuals have their daily life activities and concerns represented at drastically different levels, thereby introducing bias. The naïve analysis performed on the entire data set can easily produce skewed results depending on which mixture of populations is predominant in the data at the time.
Therefore, we propose that many found data sets could benefit from a clustering of participant activity into like segments based on recency (R), frequency (F), and value (M, as it is sometimes referred to, as monetary value). 5 This technique clusters the data into groups of individuals who have similar tenure, visit at similar frequencies, and perform similar valued actions. In particular, clustering users on the recency and frequency of their visits is a powerful activity bias manager, letting researchers compare persons at the same activity level or persons evidencing their actions and orientations at the same level. Likewise, community detection techniques identify sets of users engaged in the same parts of a site or with the same sets of others. If one segments “found data” by community detection and activity levels, then they have identified distinct populations at distinct observed activity levels, and analyses can be performed within each of the segments.
By creating these segments, the researcher begins to see how their Big Data sample is skewed and in what manner. And they may perhaps even decide to perform the “best practice” of any experiment of repeating the analysis by collecting more data to adjust for the segment skew.
This article is part of a special theme on Colloquium: Assumptions of Sociality. To see a full list of all articles in this special theme, please click here: http://bds.sagepub.com/content/colloquium-assumptions-sociality.
Conclusion
In this article we describe how most Big Data is “found data” in social media and digital records. The sample size and bias to these data render naïve statistical analysis “precisely inaccurate”. As a means of partly rectifying the problem of “inaccuracy”, we propose data segmentation of populations in terms of their location and activity levels as a means of identifying and addressing bias.
Footnotes
Declaration of conflicting interest
The author(s) declared no potential conflicts of interest with respect to the research, authorship, and/or publication of this article.
Funding
The author(s) disclosed receipt of the following financial support for the research, authorship, and/or publication of this article: NSF award 1159679 and Stanford’s Center for Computational Social Science.