
Abstract
Although political trust is a long-standing interdisciplinary topic, the lack of com parable cross-national time-series data has limited scholars’ ability to analyze its determinants and consequences and to generalize findings across countries and over time. To address this gap, this paper introduces the Trust in National Government (TrustGov) Dataset—a cross-national time-series resource covering 115 countries and territories from 1973 to 2020, harmonizing 1,545 country-year observations from 189 national and cross-national surveys using a Bayesian latent variable model. The dataset is validated through a series of convergent and construct validity tests. TrustGov supports qualitative and mixed-method research by guiding case selection and helping scholars probe mechanisms behind shifts in trust. It also enables quantitative analyses of trust’s dynamic relationships with determinants such as inequality, election integrity, and institutional performance, as well as outcomes such as policy preferences and crisis resilience. The project will be updated regularly through periodic releases as new data become publicly available, supporting ongoing research on political trust.
Introduction
Trust is central to understanding political, social, and economic life. It is shaped by factors such as inequality, corruption, election integrity, and government performance, and in turn underpins regime support, influences policy preferences, and conditions public responses during crises such as COVID-19 (for reviews of trust’s dynamics, determinants, and consequences, see Levi and Stoker, 2000; Citrin and Stoker, 2018; Devine et al., 2021; Kerr et al., 2024).
Although trust is a contested term, a common view is that trust is relational—directed at specific targets, such as persons, groups, or institutions—and rarely unconditional (Levi and Stoker, 2000). Two main forms are political trust and social trust. Political trust refers to “trust in a specific actor or institution” (Devine, 2024), with proposed dimensions, for example, trust in representative versus implementing institutions, or trust in political institutions versus authorities (see more discussion at Tai (2022: 32–34)). Social trust refers to “trust in human targets” (Dinesen et al., 2020), including generalized social trust, particularized trust, and trust in specific groups.
Because political trust is essential to regime legitimacy, it has attracted extensive scholarly attention (Citrin and Stoker, 2018). Yet, despite its prominence, testing trust-related theories comparatively has been constrained by the lack of comprehensive cross-national, time-series data. Existing resources are often fragmented, limiting rigorous comparison of trust dynamics across political and regional contexts (Kerr et al., 2024). Much work focuses on a single country (often the U.S. or U.K.), and even comparative studies tend to concentrate on particular regions or democracies (Devine, 2024). As a result, scholars have limited leverage to examine how trust responds to governance performance, inequality, and corruption, and how it shapes regime support, voting behavior, and policy compliance.
To address this gap, I introduce TrustGov, a cross-national time-series dataset of public trust in national government covering 115 countries and territories from 1973 to 2020. Scholars propose different dimensional frameworks for political trust, and a full discussion of these approaches is beyond the scope of this paper. However, as with other comparative public attitude measures that lack multidimensionality (Hu et al., 2025), empirical measures of political trust are often blunt. Differentiating the object of trust helps capture its multidimensionality and supports future research (Devine, 2024). This dataset focuses on national government as a specific object of political trust because trust in national government has broad interdisciplinary relevance across public health, behavioral science, economics, law, public policy, and environmental studies.
Using a Bayesian latent variable model developed by Solt (2020b), TrustGov synthesizes various survey sources into comparable estimates, drawn from 189 surveys with 2,126 country year-item covering 48 years. In addition to mean estimates, I release full posterior draws so scholars can explicitly incorporate measurement uncertainty inherent in latent variable modeling. With its temporal and cross-national coverage, TrustGov facilitates comparative research on the causes and consequences of trust in government, advancing work on democratic governance, electoral behavior, policy development, and related areas.
Data and methods
Raw data
Although many national and cross-national surveys have asked questions about trust in national government, comparative data at the aggregate level is sparse and fragmented. This fragmentation is primarily due to limited coverage across countries and years, as well as inconsistencies in question wording and interpretation.
To construct a dynamic and comparable dataset, I systematically reviewed 189 unique survey projects spanning 115 countries/territories over 48 years. I identified 10 unique survey questions that captured public attitudes toward trust in national government. To improve comparability and reduce uncertainty from sparse data, I excluded rarely asked survey items.
In the country-years span, among the 2,648 country-years, 58% have available information. However, if we have observations for every year in each country surveyed, the total would be 5,405. In fact, even collecting as much available national and cross-national data as possible, the current source data has 1,545 country-years, which is 29% of a complete set of total country-years.
The left panel of Figure 1 maps the global distribution of observed country-years. European and Latin American countries have longer time series due to the frequent fielding of Eurobarometer and AmericasBarometer surveys, as well as strong scholarly interest in democratic and emerging regimes. In contrast, data from Asian and African countries is limited. The upper right panel further illustrates this geographical disparity: Germany leads with 54 country-year-item observations, followed by Spain and Finland. The lower right panel shows that few relevant survey items existed before 1990. Country coverage peaked in 2018, when respondents in 110 countries were asked about trust in government. Overall, although such questions appeared as early as the 1970s, they were not surveyed regularly or broadly until the 1990s, and coverage has remained geographically uneven. Countries and years with the most observations in the source data on trust in government.
In the next section, I describe how sparse and non-comparable survey data are harmonized into comparable time-series trust estimates using a latent variable model.
Measurements
Latent variable measurement assumes that the concept of interest is not directly observable but can be inferred from individuals’ responses to relevant questions. Recently, pioneering studies have developed latent variable models tailored to cross-national survey data (Caughey et al., 2019; Claassen, 2019; Kołczyńska et al., 2024; McGann et al., 2019). In this paper, I adopt the Dynamic Comparative Public Opinion (DCPO) model developed by Solt (2020b), which fits cross-national survey data better than leading alternatives (Caughey et al., 2019; Claassen, 2019) and handles sparsity without requiring dense coverage or auxiliary population characteristics (Kołczyńska et al., 2024; McGann et al., 2019).
The DCPO model addresses two principal challenges in the source data: incomparability and sparsity. To tackle incomparability across survey questions, the model includes two parameters. The difficulty parameter captures how much trust is required to endorse a response (e.g., “a great deal” vs “somewhat”), and the dispersion parameter indicates how sensitively responses reflect changes in the latent trust level. A lower dispersion value implies that a small change in responses corresponds to a substantial shift in the latent trait. Questions that are asked widely across countries and years anchor item parameters with greater precision, while rare items provide weaker information. By estimating item difficulty and dispersion and leveraging common items as anchors, DCPO maps responses from different questions and surveys onto a single latent scale, yielding comparable country-year estimates. Put differently, different questions are aligned onto the same scale, with widely asked questions stabilizing that scale.
To handle sparsity, DCPO adopts random-walk priors within countries, estimating missing latent values as the previous year’s trust level plus a small random shock. If a year lacks survey data, the estimate is informed by the most recent available data point in that country. Uncertainty increases as the time gap between observed years grows. As shown in Figure 1, the geographical and temporal distribution of raw data is uneven: European countries generally have dense time series, while African and Asian countries often have fewer observations. Consequently, estimates from data-rich contexts rely more directly on survey responses and carry less uncertainty, whereas estimates from data-sparse contexts carry greater uncertainty. Although the model smooths estimates over time to provide continuous coverage, uncertainty remains. This uncertainty propagates into downstream analyses, so results and inferences based on data-sparse contexts should be interpreted more cautiously. For details on the DCPO model, see Solt (2020b: 3–8). Approaches for incorporating this uncertainty are discussed later.
Using the DCPO R package (Solt, 2020a), I estimated country-year TrustGov scores.
Results
Figure 2 displays the most recent available TrustGov score for each of the 115 countries and territories in the dataset. China and several Central Asian countries dominate the top positions, consistent with previous research documenting high levels of trust in these governments (Byaro and Kinyondo, 2020; Paturyan and Melkonyan, 2024; Schneider, 2017). Less corrupt countries like Denmark and Switzerland also rank highly, while Libya, Tunisia, Venezuela, Iraq, and Brazil show the lowest recent scores. These lower-ranked countries faced serious challenges around the time of measurement, including corruption in Venezuela and Iraq, election-related violence in Brazil, and conflict or security threats in Tunisia and Libya. TrustGov scores, most recent available year (through 2020). Note: Countries are ordered by their TrustGov score in the most recent available year. Gray whiskers represent 80% credible intervals.
There are well-known concerns about the authenticity of self-reported data in authoritarian contexts, especially for sensitive questions (Blair et al., 2020). However, empirical evidence is mixed. Some studies find sensitivity biases are typically small (Blair et al., 2020), while others suggest systematic misreporting under certain conditions (e.g., Tannenberg, 2021), and still others find little evidence of bias in cases such as China (Tang, 2016). Both high- and low-trust countries in Figure 2 include regimes classified as partly free or not free by Freedom House (2024), suggesting that self-censorship or political wariness alone cannot account for why some authoritarian countries report high trust while others report low trust. In addition, although respondents’ understanding and reporting of political trust may differ across regime types, prior research has shown that latent variable models can measure trust in central political institutions comparably across contexts (Schneider, 2017). For transparency, I therefore report all estimates, while future research should continue to investigate the dynamics of trust in authoritarian contexts.
Figure 3 illustrates how TrustGov scores evolve differently across 12 selected countries, with sharp increases in some contexts and long-term declines in others. For example, trust in government has risen prominently in countries such as Germany, India, the Philippines, and Nigeria—likely reflecting stable governance under Merkel in Germany and Modi in India (OECD, 2025; Sardesai and Shastri, 2023), populist administration in the Philippines (Curato, 2017), and reduced violence levels in Nigeria (Harding and Nwokolo, 2024). In contrast, trust has remained consistently high in China and relatively low in Australia. TrustGov scores over time across selected countries, 1973–2020. Note: Lines represent TrustGov estimates; gray shading shows 80% credible intervals, reflecting the uncertainty around TrustGov estimates.
TrustGov scores have declined steadily or dramatically in Greece, Mexico, Argentina, and the United States, primarily due to economic crises in Greece (Ervasti et al., 2019), widespread corruption in Mexico (Morris and Klesner, 2010), financial instability and political dysfunction in Argentina (Council on Foreign Relations, 2024), and rising political polarization and partisanship in the United States (Hetherington and Rudolph, 2018).
Some countries show greater volatility. In the United Kingdom, shifts may be associated with Brexit, sovereignty debates, and immigration issues (Guardian, 2025). In Turkey, changes may reflect the personalization of political power and economic volatility (Pew Research Center, 2024).
These visualizations show uncertainty in the estimates through the width of the 80% credible intervals and highlight the need for caution in interpretation. It is also worth noting that the current dataset ends in 2020, coinciding with the onset of the COVID-19 pandemic. Post-2020 trends may deviate sharply from earlier trajectories, as some governments experienced surges of public trust during crisis response while others saw declines. The next data release will incorporate post-2020 surveys to capture these dynamics. Meanwhile, the cross-national and temporal variation already present in TrustGov scores invites in-depth analysis.
To assess whether TrustGov validly captures trust in national government across contexts and over time, I next report convergent and construct validation tests.
Convergent validation tests whether a measure is empirically associated with alternative indicators of the same concept (Adcock and Collier, 2001: 540). I conducted “internal” convergent validation (see, e.g., Caughey et al., 2019: 689; Solt, 2020b: 10) by comparing TrustGov scores against individual source items used in estimation.
Figure 4 presents three validation plots comparing TrustGov scores with the percentage of respondents expressing at least some trust, calculated using responses at or above the median of each item’s response scale. The left panel shows a scatterplot of country-years in which TrustGov scores are plotted against responses to the Eurobarometer question: “Please tell me how much you personally trust each of the following institutions using a scale from 1 to 10, where [1] means ‘you do not trust the institution at all’ and [10] means ‘you trust it completely’.” The strong correlation [R = 0.88] indicates that TrustGov scores effectively capture variations in trust across country-years. Convergent validation using individual TrustGov source data survey items. Note: Gray whiskers and shading represent 80% credible intervals.
The middle panel compares TrustGov scores with responses to the question: “How much do you trust the national government in your country?” from the Wellcome Global Monitor Survey in 2018. This item was asked in more countries than any other trust question in a single survey over the past decade, and the strong correlation [R = 0.94] demonstrates the broad applicability of TrustGov scores across diverse contexts.
Finally, the right panel compares TrustGov with the trend of the longest-running item in the German ALLBUS survey since 1984: “How much trust do you place in the federal government?” TrustGov scores align with the observed trend [R = 0.93], capturing historical changes over time. In all tests, correlations are estimated accounting for measurement uncertainty.
Construct validation assesses whether a measure is empirically correlated with indicators that theory suggests are causally related to that measure (Adcock and Collier, 2001: 542). I conducted construct validation using three such indicators: public satisfaction with political system performance, perceived corruption, and executive approval ratings. Prior research shows that trust is a strong predictor of satisfaction with political system performance (Hetherington and Rudolph, 2018) and approval ratings (Citrin and Luks, 2001), and is negatively associated with perceived corruption (Anderson and Tverdova, 2003).
The results are presented in Figure 5. The left panel shows a clear positive relationship [R = 0.71] between TrustGov scores and satisfaction with political system performance, measured as the share of respondents expressing at least some satisfaction in the WVS Wave 7. A similar positive correlation [R = 0.71] between TrustGov scores and executive approval ratings appears in the right panel. The approval ratings are drawn from smoothed estimates for OECD countries in 2018 from the Executive Approval Project (version 2) (Carlin et al., 2023). The center panel shows a negative relationship [R = −0.72] between TrustGov and perceived widespread corruption, as surveyed in Eurobarometer, the Comparative Study of Electoral Systems (CSES), and the WVS in 2018. In all three tests, the correlation signs align with theoretical expectations. Construct validation using satisfaction, perceived corruption, and approval rating data. Note: Gray whiskers and shading represent 80% credible intervals.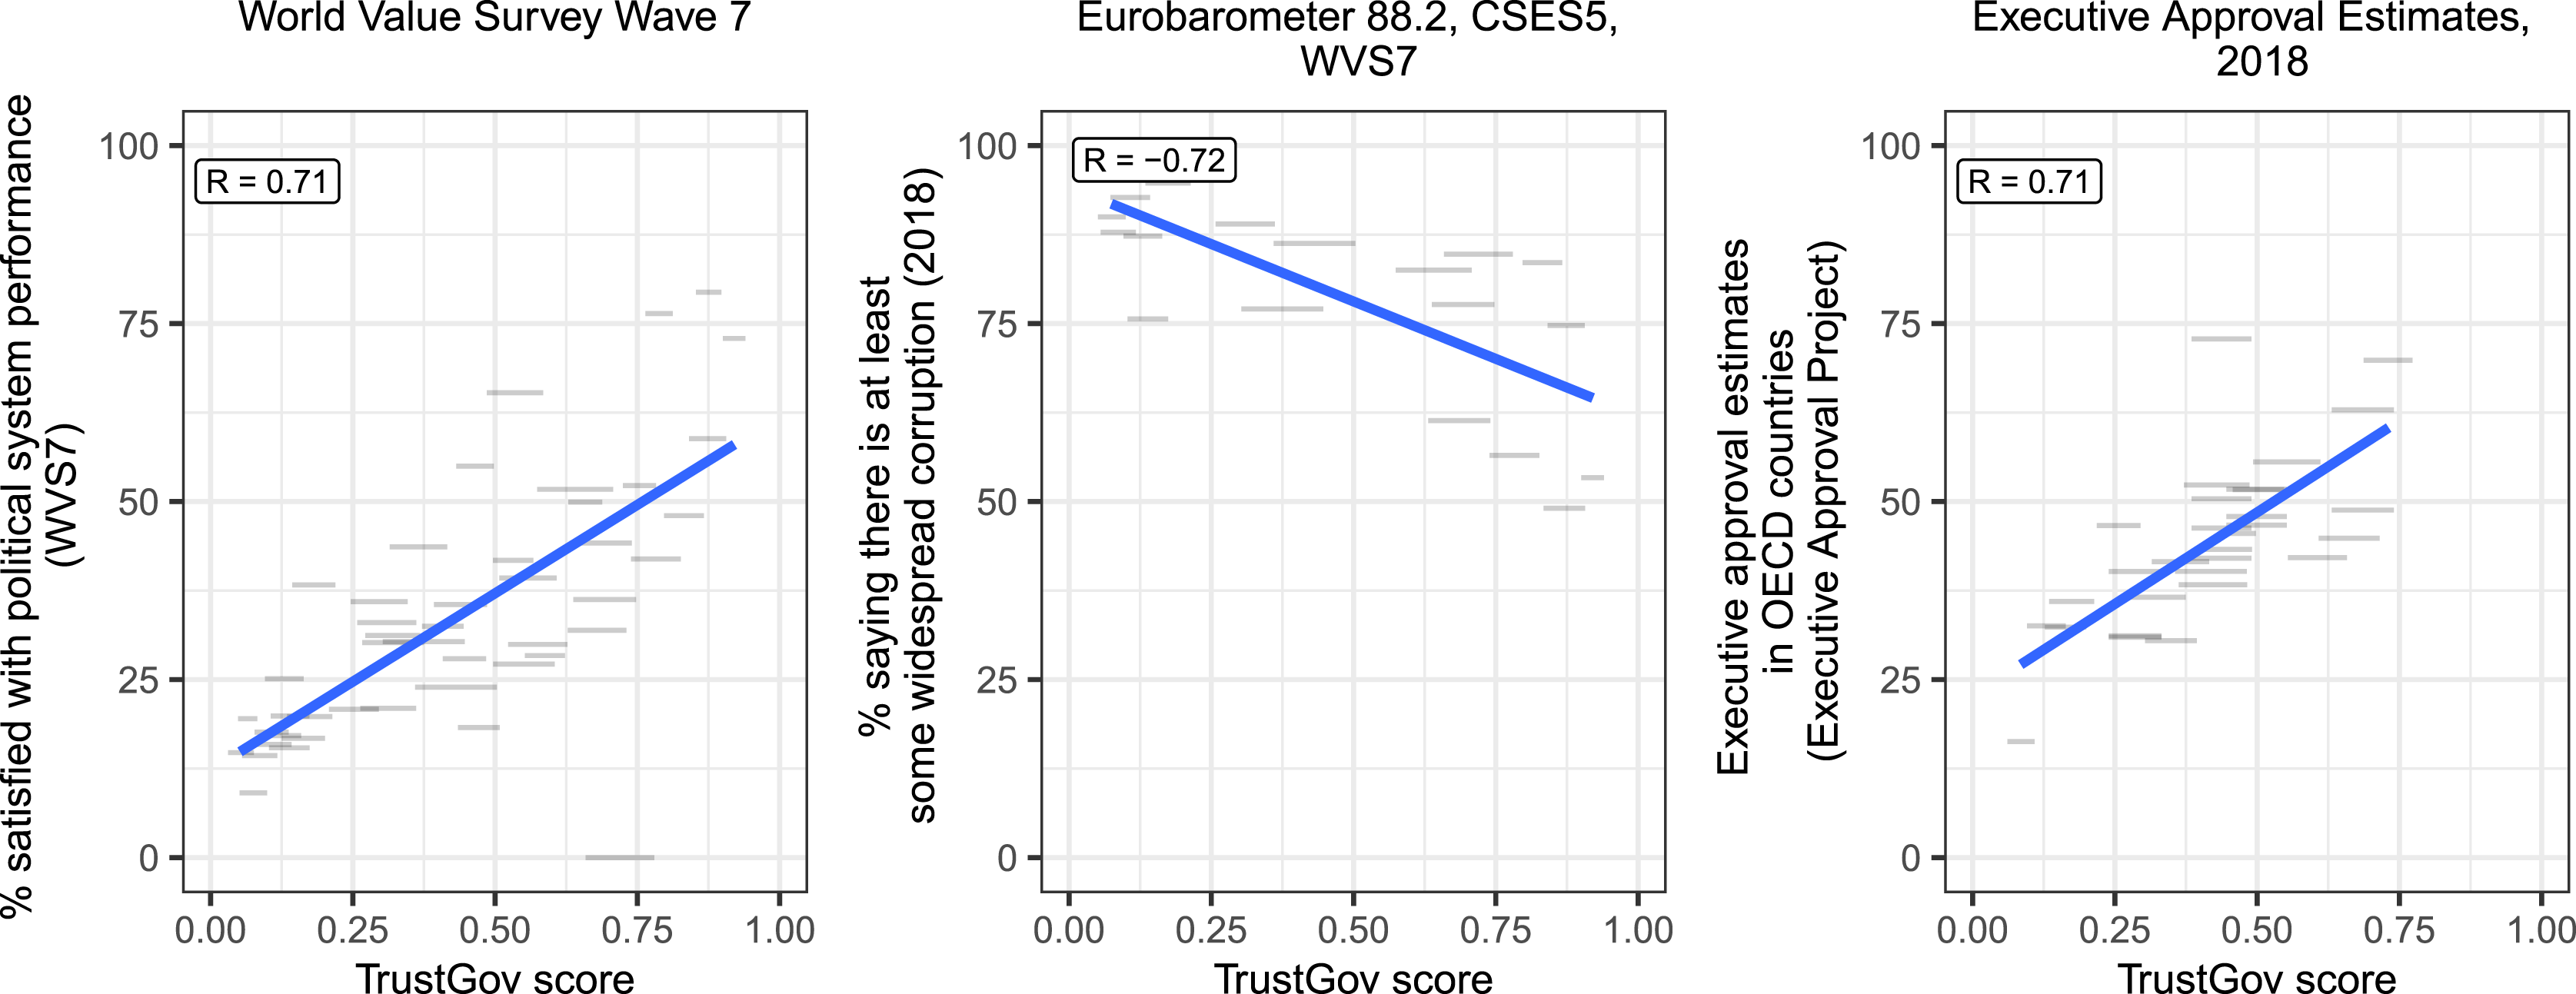
In sum, the convergent and construct validation results provide strong evidence that TrustGov is a valid measure of trust in national government.
In addition to the tests above, I examined survey items that were not used to estimate TrustGov but are empirically closely related to trust in government: trust in parliament and trust in public administration. Although the dimensional structure of political trust is debated, empirically, trust in government typically moves closely with trust in parliament, and the two are often grouped as indicators of political trust (Dellmuth, 2024; van der Meer and van Erkel, 2024). Likewise, although scholars distinguish trust in government and trust in public administration, empirical work finds a strong positive association between them (see more discussion at Camões and Mendes, 2019).
In Figure 6, TrustGov scores are compared against public trust in parliament from the European Quality of Life Survey (EQLS) in the left plot and against the percentage of respondents who expressed trust in public administration in Eurobarometer in the right panel. Additional validation test using trust in parliament and trust in public administration. Note: Gray whiskers and shading represent 80% credible intervals.
Across both tests, TrustGov is positively correlated with these related forms of institutional trust, with a stronger correlation for trust in parliament [R = 0.82], and a moderate correlation for trust in public administration [R = 0.74].
Discussion and conclusion
Although political trust is a long-standing interdisciplinary topic, much of our understanding still comes from single countries or regions with rich longitudinal data that may not generalize elsewhere, or from cross-sectional snapshots that cannot capture dynamic changes over time (Kołczyńska et al., 2024). The TrustGov dataset helps address this gap by providing comparable cross-national time-series measures of trust in national government. It supports research on the determinants and consequences of trust across contexts and over time, for example, how trust shapes attitudes toward climate change and public health policies, and how it interacts with polarization, personalist leaders, and crisis governance.
TrustGov also supports qualitative and mixed-methods research. Researchers can use TrustGov trends to identify countries or periods with sharp shifts in trust and explore them further through case studies. Identified turning points can be examined with process tracing or interviews to probe mechanisms behind observed shifts. The dataset also facilitates classic comparative strategies, such as most similar systems design and most different systems design. Researchers can select cases with similar contexts but divergent trust trajectories, or cases that differ in most respects yet exhibit similar trust patterns. In this way, TrustGov connects large-scale patterns with fine-grained qualitative accounts and strengthens contextual explanations of how trust develops in specific settings.
TrustGov offers a valuable resource for studying trust in government, but it has limitations. First, as an aggregate-level measure, it may obscure subnational variation, polarization in trust, or case-specific dynamics that require country expertise and qualitative or mixed methods to illuminate. Second, the smoothing approach introduces measurement uncertainty, and ignoring uncertainty risks distorting inferences (Tai et al., 2024). To facilitate appropriate use, I provide full posterior draws so researchers can incorporate uncertainty directly into their downstream analysis via different approaches (e.g., Caughey and Warshaw, 2018; Tai et al., 2024; Woo et al., 2025). Finally, the current release ends in 2020. The COVID-19 pandemic might have reshaped trust in many countries. Researchers should be mindful of this temporal boundary when drawing inferences.
The TrustGov project will continue to be updated and improved. The next planned release will incorporate surveys conducted after 2020, including post-pandemic waves. Future releases will expand the dataset on a rolling basis as new cross-national surveys become publicly available.
Footnotes
Funding
The author received no financial support for the research, authorship, and/or publication of this article.
Declaration of conflicting interests
The author declared no potential conflicts of interest with respect to the research, authorship, and/or publication of this article.
Data Availability Statement
Replication materials are available on Harvard Dataverse: https://doi.org/10.7910/DVN/ QRTOSI (Tai, 2026). The complete revision history is available on GitHub: ![]() .
.
Carnegie Corporation of New York Grant
This publication was made possible (in part) by a grant from the Carnegie Corporation of New York. The statements made and views expressed are solely the responsibility of the author.
Supplemental material
Supplemental material for this article is available online. The replication files are available at: https://doi.org/10.7910/DVN/QRTOSI (Tai, 2026).