
Abstract
This article considers (1) presidential approval, (2) party brand differentials, as measured by the generic ballot, and (3) the presidential candidate polling differentials during the general election campaign to forecast the 2024 U.S. presidential and congressional elections. While all these three mass public opinion variables are leveraged to forecast collective partisan election outcomes, we consider the variables together as theoretically distinct determinants of partisan fortunes at both the executive and legislative levels and make the following contributions. First, using novel time-series data of mass opinion since 1937, we show that all three variables are weakly correlated and thus distinct conceptual and empirical measures of mass public assessments of partisan stimuli. Second, we use these three mass opinion variables to specify a unified model of U.S. national elections which better predicts variation in electoral outcomes compared to the standard forecasting approaches, finding that congressional election outcomes are predicted by party brands while presidential elections are predicted by presidential approval and the presidential candidate polling differentials heading into election day. Lastly, we validate our forecasting model using out-of-sample and 2024 forecasting predictions against other standard forecasting approaches.
Keywords
Unified model of U.S. National election outcomes
The 2024 presidential election context featured, for the first time since 1968, an eligible incumbent President that declined to seek re-election. Following “a disastrous debate with Donald Trump that raised doubts about the incumbent’s fitness for office” held on June 27th 2024, Democratic elites were successful in pressuring President Joe Biden to drop his 2024 re-election bid on July 21st, paving the way for Vice President Kamala Harris to ascend to the top of the Democratic ticket to oppose former President Donald Trump despite not winning the nomination through a contested primary season. 1 In the aftermath of the top-of-the-ticket switch in the summer of 2024, press accounts argued that Vice President Harris was “riding a wave of momentum since announcing her candidacy” and polling suggested a shift in the likelihood of a Democratic victory in November from a perceived likely defeat with President Biden at the top-of-the-ticket. 2
Despite this reinvigoration of polling support for the Democratic ticket to oppose a formerly defeated Republican President, election prognosticators noted that the 2024 presidential contest remained hotly contested. Entering the Labor Day home stretch of the general election campaign, The Economist rated the race as a toss-up despite the fact that Vice President Harris was tied to a retiring President. 3 Beyond the presidential contest, the 2024 contest of congressional majorities in both chambers appeared to be a very competitive contest. Despite contending with a retiring president facing historically high levels of job disapproval, congressional Democrats were locked in a competitive contest to flip the majority in the U.S. House and maintaining their control of the U.S. Senate. Despite the popular media narrative describing the 2024 U.S. national elections as historic and volatile, the backdrop of this election cycle takes place during an era of high partisan continuity and greater electoral predictability. Indeed, current work shows that major party vote-switches in American elections comprise less than 3% of the national electorate (Shino et al., 2023) while the bivariate correlation between the presidential and congressional vote to be approaching one (Algara, 2024). Scholars also note that the contemporary polarized era coincides with a decline in the number of battleground states at the presidential level (Cervas and Grofman, 2017), competitive House and Senate races (Algara, 2024), and even competitive U.S. counties (Amlani and Algara, 2021). In short, while the 2024 election cycle was portrayed as historic and uncertain given the dramatic summer change in the Democratic presidential ticket and the nomination of a formerly defeated Republican president, this cycle took place during a period of remarkable partisan continuity in subnational voting patterns and stark partisan competition over a small number of battleground constituencies.
Remarkably, despite being saddled with a chronically unpopular co-partisan in the White House, the 2024 election provided for a competitive Democratic brand at both the presidential and congressional levels. Given the reliance of standing election forecasting approaches on fundamental national conditions such as aggregate evaluations of presidential job performance (see Lewis-Beck, 2005; Lewis-Beck et al., 2008; Victor, 2021, for a broad overview of the U.S. forecasting literature), how would a forecasting model predict the very competitive nature of the 2024 U.S. presidential and congressional elections? We address this question by making three key contributions to the forecasting literature in this research note. First, we argue that the national electorate considers (1) presidential approval, (2) the incumbent party brand, and (3) relative presidential candidate evaluations (i.e., the differential between the incumbent party’s candidate and the out-party challenger) as distinct concepts. 4 While we note that these concepts are correlated, we introduce new measures of each of these mass public opinion variables using data sourced from survey marginals dating back to the 1930s. Second, we contribute to the broader forecasting literature by developing a model forecasting the collective accountability of the incumbent party as a function of three core predictors, showing that our unified model predicts more of the variation in presidential election outcomes and results in less forecasting error than conventional forecasting approaches. We also show that our unified model can be used to also predict the national outcomes of congressional elections at the level of both the U.S. Senate and U.S. House, addressing a limitation of standard forecasting models that are designed to only assess presidential election outcomes. Lastly, we provide a forecast of the 2024 U.S. national elections and show that our model correctly predicted Republican victories at the presidential and congressional levels.
Measuring presidential approval, party brands, & candidate quality in U.S. national elections
Perhaps no variable is used more frequently by scholars to predict American elections than presidential approval. As Victor (2021) points out, the conventional model forecasting presidential elections is Abramowitz’s (1988b) “Time for Change” model that leverages three foundational predictors: party incumbency, status of the national economy, and presidential approval. With respect to congressional elections, most forecasting models generally leverage the partisan differential on the generic ballot as their main predictor of seats won as a national result of legislative elections, with these models focusing on predictions during midterm election cycles (Abramowitz, 2006, 2023; Bafumi et al., 2010). Moreover, the literature shows that specific candidate evaluations can be a related, but still relatively distinct, considerations from evaluations of presidential performance or the party brands (Buttice and Stone, 2012; Stone et al., 2004; Stone and Simas, 2010). Rooted in the valence characteristics of candidates, such as assessments of leadership qualities (e.g., Stokes, 1963), prior research demonstrates that while partisan bias exists in individual evaluations of congressional candidates (Goren, 2002), stronger candidate valence evaluations does correlate with greater general election prospects (Stone and Simas, 2010).
The lack of a unified approach in the forecasting literature assessing presidential and congressional election outcomes is a bit puzzling, particularly given scholarship suggesting that presidential approval, partisan brands, and candidate evaluations play a large role in shaping the parameters of partisan competition in congressional elections (see Miller and Stokes, 1963; Key, 1966; Tufte, 1975, for foundational work). Theoretically, there are institutional reasons to believe the three variables of presidential approval, partisan brands, and candidate evaluations are distinct concepts. First, while presidential popularity can motivate the popularity of their party (Algara, 2024), presidential popularity does not always translate to partisan accountability. Indeed, the literature on presidential coattails notes that presidential popularity plays a limited role in getting weak co-partisan candidates elected (Campbell and Sumners, 1990).
Second, as an institutional matter, while presidents are the leaders of their party, partisan brands in the eyes of voters are generally thought of being decentralized, weaker, and more ambiguous (Hetherington, 2001). While presidents are held individually (and collectively) accountable since they are the sole elected occupant of the executive branch, parties are a collective of organized interests and individual politicians without the power to directly control their images to voters given the lack of formal powers to control nominations. Moreover, while presidents may be directly blamed for unpopular decisions or presiding over unpopular valence developments such as war or economic declines (Gronke et al., 2003), their party may shirk responsibility and break from their co-partisan administration. As Jacobson and Kernell (1983) point out in their case study of the 1982 congressional elections, congressional Republican candidates sought to distance themselves from an unpopular president presiding over a deep economic recession and were able to mitigate their losses. It “was, in fact, nothing like the kind of Republican disaster” that conventional wisdom anticipated. 5
Lastly, as was apparent during the 2024 election cycle, presidential candidates may be able to outpace an unpopular co-partisan in the White House by keeping elections competitive. Indeed, against the tide of a retiring co-partisan president with a 41% approval rating, Vice President Harris secured the narrowest national popular vote loss at 1.48% since Democratic Vice President Hubert Humprhey’s 0.70% loss to former Vice President Richard Nixon during the 1968 presidential election. Similar to Harris in the 2024 cycle, Humphrey sought the presidency against the backdrop of an unpopular co-partisan president in Lyndon Johnson who held about a 43% approval heading into the 1968 presidential election. These two cases provide anecdotal evidence that presidential candidates may be evaluated, to a degree, independently from assessments of presidential approval. In a more systematic approach and expanding previous work by Markus and Converse (1979), Highton and Stone (2024) find that incumbent-challenger valence differentials independently predict the incumbent party’s national vote margin in presidential elections from 1952 to 2008, even after including presidential approval in the model.
To summarize the previous theoretical discussion, there is reason to believe that, to a certain degree, the three mass opinion variables identified are conceptually and empirically distinct from one another. Presidents may be individually popular but this may fail to translate directly to the popularity of their partisan brand. Co-partisan presidential candidates may use their valence differential advantage to the challenging party’s presidential candidate to over-perform and distance themselves from an unpopular co-partisan in the White House, such as during the 1968 and 2024 presidential election cycles. To empirically test this proposition, we construct new measures of presidential approval, the incumbent party’s partisan brand, and the quality of the incumbent party’s presidential nominee relative to the challenging party’s presidential nominee at the quarterly level. 6 To measure presidential approval, we rely on data from the Roper Center which tracks presidential approval dating back to August 1937. 7 This provided for N = 6, 642 survey marginals measuring presidential approval across 100 unique pollsters from 1937 to 2024.
With respect to measuring the standing of the incumbent party’s brand relative to the out-party, we collect survey marginals of the congressional generic ballot from the Roper Center, Real Clear Politics, and FiveThirtyEight. 8 The congressional generic ballot is a poll that is “generic” in that it measures partisan preference in the upcoming congressional election rather than asking about specific candidates or races, with the resulting generic congressional ballot measure providing a preference for one party relative to the other party. We contend that by excluding the names of specific partisan candidates, this provides for the “generic” baseline of partisan preferences nationally that is shown to be fairly predictive of partisan fortunes at the level of the U.S. House (Abramowitz, 2023) and even the U.S. Senate (Algara, 2024), further providing face validity to the measurement that the party with the relative advantage on the congressional generic ballot can be conceptualized as a temporal measure of partisan brands. This data collection resulted in N = 8, 412 across 148 unique pollsters from 1937 to 2024.
Lastly, to measure the quality of the incumbent party’s presidential candidate, relative to the out-party’s presidential candidate, we collect the universe of national horse-race polling marginals for both major party presidential nominees since the advent of systematic scientific presidential election polling with the 1940 presidential election. 9 Ideally, one would like to employ measures of presidential candidate quality that taps into the desirable valence qualities such as competency and honesty, which are available in the American National Election Study (ANES), but these are not systematically polled over time and appear to end with the 2008 election (Highton and Stone, 2024). 10 As such, we consider the incumbent party’s differential in horse-race presidential election polling as our relative measure of candidate quality, assuming that higher levels of this measure indicates higher candidate quality for the incumbent party’s presidential nominee relative to the challenging party’s presidential nominee. Within the context of the 2024 election, this assumption appears to have face validity. Indeed, in national presidential horse-race polling in 2024, President Biden averaged a −1.82% deficit against former President Trump prior to dropping out of the presidential contest. By contrast, in all the 2024 polling, Vice President averaged a 1.78% lead against former President Trump. While both of these polling margins are within conventional margins of error, this Democratic gain in the national polling following the ticket switch in the summer of 2024 follows media reports that Democratic elites perceived President Biden to be a weaker general election nominee than Vice President Harris. As such, for presidential elections from 1940 to 2012, we collect the survey marginal data from the Roper Center while the 2016, 2020, and 2024 presidential election cycles were collected from the polling depository maintained by FiveThirtyEight. Towards measuring candidate quality, we collect data on all horse-race polling matchup between the presidential nominees of the incumbent party and out-party, resulting in N = 10,830 survey marginals across 292 unique pollsters from the 1940 cycle to the 2024 cycle.
With our data collected, we estimate latent time-series of presidential approval and the incumbent party brand using Stimson’s et al. (1995) dyad ratios latent variable model to identify shared variance across differently worded surveys towards deriving smoothed quarterly estimates of both concepts. Given the consistency of presidential approval and generic ballot polling data over time, we are able to estimate this trend at the quarterly level from 1937 Q3 to 2024 Q3, providing for 349 quarters of the two measurements. 11 Unlike presidential approval and party brands, challenger quality derived from presidential election horse-race polling is measured inconsistently over time. Indeed, horse-race polling between presidential candidates is almost exclusively conducted after the midterm elections when the presidential election cycle begins. For example, the first poll testing a hypothetical matchup between then-President Trump and Former Democratic Vice President Joe Biden during the 2020 presidential election cycle was a HarrisX Poll, sponsored by The Hill, conducted a month after the 2018 midterm elections in December 2018. As such, there is very seldom horse-race polling data during midterm election cycles. Given this lack of temporal consistency in survey questions fielded to the mass public, since quarters falling into midterm election cycles seldom have presidential horse-race polling data, we measure candidate quality of the incumbent party’s presidential candidate as the quarterly mean two-party percentage of the incumbent party’s presidential nominee relative to the out-party’s presidential nominee, with higher values of this measure indicating higher quality of the incumbent party’s presidential candidate relative to the out-party. 12
Now that we described our key mass opinion measures of theoretical interest, we investigate the degree to which these measures are empirically distinct. Figure 1 presents a correlation matrix and the distribution of our mass opinion variables.
13
As one can see, presidential approval and the incumbent brand measures are weakly correlated at ρ = 0.303 while the incumbent party brand and the incumbent polling differential are correlated at ρ = 0.276, suggesting that the incumbent party’s brand is, while related, a largely distinct mass opinion evaluation compared to mass assessments of presidential approval or the two major party presidential candidates. By contrast, presidential approval and the incumbent polling differential in the presidential election (i.e., our measure of candidate quality) is moderately correlated at ρ = 0.517. This higher correlation is not surprising, given that in N = 13 presidential elections since 1940 an incumbent president sought re-election while N = 8 were for open seat contests.
14
Correlation of Quarterly Mass Opinion Variables, 1937 Q3-2024 Q3. Note. Figure 1 presents the correlations among presidential approval, incumbent party brand, and incumbent polling differential and their respective distributions. Presidential approval and incumbent party brands quarterly time-series estimated from Stimson’s et al. (1995) dyad ratios model while incumbent polling differential specified from quarterly means. N = 349 presidential approval quarters; N = 349 incumbent party brand quarters; and N = 171 quarters incumbent party polling differential. Section A1 of the Appendix provides further detail about the construction of the quarterly mass opinion covariates; note that the incumbent party’s polling differential has less quarters given that this measure is generally measured only in presidential cycles rather than bother presidential and midterm cycles. Table A1 presents descriptive statistics of quarterly mass opinion time-series for each variable.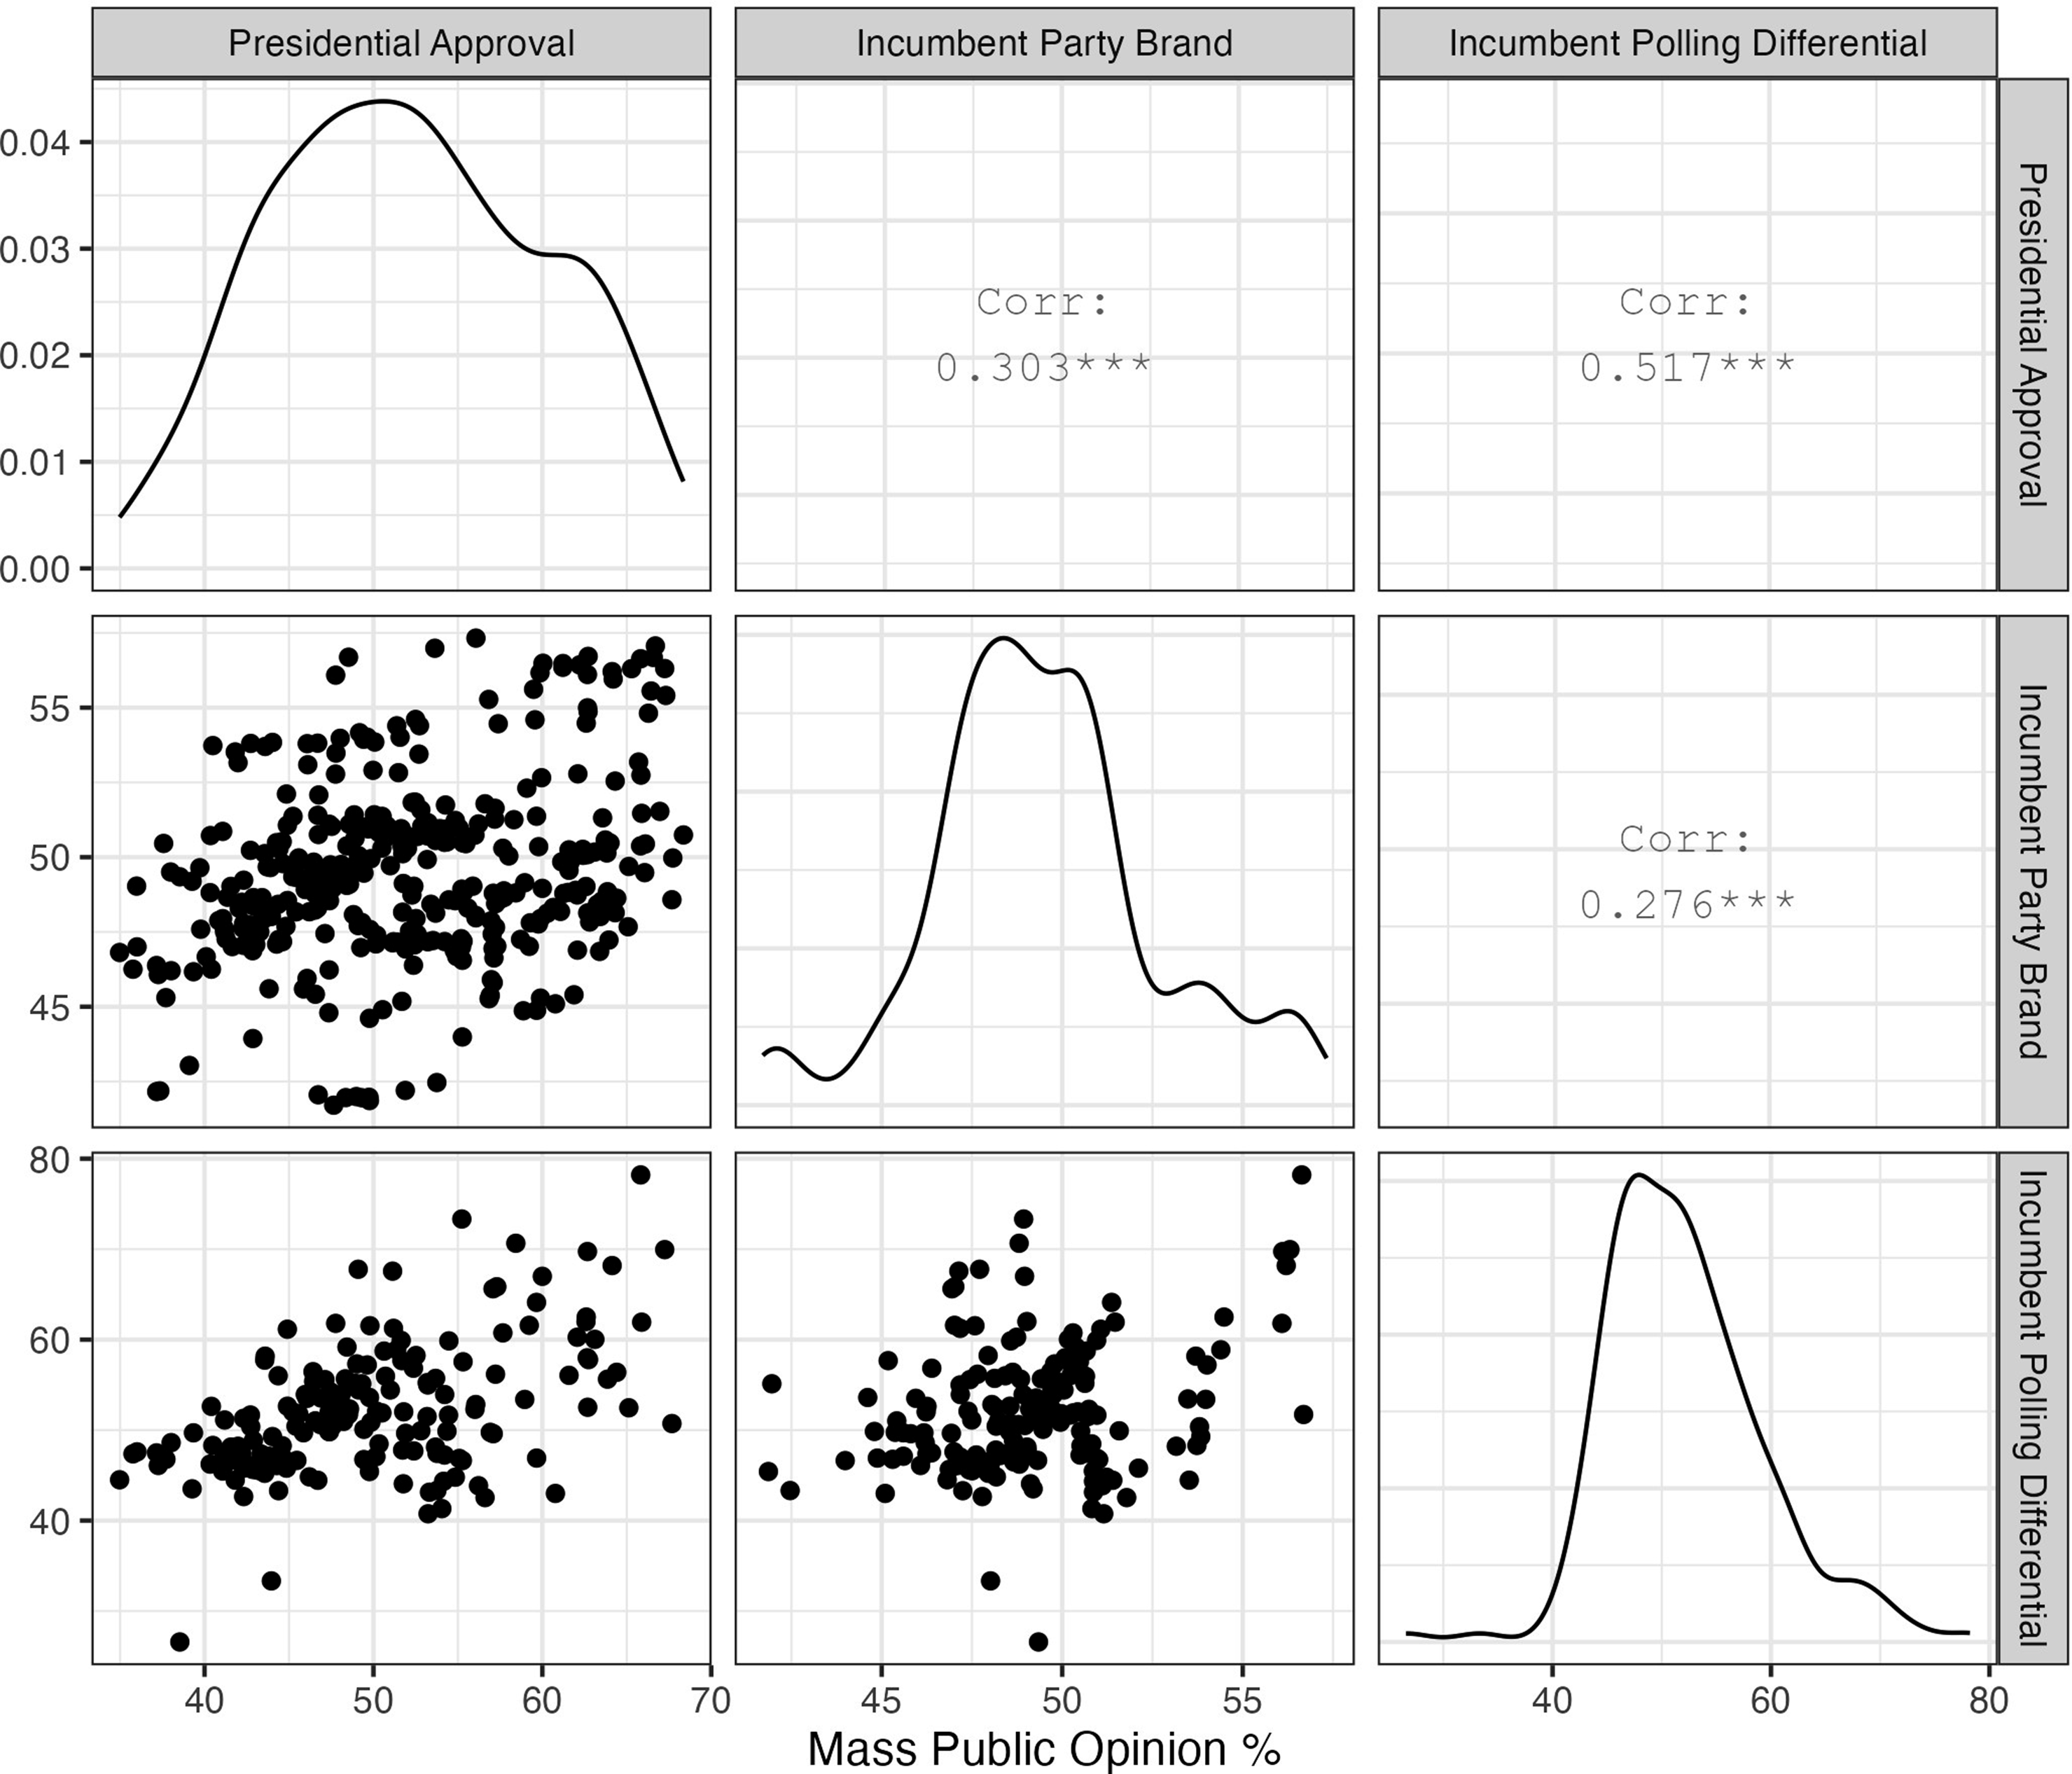
Building the unified model from time for change
Now that we have established our mass public opinion variables as distinct theoretical and empirical concepts, we turn to leveraging them as key predictors of collective partisan outcomes in U.S. national elections, beginning with predicting presidential elections. In our forthcoming analysis, we use the third quarter prior to the election as our measure of each mass opinion variable, thus providing for the measurement of the sentiment of the national electorate just prior to the election. To that end, we begin by building our comprehensive model and assessing its predictive power by comparing our model to the baseline fundamentals model conceptualized in Abramowitz’s (1988b) “Time for Change” model. As stated earlier, the conventional wisdom in forecasting presidential forecasting is conceptualized in this “Time for Change” model, which leverages static features of the election cycle (i.e., the “fundamentals”) to predict presidential election outcomes (Victor, 2021). By beginning with this conventional “fundamentals” approach, we build out our Unified model of presidential elections that leverages our three key mass opinion variables and assess how well our approach predicts variation in presidential election outcomes compared to the conventional forecasting approach.
OLS models predicting presidential election outcomes, 1940-2020.

***ρ < 0.001; **ρ < 0.01; *ρ < 0.05; +ρ < 0.10.
HC2 robust standard errors reported in parenthesis.
Models 2, 3, and 4 in Table 1 are bivariate regressions using each of our three mass opinion variables to predict variation in our outcome variables. 16 As Model 2 shows, presidential approval is a strong predictor of both the popular vote and electoral college performances of the incumbent party but this model alone falls short of the amount of variation predicted by the TC model, with this bivariate model predicting 62.5% and 56.3% of the variation in these two outcomes. Model 3 finds that incumbent party brand is a widely insignificant predictor of our two presidential outcomes on its own, with this model predicting pretty much none of the variation in these outcomes. Lastly, our last bivariate regression in Model 4, which leverages the predictor of the incumbent party’s presidential candidate polling differential (i.e., the polling strength of the incumbent party’s presidential nominee relative to the out-party’s presidential nominee), finds that this variable itself explains about 81.1% and 63.8% of the variation in the two-party popular vote percentage and electoral votes won by the incumbent party. This is a stark improvement in prediction of variation compared to the TC model, which again predicts 71.4% and 59.3% of the variation in these two presidential outcome variables.
Models 5 and 6 of Table 1 build on Model 4 by including all mass opinion variables in a single equation (Model 5) and then adding the three “fundamentals” control variables: (1) third quarter national unemployment rate, (2) third quarter annual GDP growth, and (3) a counter indicating how many quarters the incumbent party held the White House on election day. As one can see, Models 5 and 6 marginally predict more variation in the presidential election outcomes, with Model 5 predicting 86.4% and 72.4% of the variation in our two outcome variables of interest while Model 6 predicts 89.3% and 75.0% of the variation. This is a marginal improvement from the bivariate Model 4, which predicts 81.1% and 63.8% of the variation in our two outcome variables, which provides for the finding that the mass public’s evaluation of the two presidential candidates is by far the most salient predictor of presidential election outcomes when compared to the “fundamental” economic indicators, presidential approval, and the incumbent party brand. Most interestingly, as Table 1 Models 5 and 6 incorporating both presidential approval and the presidential candidate polling differential in the same model show, both presidential approval and the presidential candidate polling differential significantly predict the popular vote performance of the incumbent party. Within the context of predicting the incumbent party electoral votes, Table 1B Model 6 shows that presidential approval is an insignificant predictor after accounting for the polling differential and the three “fundamentals” control variables, indicating that perhaps presidential approval is a mediator between economic conditions and the incumbent party’s performance in the Electoral College. 17
Comparing the unified model to other standing approaches
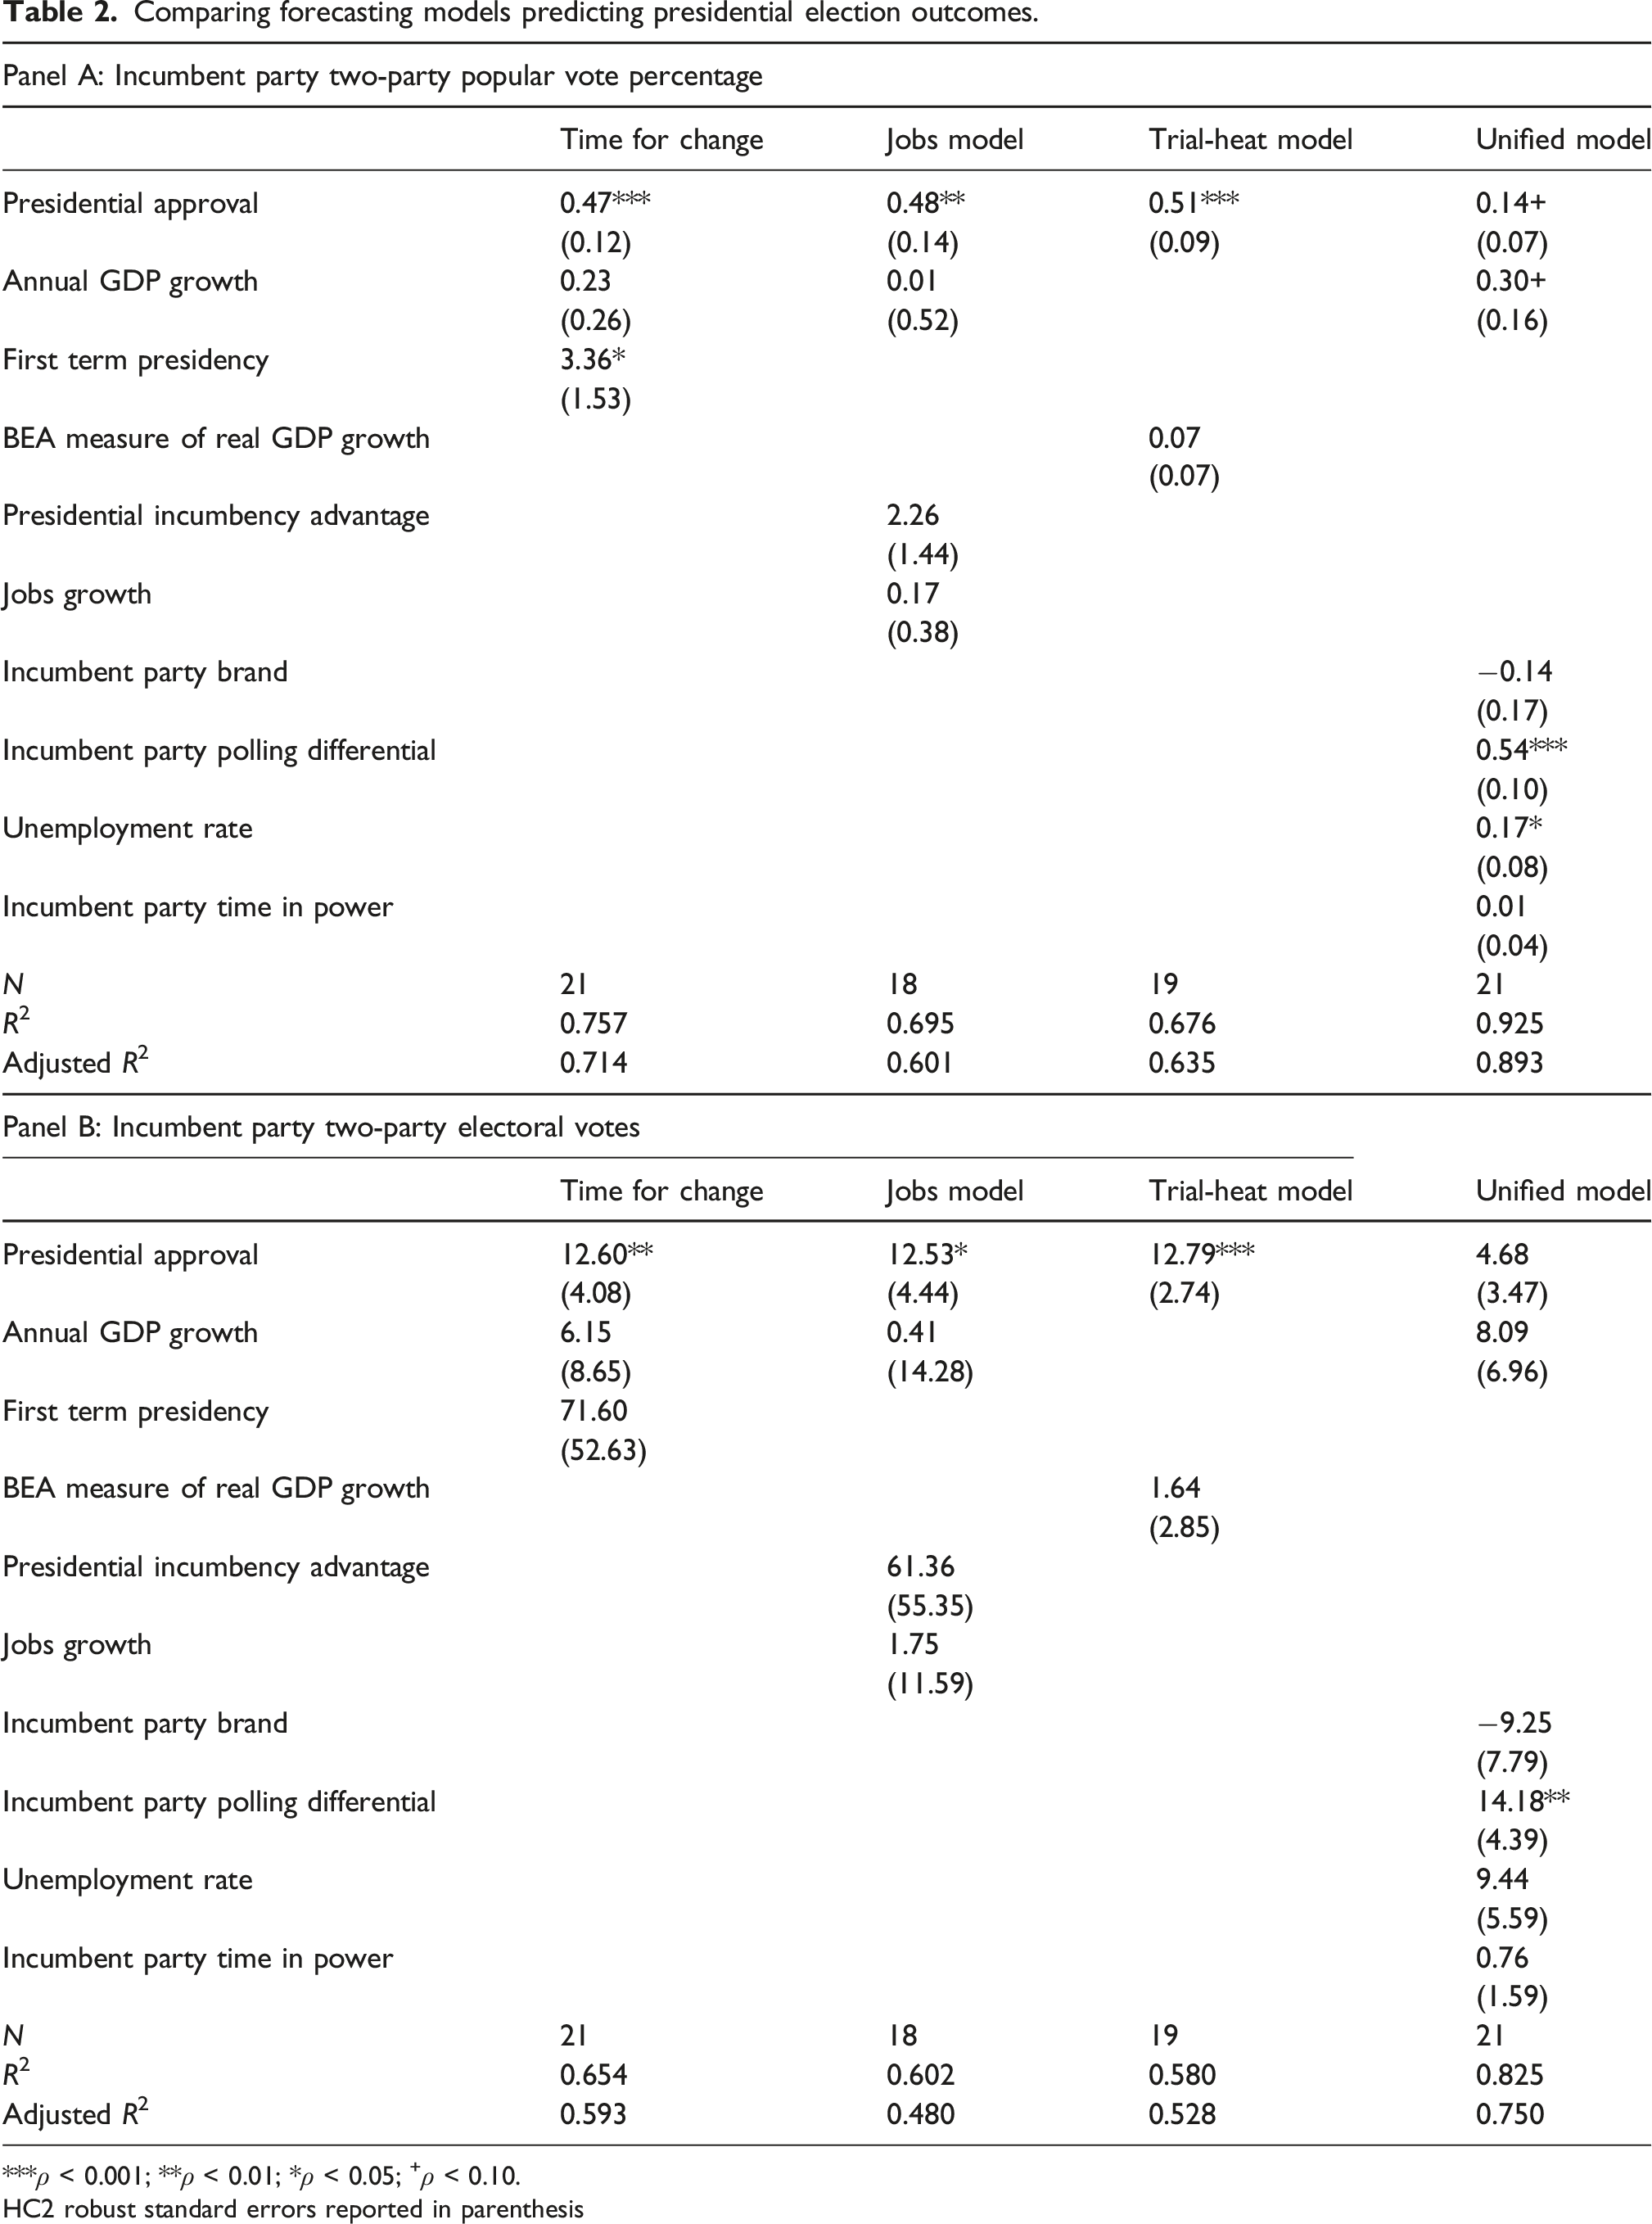
Comparing forecasting models predicting presidential election outcomes.
***ρ < 0.001; **ρ < 0.01; *ρ < 0.05; +ρ < 0.10.
HC2 robust standard errors reported in parenthesis
As the analysis in Table 2 shows, our Unified model predicts more of the variation in presidential election outcomes across both the popular vote and Electoral College outcomes than the other standing forecasting approaches. However, the previous analysis up to this point focuses on comparing goodness-of-fit statistics in the form of adjusted R2, thus not comparing the forecasting models based on accuracy or error between model predictions and observed results. To remedy this, we take each model and conduct a series of jackknife tests to derive out-of-sample predictions for each election in the sample and calculating the error between the model predictions and observed election results for each of our two presidential election outcomes. These jackknife tests consist of dropping out a given election year out of the data, re-estimating the model, and then predicting the out-of-sample year to derive an out-of-sample estimate. We do this for all election years present in the data. For example, to calculate the out-of-sample popular vote prediction for the 2020 election cycle, we drop 2020 from the dataset and re-estimate the model without this observation and predict the 2020 popular vote percentage for the incumbent party from this re-estimated model results. We then compare this out-of-sample estimate for a given election year with the observed result to calculate the absolute error between the estimate and observed result, providing us with a measure of the accuracy of the model. 19
Summary of mean absolute error predicting presidential election outcomes, 1940-2020.
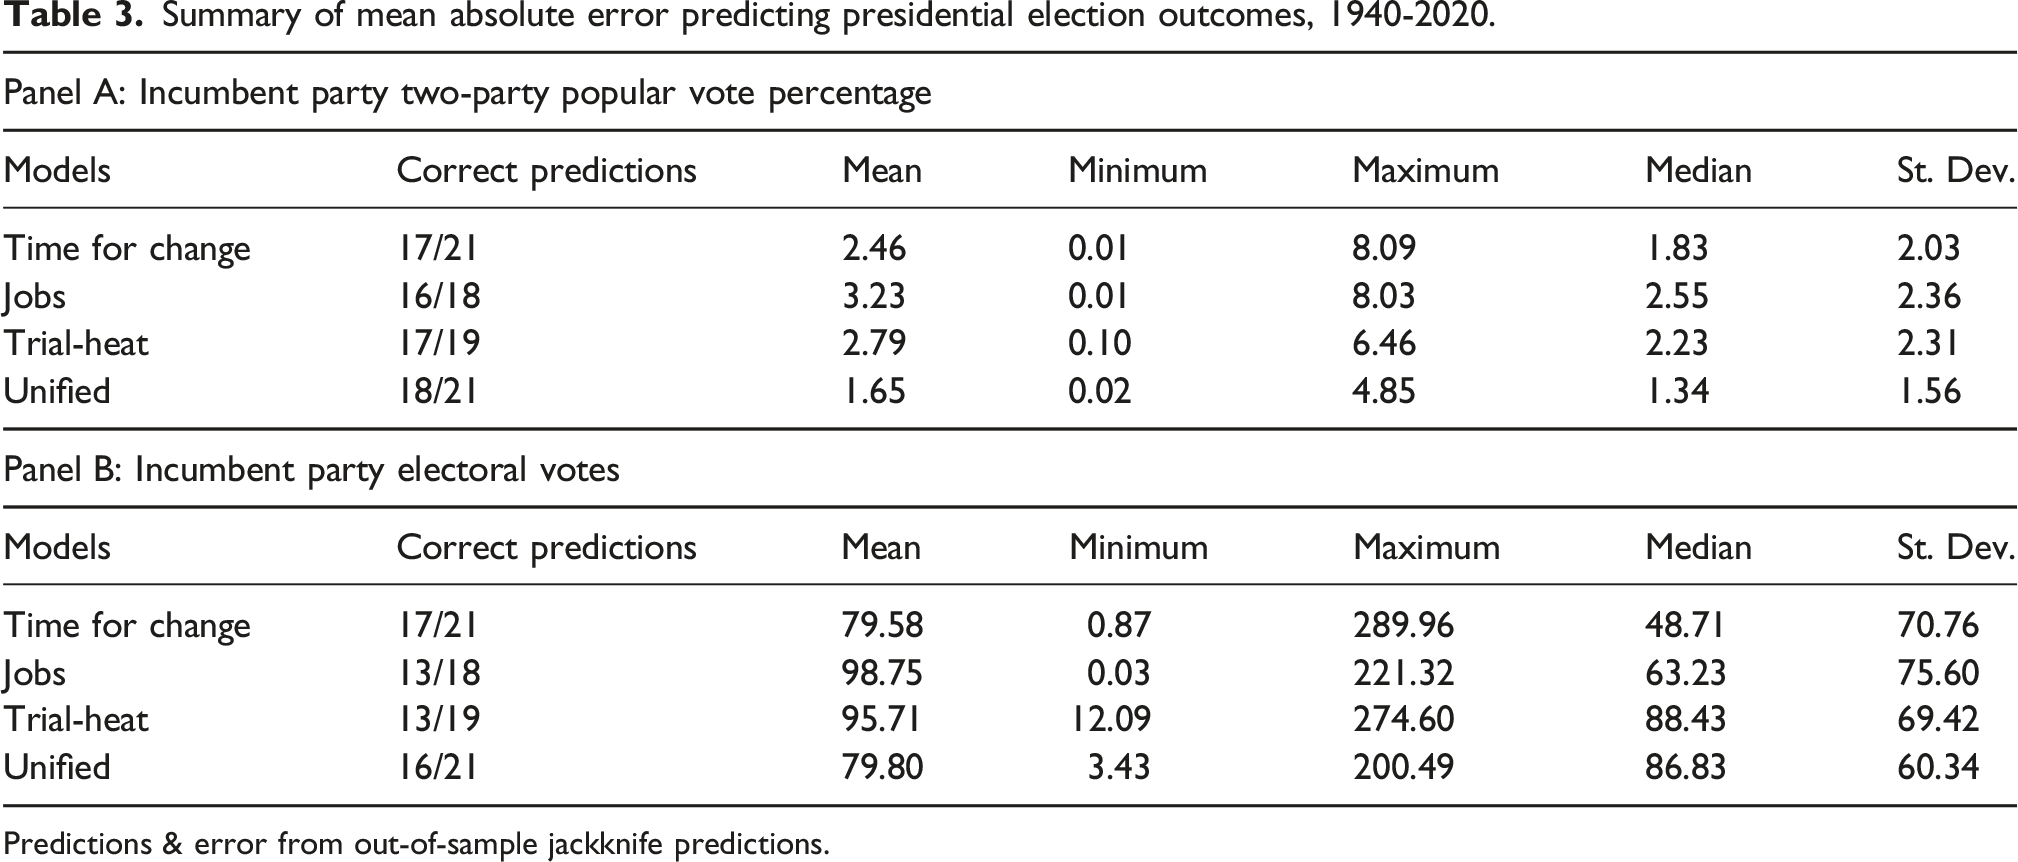
Predictions & error from out-of-sample jackknife predictions.
The unified model & congressional election outcomes
OLS models predicting congressional election outcomes, 1938–2022.

***ρ < 0.001; **ρ < 0.01; *ρ < 0.05; +ρ < 0.10.
HC2 robust standard errors reported in parenthesis.
Table 4B finds the same results within the context of the predicting the incumbent party’s performance in U.S. House elections. Indeed, Table 4B finds that the GB model predicts 69.5%, 84.1%, and 70.3% of the variation in U.S. House seats in pooled, midterm, and presidential election cycles while the Unified model predicts 64.0%, 72.6%, and 66.8% over these cycles. Moreover, our analysis shows that congressional election outcomes in both chambers are mostly predicted by the incumbent party brand, with the mass opinion consideration being the only salient predictor of congressional election outcomes with presidential approval and the incumbent polling differential proving to be insignificant predictors. 23 It is also interesting to note that the Unified model predicts less variation in congressional election outcomes, especially with respect to the U.S. Senate, than presidential election outcomes. Moreover, the Unified model is more predictive in elections for the U.S. House when compared to the U.S. Senate, confirming the observation in the literature that Senate races are more idiosyncratic than those for the lower chamber given the staggered non-random nature of these contests (Abramowitz, 1988a; Algara, 2019). As a comprehensive comparison of Senate and House elections since 1900 by Algara and Bae (2024) shows, elections for the upper chamber are more candidate-centered and relatively less partisan than elections for the lower chamber, providing systematic evidence of the non-random nature of more idiosyncratic Senate elections. While the Senate elections are catching up to the partisan and nationalized nature as House elections over time, both the GB and Unified models being more predictive of House elections relative to Senate elections underscores the unique nature of non-random staggered elections and how the Senate traditionally does not engage in the same degree of electoral turnover as the lower chamber (Stimson et al., 1995).
Summary of mean absolute error predicting congressional elections, 1938–2022.

Predictions & error from out-of-sample jackknife predictions.
Taken together, our Unified model shows comparable performance in forecasting congressional elections in both chambers compared to the conventional GB model. In this validation of our model within the context of congressional elections for both chambers, we highlight the utility of our forecasting approach. Indeed, as we show here, our Unified model can predict both presidential and congressional outcomes using a single model. Moreover, as a matter of theory, we show that congressional elections are largely predicted by the incumbent party brand rather than president-centered considerations, suggesting that congressional control hinges on the ability of the incumbent party brand to differentiate itself from their presidential co-partisan. Nevertheless, we highlight that our forecasting model shows a good degree of predictive power across each of our electoral outcomes at both the presidential and congressional levels.
Discussion: Forecasting the 2024 U.S elections & beyond
Thus far, we make two contributions. First, we leverage new data on survey marginals dating back to the 1930s to create new quarterly measures of presidential approval, party brands, and candidate quality that can be used in aggregate election forecasting. We show that these three considerations, while weakly correlated, are distinct and thus could potentially be used as independent predictors of U.S. national election outcomes within the same Unified model. Second, we validate our Unified model against standing forecasting approaches to U.S. presidential and congressional election outcomes. We find that our Unified model is more predictive and produces less forecasting error, compared to conventional standing forecasting approaches of presidential elections. Moreover, we find that our Unified model, while predicting less variation in congressional election outcomes and producing more error, has substantively similar performance to the standard GB forecasting approach to predict these elections. As a matter of theory, our Unified model consistently shows that presidential elections are largely a story of the mass public’s approval of the president and evaluation of the quality between the two major party presidential nominees while congressional elections are decided by the mass public’s assessment of the incumbent party relative to the out-party, thus contributing to the literature that partisan brands are distinct considerations from presidential-level mass evaluations.
To further validate our Unified model, we also produce forecasts of the 2024 U.S. national elections and evaluate our forecasts against the observed results. To do this, we take the coefficient estimates of our Unified model and multiply these estimates by observed values of our predictors on election day to derive linear predictions for each electoral outcome with associated 95% confidence intervals. The values of our Unified model predictors are observed on Election Day in the following form: (1) presidential approval at 40.61% 25 ; (2) incumbent party brand at 50.38% 26 ; (3) incumbent Party candidate polling differential at 50.63% 27 ; (4) national unemployment rate at 4.2% 28 ; (5) incumbent party time in power at 16 quarters; and (6) the annual GDP Growth (Q3) at 2.8%. 29
Comparing 2024 unified model forecasts & election outcomes.

L. Bound CI = 95% forecast estimate lower bound confidence interval.
U. Bound CI = 95% forecast estimate upper bound confidence interval.
Predictions derived from Unified model. CI’s calculated with HC2 robust standard errors.
In sum, despite a period of deep polarization and extraordinary partisan continuity from one election to the next, our Unified model provides scholars with a single theoretical framework to predict the results of U.S. national elections at the presidential and congressional levels. As we show here, our model performs comparably with the standard forecasting approaches at both levels, allowing us to use a single model to forecast elections without sacrificing predictive accuracy. Our model also makes use of new survey marginal data to develop new measures of party brands and relative candidate quality that can be used to assess future work on the temporal nature of presidential and congressional campaigns. While future work is needed to assess how these measures may vary over the course of the campaign timeline, our work here suggests that these mass opinion considerations carry profound implications for the collective partisan futures produced by the national outcomes of U.S. elections.
Supplemental Material
Supplemental Material - Presidential approval, party brands, and candidate quality in U.S. national elections
Supplemental Material for Presidential approval, party brands, and candidate quality in U.S. national elections by Carlos Algara, Byengseon Bae, Edward Headington, Hengjiang Liu, Bianca Nigri and Lisette Gomez in Research & Politics.
Footnotes
Acknowledgments
We thank Chris Hare and Walt Stone for helpful comments and suggestions on previous iterations of this project. We also thank panel participants at the 2024 Western Political Science Association Annual Meeting in Vancouver, BC for engaging with our work.
Funding
The author received no financial support for the research, authorship, and/or publication of this article.
Declaration of conflicting interests
The author declared no potential conflicts of interest with respect to the research, authorship, and/or publication of this article.
Carnegie Corporation of New York Grant
This publication was made possible (in part) by a grant from the Carnegie Corporation of New York. The statements made and views expressed are solely the responsibility of the author.
Supplemental Material
Notes
References
Supplementary Material
Please find the following supplemental material available below.
For Open Access articles published under a Creative Commons License, all supplemental material carries the same license as the article it is associated with.
For non-Open Access articles published, all supplemental material carries a non-exclusive license, and permission requests for re-use of supplemental material or any part of supplemental material shall be sent directly to the copyright owner as specified in the copyright notice associated with the article.