
Abstract
Many studies examine whether state repression deters or increases protest mobilization, yet empirical findings remain inconsistent. This study argues that mobilization depends less on the absolute level of repression than on how current repression deviates from what people have come to expect in a given context. It introduces discrepancy-based measures that capture these deviations relative to cumulative patterns of state violence, offering a context-sensitive alternative to conventional absolute measures such as fatality counts or arrests. Drawing on event-level data from ACLED, NAVCO, and SCAD, this article analyzes both country- and local-level panels using two-way fixed-effects regression and cumulative link mixed models. Across multiple datasets and specifications, the discrepancy measures consistently produce a U-shaped relationship: participation increases when repression is either higher or lower than established baselines. Comparisons with absolute measures show that the discrepancy approach more reliably explains variation in mobilization, helping to reconcile fragmented results in the repression–mobilization literature. These findings highlight the importance of expectations and contextual baselines in shaping how repression is interpreted and acted upon, suggesting that studies of contentious politics should move beyond static metrics toward measures that account for how actors evaluate state actions over time.
Keywords
Introduction
Many studies examine the consequences of state repression for protest mobilization, yet the empirical record remains highly inconsistent. This article argues that such variation arises because repression is typically measured in absolute terms, ignoring that its impact depends on how current levels compare to what people expect as normal in their context. Drawing on insights from political psychology and prospect theory, this article contends that mobilization is shaped by deviations from these contextual baselines rather than by absolute levels alone. To capture such deviations, this article develops two discrepancy-based measures, a time-weighted average and an exponential decay model, using event-level fatality data. It then tests whether these measures yield more consistent patterns of protest mobilization across multiple datasets and levels of analysis and compares them to absolute repression measures to assess their added value. The findings contribute to reconciling fragmented results in the dissent–repression literature and open avenues for future research on expectation-based measures of political violence.
Building on this premise, the article revisits the long-standing question: does repression increase or deter protest mobilization? Classic theories like resource mobilization and collective action argue that repression raises the costs of dissent, undermining organizational capacity, limiting strategic options, and deterring individuals through negative incentives (Khawaja, 1993; Kitschelt, 1986; Lichbach, 1994; McCarthy and Zald, 1977; Oliver, 1980; Olson, 1971; Tilly, 1978). These frameworks converge on the expectation that repression suppresses protest, a view reinforced by recent work (Zhukov, 2023).
However, protests often intensify following repression, challenging these cost-based arguments (Aytaç et al., 2018). To explain this, scholars have turned to emotion-based models. Anger and moral outrage, especially when repression is perceived as illegitimate, can motivate mobilization despite risk (Gurr, 1970; Saab et al., 2015; Siegel, 2011). Some theories propose a U-shaped relationship, where both low and high levels of repression fuel dissent by either encouraging action or provoking outrage (Pearlman, 2013). Others suggest an inverted U-shape: moderate repression incites protest, but extreme violence instills fear and suppresses dissent (Gurr, 1970).
While much of the literature relies on objective indicators of repression measured on a uniform scale, such as the number of fatalities or arrests (Francisco, 2004; Lewis and Ives, 2025; Rasler, 1996; Steinert-Threlkeld et al., 2022; Steinert-Threlkeld and Steinert-Threlkeld, 2021), this article argues that such measures overlook how repression is interpreted relative to context. The same objective level of repression can be understood highly differently depending on the sociopolitical context, making it essential to account for variation in how repression is situationally interpreted. To address this, the article proposes alternative indicators that capture deviations from cumulative repression trends, offering a proxy for what may be regarded as typical within a given context. When these new measures are applied, the relationship between repression and protest participation consistently follows a U-shaped pattern across multiple datasets and levels of analysis, whereas absolute repression measures produce inconsistent or contradictory patterns.
Theory
Repression is not experienced uniformly; rather, individuals interpret its severity relative to what they have come to expect as typical within their cultural and political context. For example, identical levels of repression may be interpreted differently across democracies and autocracies, depending on what is considered routine or exceptional. The same level of repression thus may prompt mobilization in one context while discouraging it in another. Employing repression variables with fixed values may therefore be problematic, as they assume a shared interpretive baseline. This reflects the logic of prospect theory. As Kahneman and Tversky (1979) note, attributes like health, prestige, and wealth are evaluated relative to a reference point: the same wealth may represent poverty to one person and affluence to another. The reference point and how individuals frame decisions are crucial to understanding behavior.
Rather than examining whether the absolute level of repression increases or deters mobilization, this study analyzes how current repression deviates from cumulative trends within a given context, serving as a proxy for what people come to see as typical. For instance, long-term low-level crackdowns may establish a stable baseline, making any sharp deviation feel exceptional. These exceptional episodes, in turn, can shift the contextual baseline depending on their intensity. Expectations are also shaped collectively, through social interaction, media, and observation of others, producing shared understandings of what is routine versus exceptional.
The literature suggests two broad possibilities. First, repression within expected bounds may be viewed as routine and fail to provoke strong reactions. But sharp deviations, either unexpectedly mild or harsh, may signal change, potentially creating a sense of opportunity or urgency that spurs mobilization. Second, expected repression may signal strategic stability and encourage action, whereas unexpected shifts introduce uncertainty, which could suppress participation.
This study examines whether deviations from expected levels of repression follow a U-shaped or inverted U-shaped relationship with mobilization, treating the shape of this relationship as an open empirical question. It argues that the discrepancy-based measure, capturing the gap between current repression and cumulative trends, yields consistent patterns of mobilization across multiple datasets and levels of analysis, whereas absolute measures, as reflected in the current literature, do not exhibit such consistency.
The discrepancy-based measure will yield a consistent U-shaped or inverted U-shaped relationship between repression and mobilization across datasets and levels of analysis.
The absolute measure will produce inconsistent relationships between repression and mobilization across datasets and levels of analysis.
Indicators
Linear decay reference gap
To capture the reference point of individuals, the article defines a dynamic, time-weighted average of prior fatality levels up to day t as follows:

The article considers all prior days s < t, where each day s has an associated fatality count

The term
Exponential decay reference gap
Linear decay weighting effectively prioritizes recent repression while still accounting for longer-term patterns, but because it normalizes time distance using the dataset’s maximum lag, the resulting weights can be sensitive to the observed time span and may not align with psychologically meaningful memory horizons.
To address this problem, an alternative metric using exponential decay can be employed. Unlike linear decay, exponential decay applies a fixed rate of decline over time, making the relative weighting of past events independent of the total length of the dataset. This approach draws on psychological research suggesting that memory decays exponentially over time, with individuals weighing recent experiences more heavily when forming expectations (Anderson and Schooler, 1991; Loftus, 1985). This study proposes an expectation measure based on previous fatalities using an exponential decay by the following formula:

In this formulation,
Accordingly, these metrics do not simply count how many died due to repression. They address the question of whether the level of violence on a given day exceeds or falls short of what people reasonably anticipated based on past patterns. In doing so, they help illuminate the psychological mechanisms that might explain why some violent events trigger protest, outrage, or fear, while others do not. They quantify the shock value of repression, not just its scale.
Figure 1 shows, as an example, daily fatalities, reference points, and discrepancy trends in the Ivory Coast using linear decay weighting, using SCAD. Sharp spikes in fatalities around 2002 and 2005 raise the reference point significantly, which stays elevated for years. Consequently, even with the substantial number of fatalities after 2005, some discrepancy values remain negative. Importantly, these discrepancy trends differ markedly from the raw fatality patterns. Refer to the following Research Design section and the Appendix for details on the SCAD data and the variables used. Discrepancy trend using linear decay scheme in the Ivory Coast.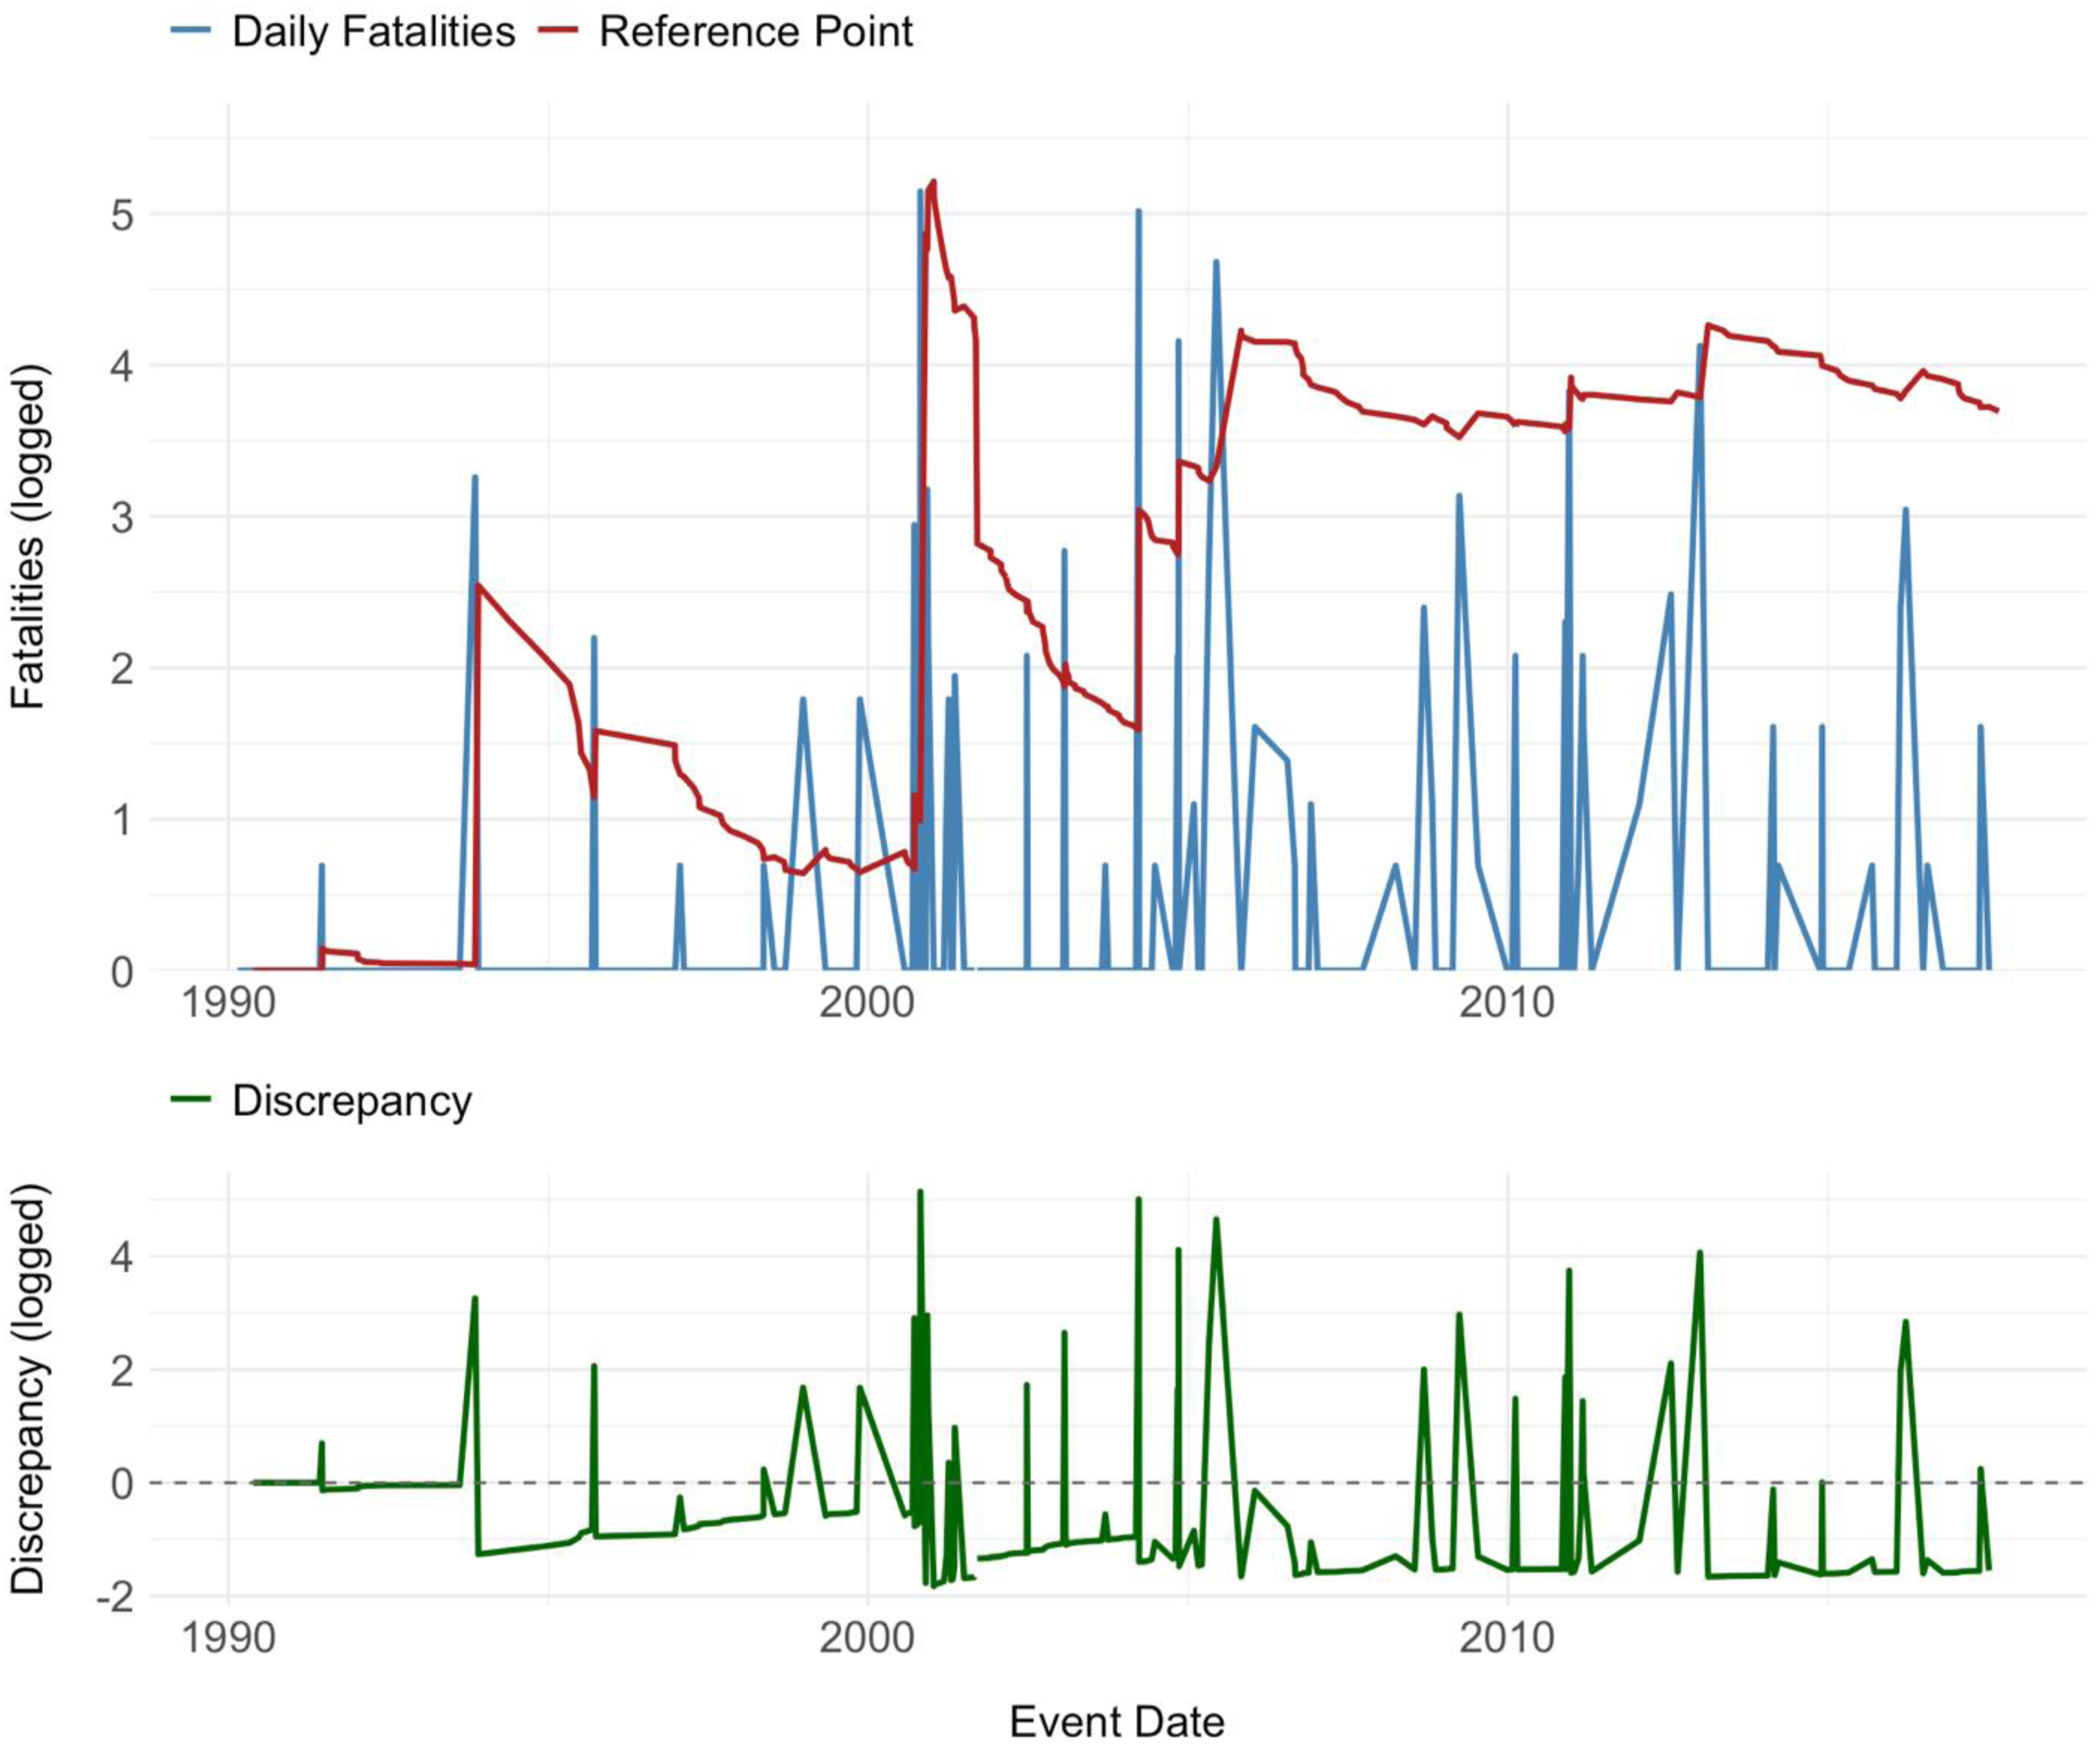
Figure 2 presents country-level root mean square deviation (RMSE) differences (ΔRMSE = RMSE difference by country (SCAD).
Research design
Data
This study utilizes three datasets: the Armed Conflict Location and Event Data (ACLED), Nonviolent and Violent Campaigns and Outcomes (NAVCO 3.0), and the Social Conflict Analysis Database (SCAD) (Chenoweth et al., 2018; Raleigh et al., 2010; Salehyan et al., 2012). As each dataset contains both country-level and administrative-level location data, the study estimates two regression models per dataset, one at each level, resulting in a total of six models. To construct the panel structure, variables are aggregated by country–event date and by administrative location–event date. For ordinal variables, the maximum value observed within the same country–event or locality–event is used. 2 Using a country–event date panel implies that individuals form their reference point for repression at the national level, taking into account all repressive incidents occurring across the country. On the other hand, using an administrative location–event date panel suggests that individuals form this reference point more locally, based on the repressive events that occur within their immediate communities.
For ACLED, this article utilizes a subset, focusing on protest and riot events in Eastern, Middle, and Western African countries between February 1997 and February 2025. 3 Since the article investigates how protesters respond to state repression, it restricts the sample to events involving interactions between protesters or rioters and state forces. 4 This yields final datasets of 841 events at the administrative level and 775 at the country level, after excluding observations with missing values across all relevant variables.
NAVCO 3.0 spans from December 1990 to December 2012 and comprises 1780 observations at the administrative level and 2906 at the country level, following the exclusion of entries with missing values on any key variables.5,6 Finally, the SCAD dataset spans from January 1990 to December 2017 and includes events from both African and South American countries, resulting in 6106 observations at the local administrative level and 5966 observations at the country level. Since SCAD reports a start and end date for each event rather than a specific single date, the analysis uses the midpoint between the two as the event date. The study uses a subset of SCAD, focusing on nonviolent events, including organized and spontaneous demonstrations, riots, and both general and limited strikes.
Variables
The dependent variable in all models is the size of protests. For ACLED and NAVCO 3.0, the logged number of participants is used, while SCAD employs an ordinal measure of participant size due to the absence of raw participant counts in the dataset. For the ACLED and NAVCO 3.0 datasets, the dependent variable is forward-leaded, meaning that all independent and control variables are lagged to ensure proper temporal ordering. In contrast, the dependent variable in SCAD is not forward-leaded. This is because the wide temporal gaps between events in SCAD make it implausible that a protest emerging weeks or months later is meaningfully driven by a repression-induced shock that occurred much earlier.
The independent variable is an orthogonal polynomial transformation of the discrepancy metrics introduced above. This article employs orthogonal polynomials rather than standard polynomial terms to reduce multicollinearity between polynomial components, thereby improving numerical stability and interpretability in the regression analysis. 7
Control variables for the NAVCO 3.0 and SCAD analyses include the Electoral Democracy Index (Teorell et al., 2019), the Local Government Index, measuring the presence of elected local governments and their autonomy from unelected local actors, sourced from the Varieties of Democracy dataset, as well as GDP per capita and population (Fariss et al., 2022). For the ACLED analysis, indicators for whether an event was a protest rather than a riot and whether it involved civilian targeting are also included. Yet, GDP per capita and population are excluded, as their inclusion substantially reduces the number of available observations. All models across datasets control for the number of protest events occurring in the prior 365 days.
Results
Figure 3 and 4 compare the marginal effects of the discrepancy-based and absolute repression measures across datasets and levels of analysis. For ACLED and NAVCO 3.0, estimates come from two-way fixed effects panel models that control for both unit and time heterogeneity. For SCAD, cumulative link mixed models (CLMM) with random intercepts by administrative unit are used, as the irregular timing of events and the ordinal outcome structure make time fixed effects less appropriate and risk model non-convergence. 8
Figure 3 shows that the discrepancy-based measure, implemented with a linear decay scheme, yields a consistent U-shaped relationship between repression and mobilization across all datasets and levels of analysis. In most cases, both polynomial terms are statistically significant, underscoring the robustness of this pattern.9 By contrast, Figure 4 reveals that the absolute repression measure produces inconsistent results: some models show an inverted U-shape, others a linear decline, still others a U-shape, and some a linear increase. These findings align with the hypotheses that the discrepancy-based measure captures a stable repression–mobilization relationship, whereas the absolute measure does not. Marginal effects of repression deviations using linear decay scheme across different datasets and levels. Marginal effects of simple repression across different datasets and levels.

Conclusion
This article advances the literature on the dissent–repression nexus by introducing discrepancy-based indicators that capture how deviations from cumulative patterns of state violence, rather than absolute levels alone, shape protest dynamics through contextual expectations. Unlike static or uniform repression measures, the discrepancy approach explicitly measures the gap between expected and actual repression, allowing it to explain mobilization outcomes in a way that is both theoretically grounded and empirically consistent. Drawing on political psychology, prospect theory, and contentious politics, this framework helps reconcile long-standing divergent findings in the field. The empirical results further underscore this advantage: across multiple datasets and units of analysis, the discrepancy-based measure consistently produces a robust U-shaped relationship between repression and mobilization, while the absolute measure yields inconsistent patterns. This consistency provides strong nomological validity and strengthens the case for adopting the discrepancy measure as a conceptually and empirically superior indicator of how repression is interpreted relative to cumulative trends (Adcock and Collier, 2001).
Future research could extend this framework by applying it to other forms of repression, such as arrests, imprisonments, or surveillance, using data sources like CIRIGHTS; exploring how individuals form reference points through qualitative methods; and leveraging digital data to track perceptions of repression in real time.
Supplemental Material
Supplemental Material - When repression surprises: Contextual deviations and protest mobilization
Supplemental Material for When repression surprises: Contextual deviations and protest mobilization by Hansol Kwak in Research & Politics
Footnotes
Acknowledgments
I am thankful to David Cunningham for insightful comments that significantly helped the development of this article.
Funding
The author received no financial support for the research, authorship, and/or publication of this article.
Declaration of conflicting interests
The author declared no potential conflicts of interest with respect to the research, authorship, and/or publication of this article.
Data Availability Statement
The data is available upon request.
Carnegie Corporation of New York Grant
This publication was made possible (in part) by a grant from the Carnegie Corporation of New York. The statements made and views expressed are solely the responsibility of the author.
Supplemental Material
Notes
References
Supplementary Material
Please find the following supplemental material available below.
For Open Access articles published under a Creative Commons License, all supplemental material carries the same license as the article it is associated with.
For non-Open Access articles published, all supplemental material carries a non-exclusive license, and permission requests for re-use of supplemental material or any part of supplemental material shall be sent directly to the copyright owner as specified in the copyright notice associated with the article.