
Abstract
Understanding the role of emotions in protest is a growing field of research, but existing research does not address the role of emotions once protests start. By applying computer vision models to the expressed emotions of 37,558 faces in 7,824 geolocated protest images across twelve protest waves in ten countries, this article contributes to the study of emotions and protest. Most importantly, it measures emotions within protest waves, not before them. It also investigates emotions’ temporal effects, measures multiple emotions simultaneously, connects emotions directly to actual protests, and analyzes data across multiple countries. The results suggest that anger, disgust, fear, happiness, sadness, and surprise occur simultaneously throughout a protest, though happiness peaks on the first day. Emotions sometimes correlate with protest size in unexpected directions, and the coefficient signs differ by country. The most consistent finding is that models without lagged terms outperform those with lags, suggesting emotions and protests covary more than the former causes changes in the latter.
Introduction
Existing research has established that emotions impact protest mobilization (Aytaç et al., 2018; Pearlman, 2013; Verhulst and Walgrave, 2009; Young, 2019), but five gaps remain. First, very little research analyzes emotional mobilization during a protest. Second, theory is ambiguous: emotions are instantaneous reactions to events, but also precede mobilization. Third, multiple emotions are rarely considered simultaneously. Fourth, tests of how emotions interact with protest participation seldom measure actual protest participation. Fifth, whether or not emotions and protest participation have the same relationship in different countries, or at different times, is unclear.
This article attempts to fill these gaps by studying expressed emotions in 310,041 geolocated tweets with images, 7,824 of which are protest images containing 37,558 individual faces from twelve protest waves in ten countries. A computer vision model detects protest images and counts faces, while another assigns one of anger, disgust, happiness, neutral, surprise, fear, and sadness to each face. A third model estimates protester and state violence. Images are aggregated to the country-city-day, and two dependent variables, protest size and the percent of faces containing a particular emotion, are developed.
This article complicates the understanding of emotions and protest in several ways. All emotions except for surprise are positively associated with contemporaneous protest size, but, when considered simultaneously, only anger is. Larger protests are associated with a greater percentage of every emotion: protests are emotional, not dominated by a specific emotion. Differences emerge when comparing contemporaneous and lagged models. Only happiness and surprise are significantly correlated with subsequent protest size, and then with signs opposite of theoretical expectations. Previous protests are only statistically associated with increased angry and disgusted faces. Models with lagged variables also explain less variation in protest size and emotions than contemporaneous models. Finally, emotions’ statistical significance varies across protest waves and sometimes switches signs, suggesting that how emotions and protest interact varies by country; emotions matter differently at different times.
Motivation
There exists a growing literature analyzing emotions and contentious politics. This literature describes emotions as affect or reactive, with the latter driving action (Jasper, 1998). In turn, reactive emotions can mobilize or demobilize. Mobilizing reactive emotions such as anger, joy, and pride embolden protesters and bystanders by emphasizing the value of dignity, expanding one’s sense of identity and promoting optimism and risk acceptance. Demobilizing reactive emotions such as fear, sadness, and shame emphasize security, causing individuals to make pessimistic assessments and doubt their individual efficacy. (Pearlman, 2013). Field experiments confirm the mobilizing effect of anger and demobilizing effect of fear (Young, 2019, 2023).
This article starts to fill five gaps in the existing literature. First, the article’s biggest contribution is to study emotions within a protest wave. The difficulty of measuring emotions during protests means how they vary within a protest wave has received less consideration. For example, though anger and joy are theorized to mobilize, participant recollections describe joy as resulting from mobilizing, not causing it (Pearlman, 2018; Zhao, 1998). Moreover, since reactive emotions are transient by definition, they may vary during a protest. For example, protesters may arrive at a protest feeling neutral but develop anger in response to seeing others express it; certain emotions may therefore result from protest mobilization.
Second, given the novelty of the first contribution, it is theoretically unclear if emotions and mobilization interact concurrently or with a lag. On one hand, the literature’s focus on transitory emotions suggests they affect mobilization as they happen. Yet researchers commonly ask about individuals’ emotional state before protesting (Pearlman, 2013; Verhulst and Walgrave, 2009), implying transitory emotions operate on at least a day’s lag. This article’s research design enables a discriminatory test of these competing expectations.
Third, existing research focuses on singular emotions, yet emotions do not occur in isolation. For example, many first-time protesters report feeling motivated by anger (mobilizing) and powerlessness (demobilizing) to participate (Verhulst and Walgrave, 2009). In Zimbabwe, asking subjects to remember a time they were afraid increases reported fear (demobilizing) but also anger, disgust, and surprise (mobilizing emotions). Since mobilizing and demobilizing emotions occur simultaneously, the net effect of either is not a priori clear.
Fourth, existing research rarely directly measure protests. Case studies rely on participants’ memory and may suffer from social desirability bias. Experiments on emotions and protest participation use proxies for participating, such as selecting a pro-democracy wristband after the experiment (Young, 2019) or engaging in online discussion (Young, 2023). Studies that connect emotions to political engagement focus on voting (Panagopoulos, 2010), participating in a political campaign (Valentino et al., 2011), or donating to a non-profit organization (Paxton et al., 2020), not protest. These limitations are inherent to the ethical considerations of experiments, whereas this study’s use of observational data allows for the observation of emotions during protests. 1
Fifth, the difficulty of measuring emotion means no study analyzes emotion dynamics across multiple events. For example, emotions may play a greater role during protests for public goods than for particularistic ones such as student or labor reforms. We are aware of only one study that analyzes emotions across protests (Verhulst and Walgrave, 2009) and another dynamics during them (Zhu et al., 2022). This study’s data allows for the analysis of emotions within and across events.
Research design
Protest waves described by issue and date ranges.
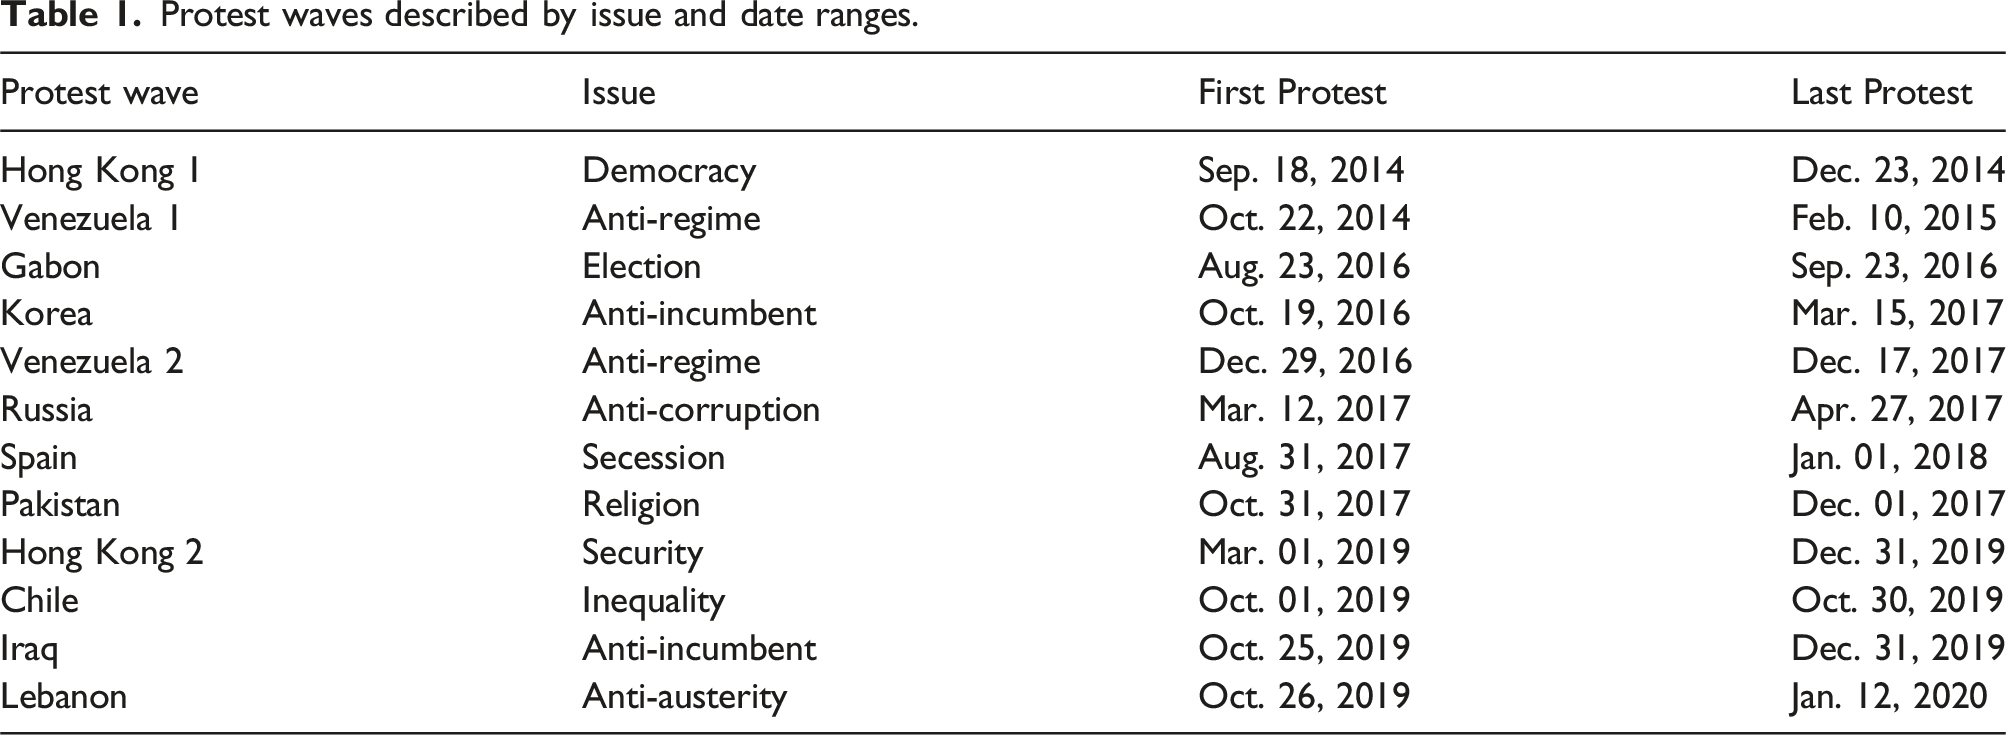
Three sets of variables are operationalized, all at the country-city-day level. The raw data are geolocated protest images shared on Twitter; Appendix A describes the data collection pipeline. First, the number of faces expressing emotions are measured from facial expressions in geolocated protest images from Twitter. Emotions are measured using Python’s
Figure 1 shows four sample images from Lebanon with expressed emotions labeled. In each figure’s right panel, the bar colors correspond to faces, so the longest bar per color is the estimated emotion for that face. Sample images from Lebanon with expressed emotion labels.
The first variable is emotion. To address concerns about measuring emotions from images, Figure 2 shows the distribution of anger, fear, happiness, neutrality, and sadness by protest and non-protest images as the number of faces changes.
5
(A subset of emotions are shown to reduce figure crowding. Figure A1 shows the distribution of all seven emotions by protest and non-protest image). There are a number of theoretical measurement threats to these variables, but they are not supported by the data. First, protest photos could exaggerate emotions if emotional expressions make for more appealing photographs. In fact, neutral emotions are the second most common one. Though they appear slightly more commonly in non-protest than protest images, Figure A1 shows that across image types, neutral faces are equally common. Second, protest images could underestimate fear because protesters who are fleeing from police or violence may not have time to take photographs; moreover, individuals may avoid publicizing images showing fear because they could make protesters look weak. The bottom two lines show that this is not the case: fear is the least common emotion in both protest and non-protest images, and they approximately equally common in both. Third, people pose for photographs and may express an emotion not congruent with their emotion at the rest of the protest. If that were the case, however, it is unlikely that the most prevalent emotion for protest images would be anger or the second most common neutral. In fact, anger is the most common emotion until a protest image contains 38 faces, when 28.3% are neutral versus 25.7% express anger. In addition, the second and third images in Figure 1 show that many of the emotions recorded are from faces of individuals not posing for photographs and, therefore, not at risk of introducing measurement error. Distribution of emotions by image type and number of faces.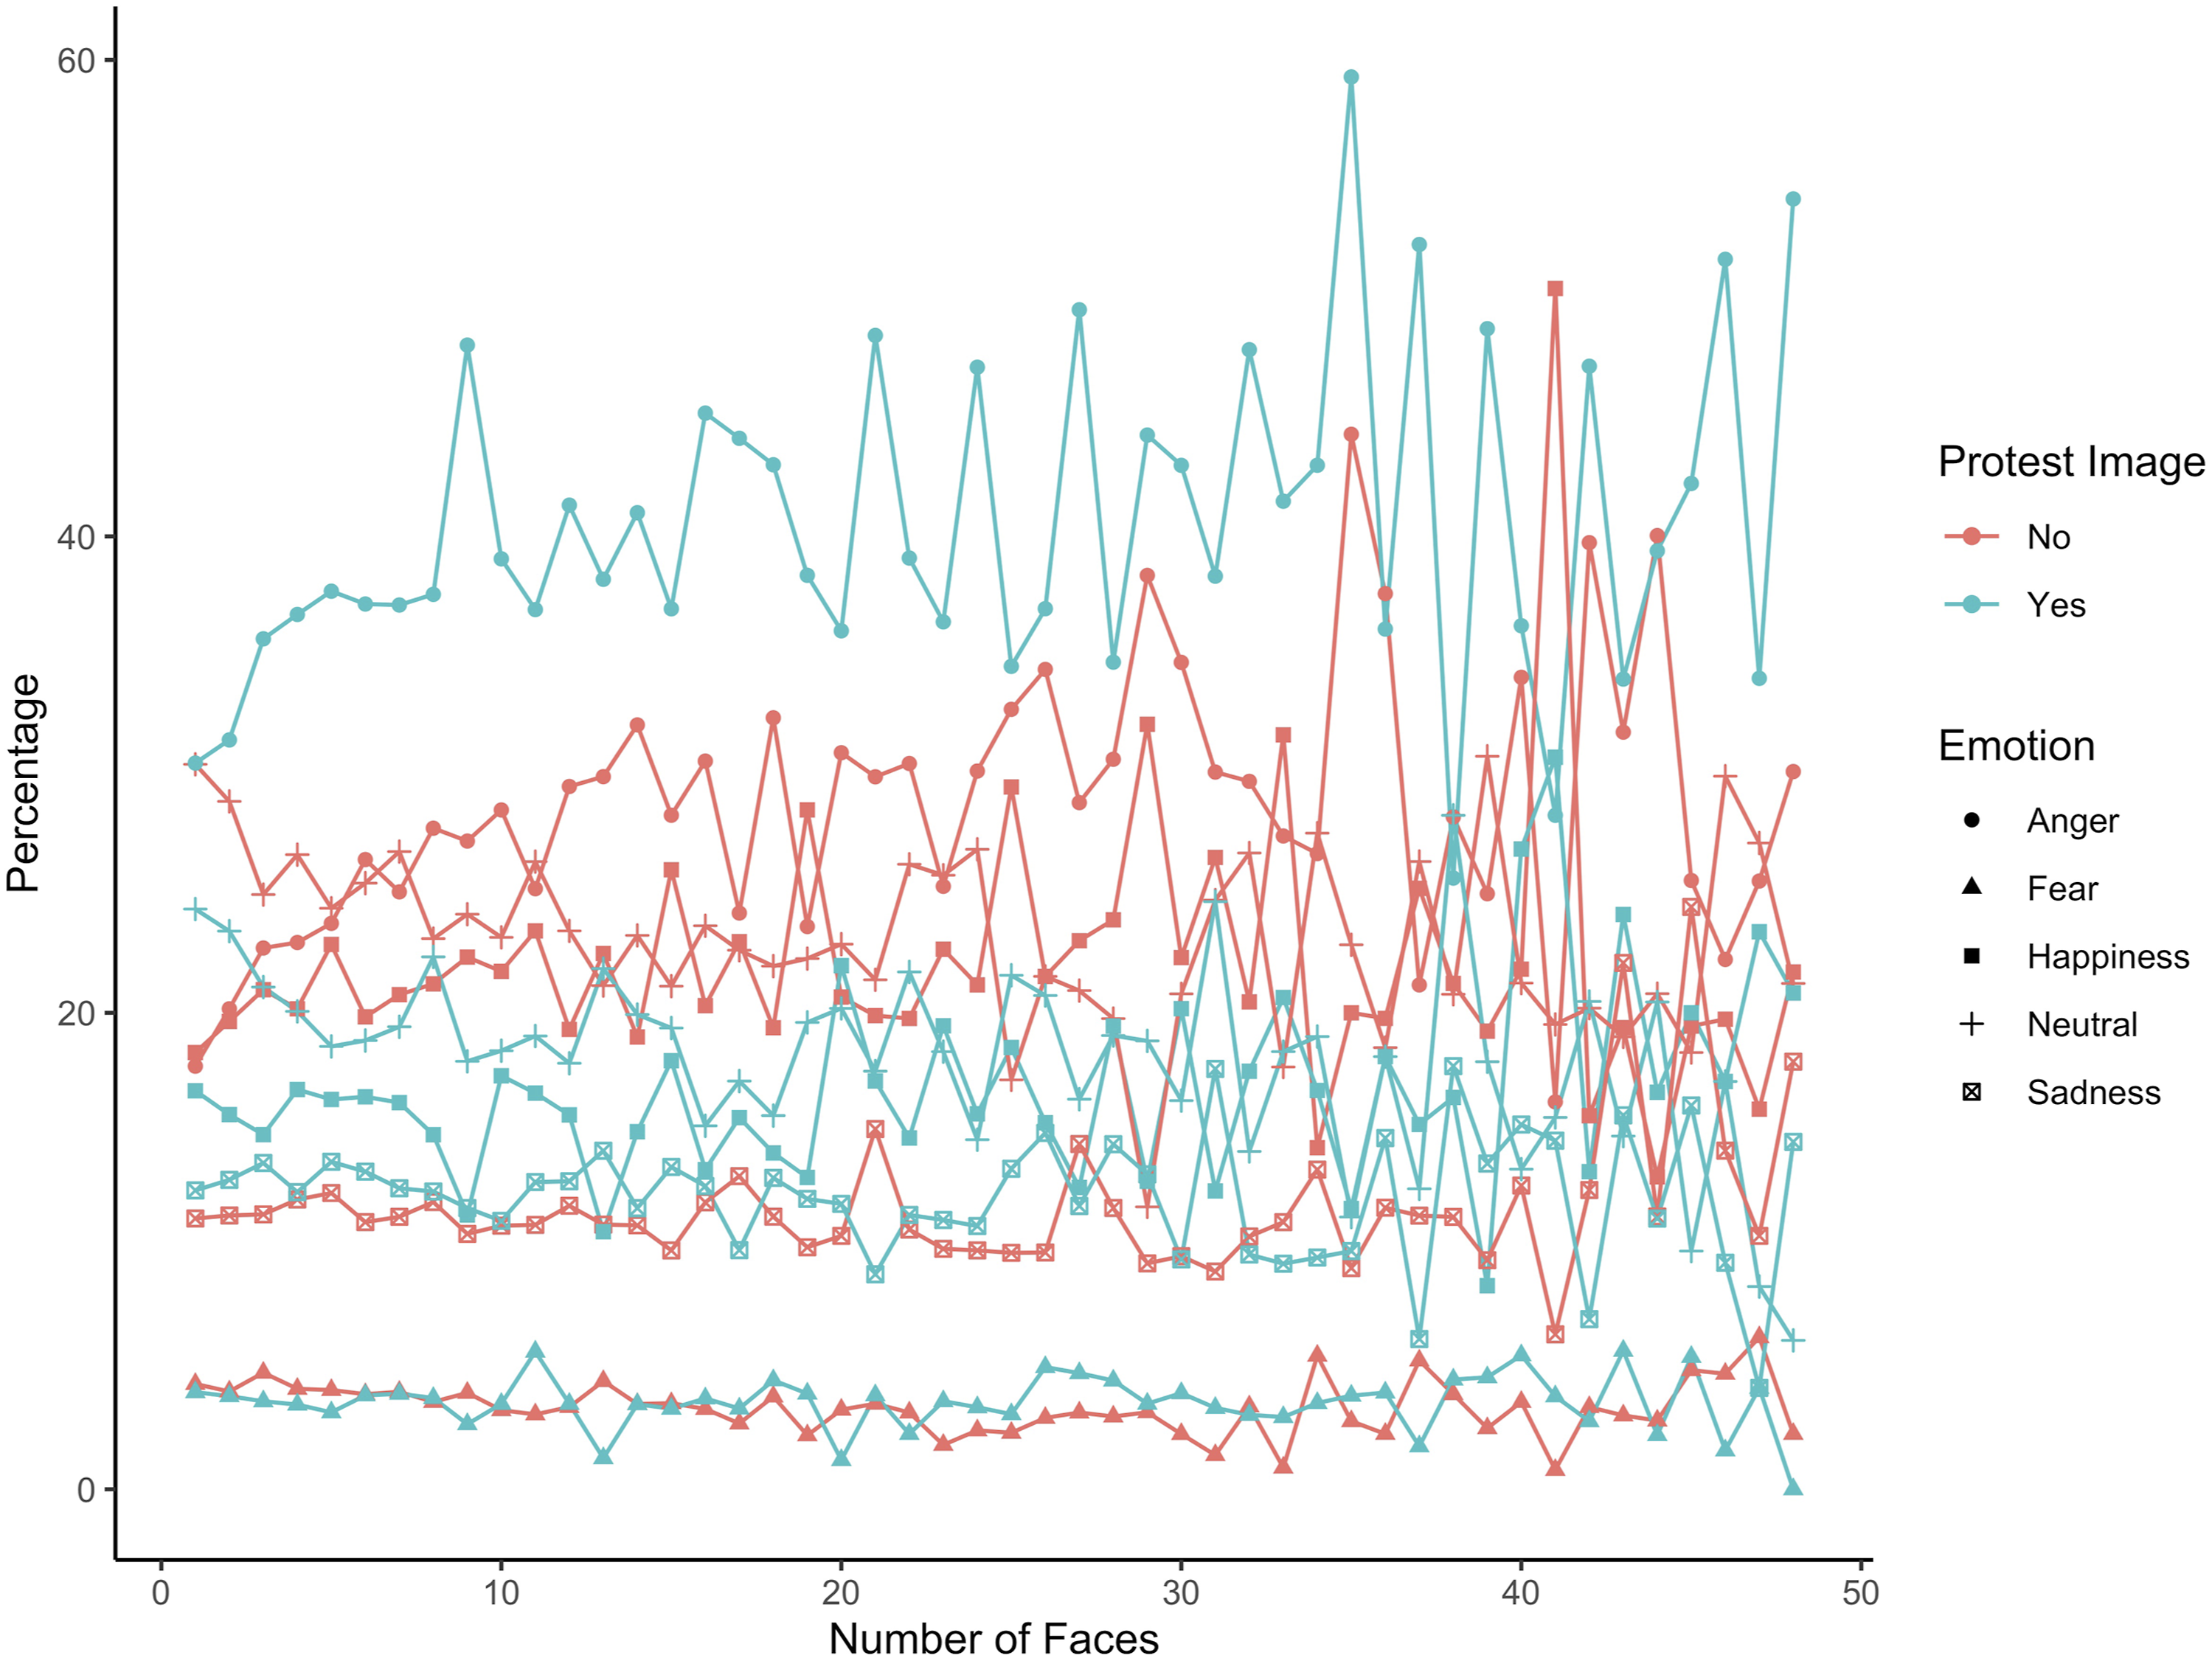
Second is protest size, the number of protesters per country-city-day, operationalized as the number of faces in protest photos. This operationalization faces two measurement threats. First, images of large crowds make it difficult to count faces, as they become too small for algorithmic detection or hidden by others’ bodies. However, prior research validates this operationalization with protest size estimates from cell phone location records and news article reports (Sobolev et al., 2020). Therefore, this article’s size estimates should also accurately measure protest size. In addition, the protest waves from Steinert-Threlkeld and Joo (2022a) and Steinert-Threlkeld et al. (2022b) are included in this study, and those articles validated their size using news articles. Second, fake images could distort protest size; manual inspection did not uncover fake images, and other work using geolocated tweets during contentious events also finds no evidence of manipulation (Gohdes and Steinert-Threlkeld, 2024; Walk et al., 2025). Table A1 shows summary statistics for these two sets of variables.
The third set of variables is measures of protester and state violence, again measured from protest images. Steinert-Threlkeld et al. (2022b) shows that protester and state violence affect protest participation and postulates that emotions are an intervening mechanism. Others show that state violence triggers emotional reactions (Aytaç, Schiumerini, and Stokes, 2018; Lebas and Young, 2024). These variables are therefore included as controls and are operationalized using the fine-tuned convolutional neural networks from Steinert-Threlkeld et al. (2022b).
Images shared on social media are an ideal source for studying protests and reactive emotions for several reasons. Because reactive emotions are transient, they may be difficult to recall after the fact; images record them, making them available for later study. Protest images are also likely to contain faces, facilitating the measurement of expressed emotion (Scholz et al., 2025). Further, which participants are featured in an image depends on who takes the picture. When images are from news articles, crowds of angry, often violent, individuals are prioritized (Chan and Lee, 1984); social media images come from a wide range of producers, ensuring a more representative sampling of protest participants (Cowart et al., 2016). In addition, the controversy over whether emotions can be measured from facial expressions suggests that, if they can, the effect will be weak, necessitating the large amount of data social media provides. Appendix B provides a longer discussion about measuring emotions from faces. Previous studies show that estimating protest size produces internally consistent estimates (Sobolev et al., 2020), and the violence models have been validated by human annotators (Steinert-Threlkeld et al., 2022). Finally, taking advantage of social media allows for the creation of panel data at the country-city-day level, the third literature gap described in the previous section. 2
Equations (1) and (2) show the two models this article estimates; the unit of analysis is city
i
on day
t
. Protest participation is natural logged, and emotions are the percent of faces containing that emotion. NoEmotion refers to faces detected in a photo but that were not able to have an emotion assigned. Since they contribute to the outcome but not an emotion, they are controlled for. All variables are demeaned, standard errors are city-clustered, and cities are weighted by the number of protest images from them. Lags are to the previous protest, which is not always the previous day; a robustness check shows this decision does not affect results.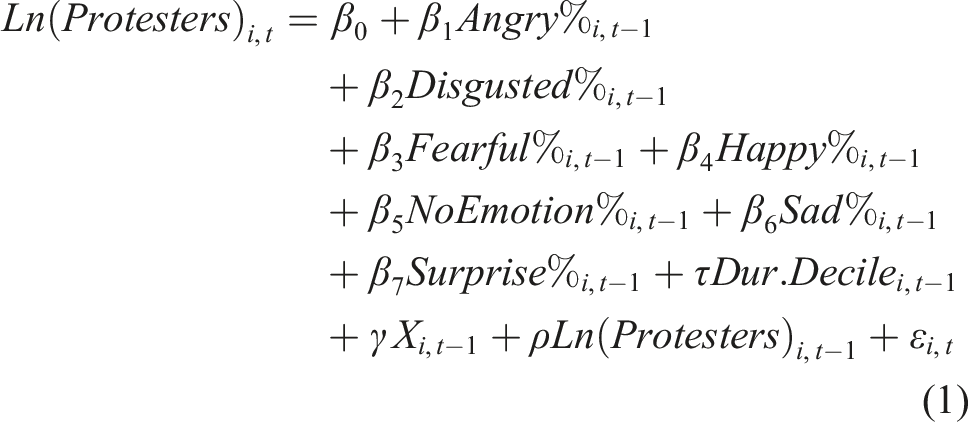

Each model contributes to addressing the five gaps in the literature. First, emotions are measured during protests, both as an outcome (how they change during a protest) and an input (if they affect protest participation). Second, each model is also estimated without lags, testing whether protest and emotions better predict each other contemporaneously or through time. Third, the models consider all detectable emotions simultaneously. Fourth, the data sampling strategy ensures protests are directly measured. Fifth, the data contain 105 cities from 12 countries, enabling comparative analysis.
Results
Regressing Protest Size Against Emotions.

City-clustered standard errors in parentheses. Figure A2 shows the duration control results.
Regressions are weighted by number of protest tweets per city-day.
Signif. Codes: ***: 0.01, **: 0.05, *: 0.1.
The contemporaneous models support different conclusions than the lagged ones. In the contemporaneous models, every emotion except surprise is positively and significantly correlated with protest size, though fear only at a 10% level. Except for sadness and anger, the emotions explain almost the same amount of variation in protest size. Anger explains the most, 15.826%, and sadness the second most, 8.704%. When all emotions are included, however, only anger retains statistical significance. Though emotions in the full model appear to explain 29.311% of the variation in contemporaneous protest size, the No Emotion model shows that faces with an unclassifiable emotion explain 27.837% of the contemporaneous protest size variation. Overall, the only emotion that appears to predict variation in contemporaneous protest size is anger, though not much.
Lagged emotions explain even less of the variation in protest size, though with some different inferences. All lagged models explain less variation than the contemporaneous equivalents, and the within R2 in the full model is 14.16% of the contemporaneous model (.04151/.29311). Only lagged happiness and surprise are statistically significant on their own, but only lagged happiness is in the full model. Lagged happiness is also negatively associated with protest size, the opposite of theoretical predictions.
Regressing the Percent of Faces Expressing Each Emotion Against Protest Size.

City clustered standard-errors in parentheses. Figure 3 shows the duration control results.
Regressions are weighted by number of protest tweets per country-city-day.
Signif. Codes: ***: 0.01, **: 0.05, *: 0.1.
Table 3 reveals several interesting patterns. For every emotion, contemporaneous protest size and state violence explain emotion variation much better than the previous day’s. The difference ranges from 12.03 (.11078/.00921) for anger to 1.4 (.01482/01058) for disgust.
3
In the contemporaneous models, protest size and state violence explains anywhere from 12.8% (fear, .00685/.05332) to 53.82% (anger, .11078/.20583) of the model’s variation. These percentages are much lower for the lagged models, with only one within R2 greater than .01 (disgust). Finally, larger protests are more emotional: the percent of faces with recognized emotions is higher for all emotions while the percent of faces with no recognized emotion is lower. Figure 3 shows that the time within a protest cycle does not consistently explain changes in emotions. Duration decile controls for Table 3.
Emotions as IV by Protest Wave.
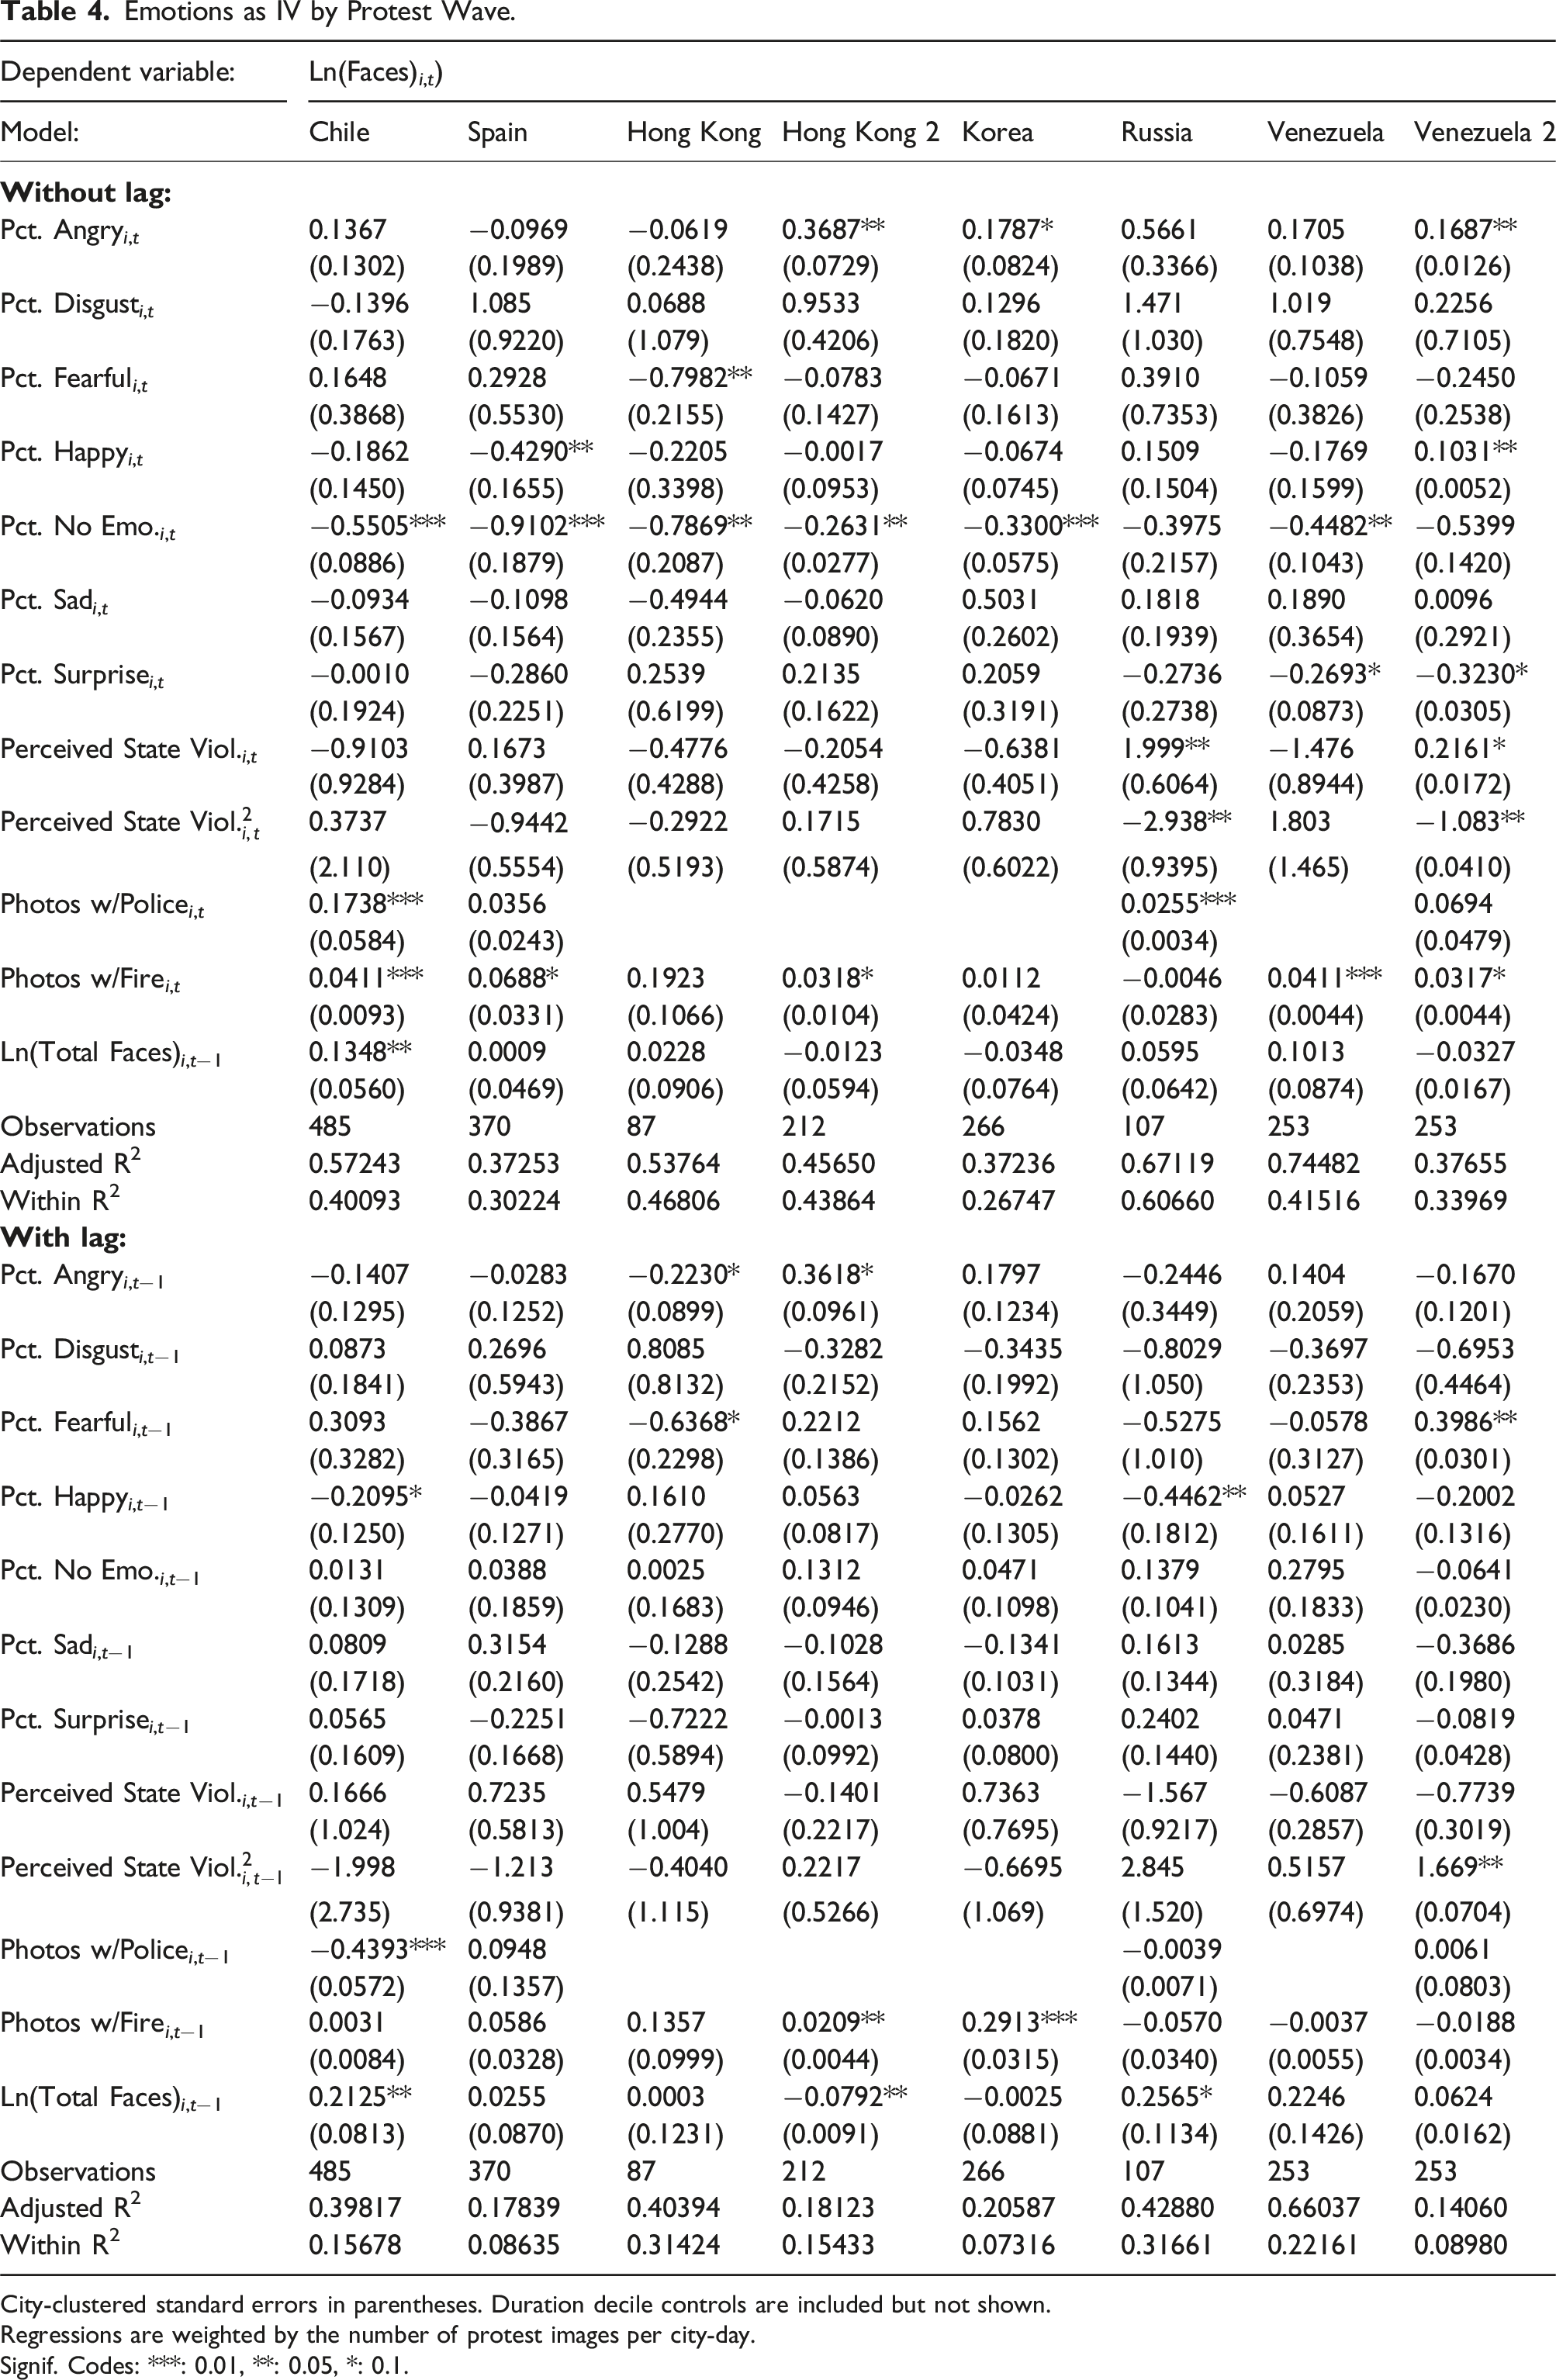
City-clustered standard errors in parentheses. Duration decile controls are included but not shown.
Regressions are weighted by the number of protest images per city-day.
Signif. Codes: ***: 0.01, **: 0.05, *: 0.1.
Appendix D shows three robustness checks that confirm these findings. First, Table A2 shows protest size is estimated as the sum of faces containing emotion, not the sum of all detected faces. Lagged happiness is no longer statistically significant, but its sign is still negative. The contemporaneous models still outperform the lagged ones. The anger model now explains half as much of the variation in the outcome as the original model, though the other models’ explanatory power is approximately the same. The same results hold when emotions are the outcome, as shown in Table A3. The new operationalization of protest size affects the anger model's fit but not the others, and signs and significance are largely the same.
Second, the models are rerun with the original dependent variable, but keeping only consecutive protests so that the lagged terms only capture protest the previous day, not the previous protest regardless of how many days have passed. Table A4 presents those results for the protest outcome models and Table A5 and Figure A4 for the emotion outcome models. The results are broadly consistent. Larger protests have a greater percentage of emotive faces. Contemporaneous anger is still the best explained emotion, but lagged emotions explain its variation about as well as they explain the other emotions. In the contemporaneous models, state violence is now statistically significant and still negatively correlated with surprised faces; high levels of state violence negatively correlate with fearful faces but positively does with surprised ones. In the lagged models, the only statistically significant variable is the number of photos containing police. It is negatively correlated with anger, disgust, and happiness. The duration controls remain statistically insignificant except for explaining the percent of happy faces, in which case they are negative and usually statistically significant: happiness peaks on the first day of protests.
Third,
Discussion
This article contributes to growing research about emotions and protests by providing the first large-scale, cross-national analysis of expressed emotions and protest dynamics. This contribution is possible by applying a series of computer vision models to protest images shared in geolocated tweets from ten countries and twelve protest waves. Aggregating these estimates to the country-city-day, regression results show that expressed emotions and protest size are most strongly correlated on the same day. In contrast, few expressed emotions at t − 1 are statistically significantly associated with changes in protest size, suggesting that expressed emotions are not associated with protest mobilization. Anger is the only variable to consistently correlate with protest size, and others that do frequently exhibit variation opposite of theoretical predictions.
One explanation of this article’s results could therefore be measurement validity, as the technology to measure expressed emotions from social media data is still emerging. There are known biases in datasets used to train models that estimate facial expressions (Rhue, 2018; Dominguez-Catena et al., 2022), so these results may not accurately measure expressed emotions. Twitter images are also naturalistic, whereas existing training data tends to use images taken from similar angles under good lighting, so models trained on them may produce noisier estimates when encountering faces in photos shared on social media.
Not only are the faces in images small, since humans do not consistently interpret the same facial expressions as the same emotions, a computer vision model may also have difficulty consistently estimating emotion. One method for studying this uncertainty is to measure the distribution of a classifier’s estimates across emotions. Face expression models generate confidence scores for however many emotions they are trained on, seven in the case of the model for this article. New findings show that analyzing the difference between the log of the highest probability and second highest probability labels recovers 60%–70% of mislabeled instances in political stance, ideology, and framing tasks (Farr et al., 2024). Understanding the distribution of emotion confidence scores is therefore a promising avenue for future work.
This article’s findings could also differ from others’ because of compositional change. While the data are panel at the country-city-day, the measured emotions are not: specific faces are not tracked across protests, so individuals expressing emotion at t − 1 are likely different than those observed protesting at t. By contrast, case studies and experiments measure the same individuals. Relatedly, this article does not and cannot measure the emotions provoked in bystanders observing a protest. To capture this dynamic, a machine learning model would need to be trained to estimate the provoked emotion from a protest image, not the emotions expressed in faces in images.
The difficulty of collecting data has limited research to focusing on single countries via experiments or retrospective case studies. That this article finds different results with more data could be due to theoretical underdevelopment or measurement error. As the ability to measure expressed emotions at scale continues to improve, continued development of theory and measurement is required.
Supplemental Material
Supplemental Material - Taken at face value: Emotion expression and protest dynamics
Supplemental Material for Taken at face value: Emotion expression and protest dynamics by Ishaan S. Prasad, Zachary C. Steinert-Threlkeld in Research & Politics
Footnotes
Acknowledgements
This project received invaluable feedback from Han Zhang, Lauren Young, John Wilkerson, Juan Tellez, Elena Sirotkina, Oliver Rittman, Joshua McCrain, Olga Gasparyan, Christina Cottiero, and Jihyeon Bae. Special thanks are also due to Tony Lei and Miner Ye for their research assistance. The authors are grateful to Rebecca Kittel for organizing the “How Image-As-Data Approaches Can Help Analysing Protest and Its Organisation: Methods and Applications” workshop, as well as the participants there and at the universities of Washington, Utah, and California-Davis.
Declaration of Conflicting Interests
The authors declared no potential conflicts of interest with respect to the research, authorship, and/or publication of this article.
Funding
The authors received no financial support for the research, authorship, and/or publication of this article.
Supplemental Material
Carnegie Corporation of New York Grant
This publication was made possible (in part) by a grant from the Carnegie Corporation of New York. The statements made and views expressed are solely the responsibility of the author.
Notes
References
Supplementary Material
Please find the following supplemental material available below.
For Open Access articles published under a Creative Commons License, all supplemental material carries the same license as the article it is associated with.
For non-Open Access articles published, all supplemental material carries a non-exclusive license, and permission requests for re-use of supplemental material or any part of supplemental material shall be sent directly to the copyright owner as specified in the copyright notice associated with the article.