
Abstract
Macroeconomic variables like unemployment, inflation, trade, or GDP are not set in stone: they are preliminary estimates that are constantly revised by statistical agencies. These data revisions, or data vintages, often provide conflicting information about the size of a country’s economy or its level of development, reducing our confidence in established findings. Would researchers come to different conclusions if they used different vintages? To answer this question, I survey all articles published in a top political science journal between 2005 and 2020. I replicate three prominent articles and find that the use of different vintages can lead to different statistical results, calling into question the robustness of otherwise rigorous empirical research. These findings have two practical implications. First, researchers should always be transparent about their data sources and vintages. Second, researchers should be more modest about the precision and accuracy of their point estimates, since these estimates can mask large measurement errors.
Introduction
How much did the economy of Equatorial Guinea grow in 2000? Between 2005 and 2020, the World Bank’s World Development Indicators (WDI) reported four different values for Equatorial Guinea’s 2000 GDP growth, from 1.47 to 18.2%. As Figure 1 shows and Johnson et al. (2013) confirm, this is no exception: researchers seeking to explain economic growth might come to different conclusions depending on their data source and version. As with growth, recent estimates of unemployment, inflation, or trade are preliminary and under constant revision, in what Croushore and Stark (2003) call “data vintaging.” GDP growth in 2000 for selected countries: Difference in values reported by different WDI releases.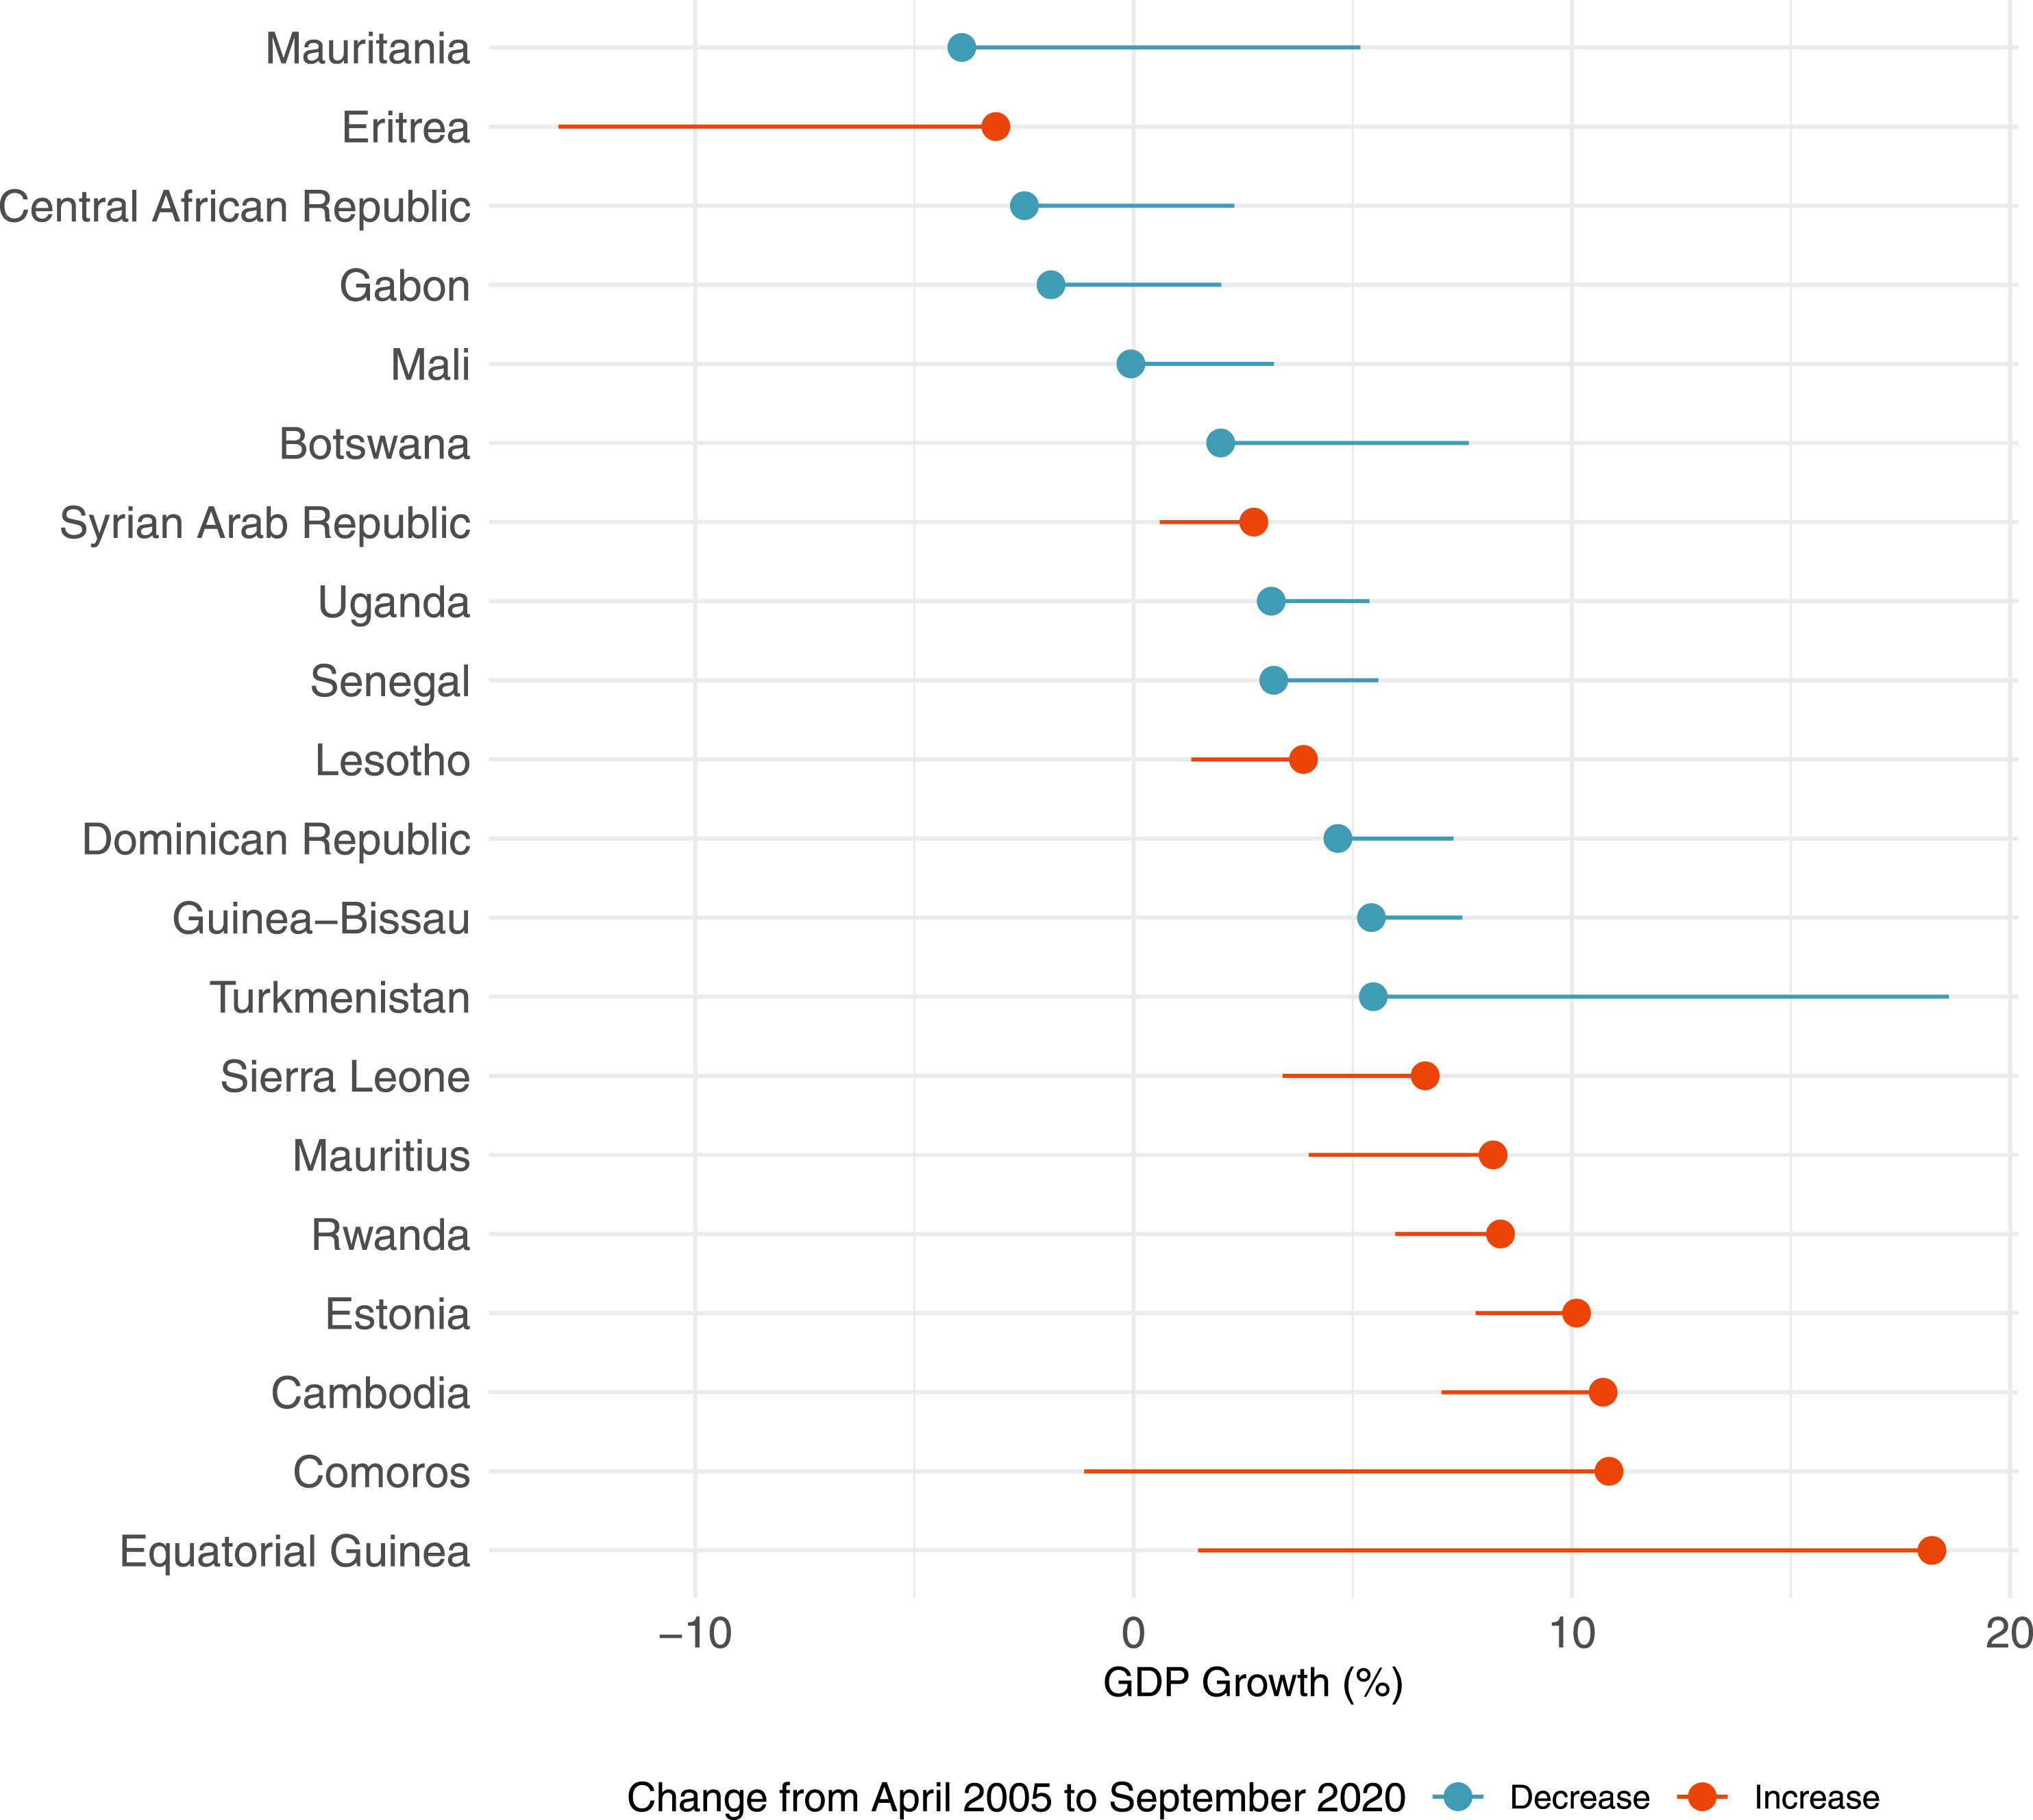
This study examines how data vintaging affects the replicability of published research. Would researchers come to different conclusions if they used different data? To answer this question, I survey all articles published in a prominent journal between 2005 and 2020, collecting detailed information about data usage, and replicate three articles using various data sources and vintages of the same source. I find that using different data can lead to different statistical results, calling into question the robustness of rigorous research. Researchers should not only disclose their data sources and vintages but also be more modest about the precision and accuracy of their point estimates, which can mask large measurement errors.
The logic behind data vintaging
Datasets like the WDI are revised to incorporate improved data, eliminate errors, and account for new price benchmarks (Ciccone and Jarociński, 2010). The WDI relies on data reported by national statistical agencies; as agencies improve their statistical capacity, they collect and disseminate better data. In 2014, for example, Nigeria’s GDP increased by 89% after the government updated the base year for calculations, incorporating information about the telecommunication and film-making industries (Kerner et al., 2017). International organizations advise governments to update their GDP base year at least every 10 years, but half of the 189 countries surveyed by Berry et al. (2018) use older base years, reporting figures that are likely biased downward.
New administrations are often eager to rectify the errors committed by previous administrations. Data manipulation increased under the Kirchner and Rousseff presidencies in Argentina and Brazil, respectively; in both cases, the successor came from a rival party and publicized these data issues (Aragão and Linsi, 2022). Shortly after coming to power, Prime Minister Papandreou requested help from Eurostat and the IMF to revise Greece’s public finance statistics, which had long been misrepresented to follow EU rules (Alt et al., 2014). Some countries deliberately report biased figures to seem poorer and meet World Bank eligibility criteria for foreign aid, though these figures are typically corrected ex post (Kerner et al., 2017).
Lastly, the WDI standardizes country-specific data using a purchasing power parity (PPP) adjustment set by the International Comparison Program (ICP) based on international price surveys. Until 1996, these surveys covered developed countries and made extrapolations for the rest of the world; updates in 2005, 2011, and 2017 began to cover developing countries (Deaton and Aten, 2017). Using satellite-recorded nighttime lights as a “true” measure of economic activity, Pinkovskiy and Sala-i Martin (2020) find that vintages based on newer ICP benchmarks have smaller measurement errors.
Data vintaging can be good news. The standardization methodology is improving: current estimates of the past are closer to the “truth” than past estimates of the past. It is better to revise inaccurate figures than to keep them consistently inaccurate. However, data vintaging calls into question the robustness of existing findings, since many vintages provide conflicting information. With few exceptions (Boehmer et al., 2011; Hollyer et al., 2014; Inklaar and Prasada Rao, 2017; Fariss et al., 2022), researchers did not examine these issues until recently Figure 2. Available observations by country, 1980–1999.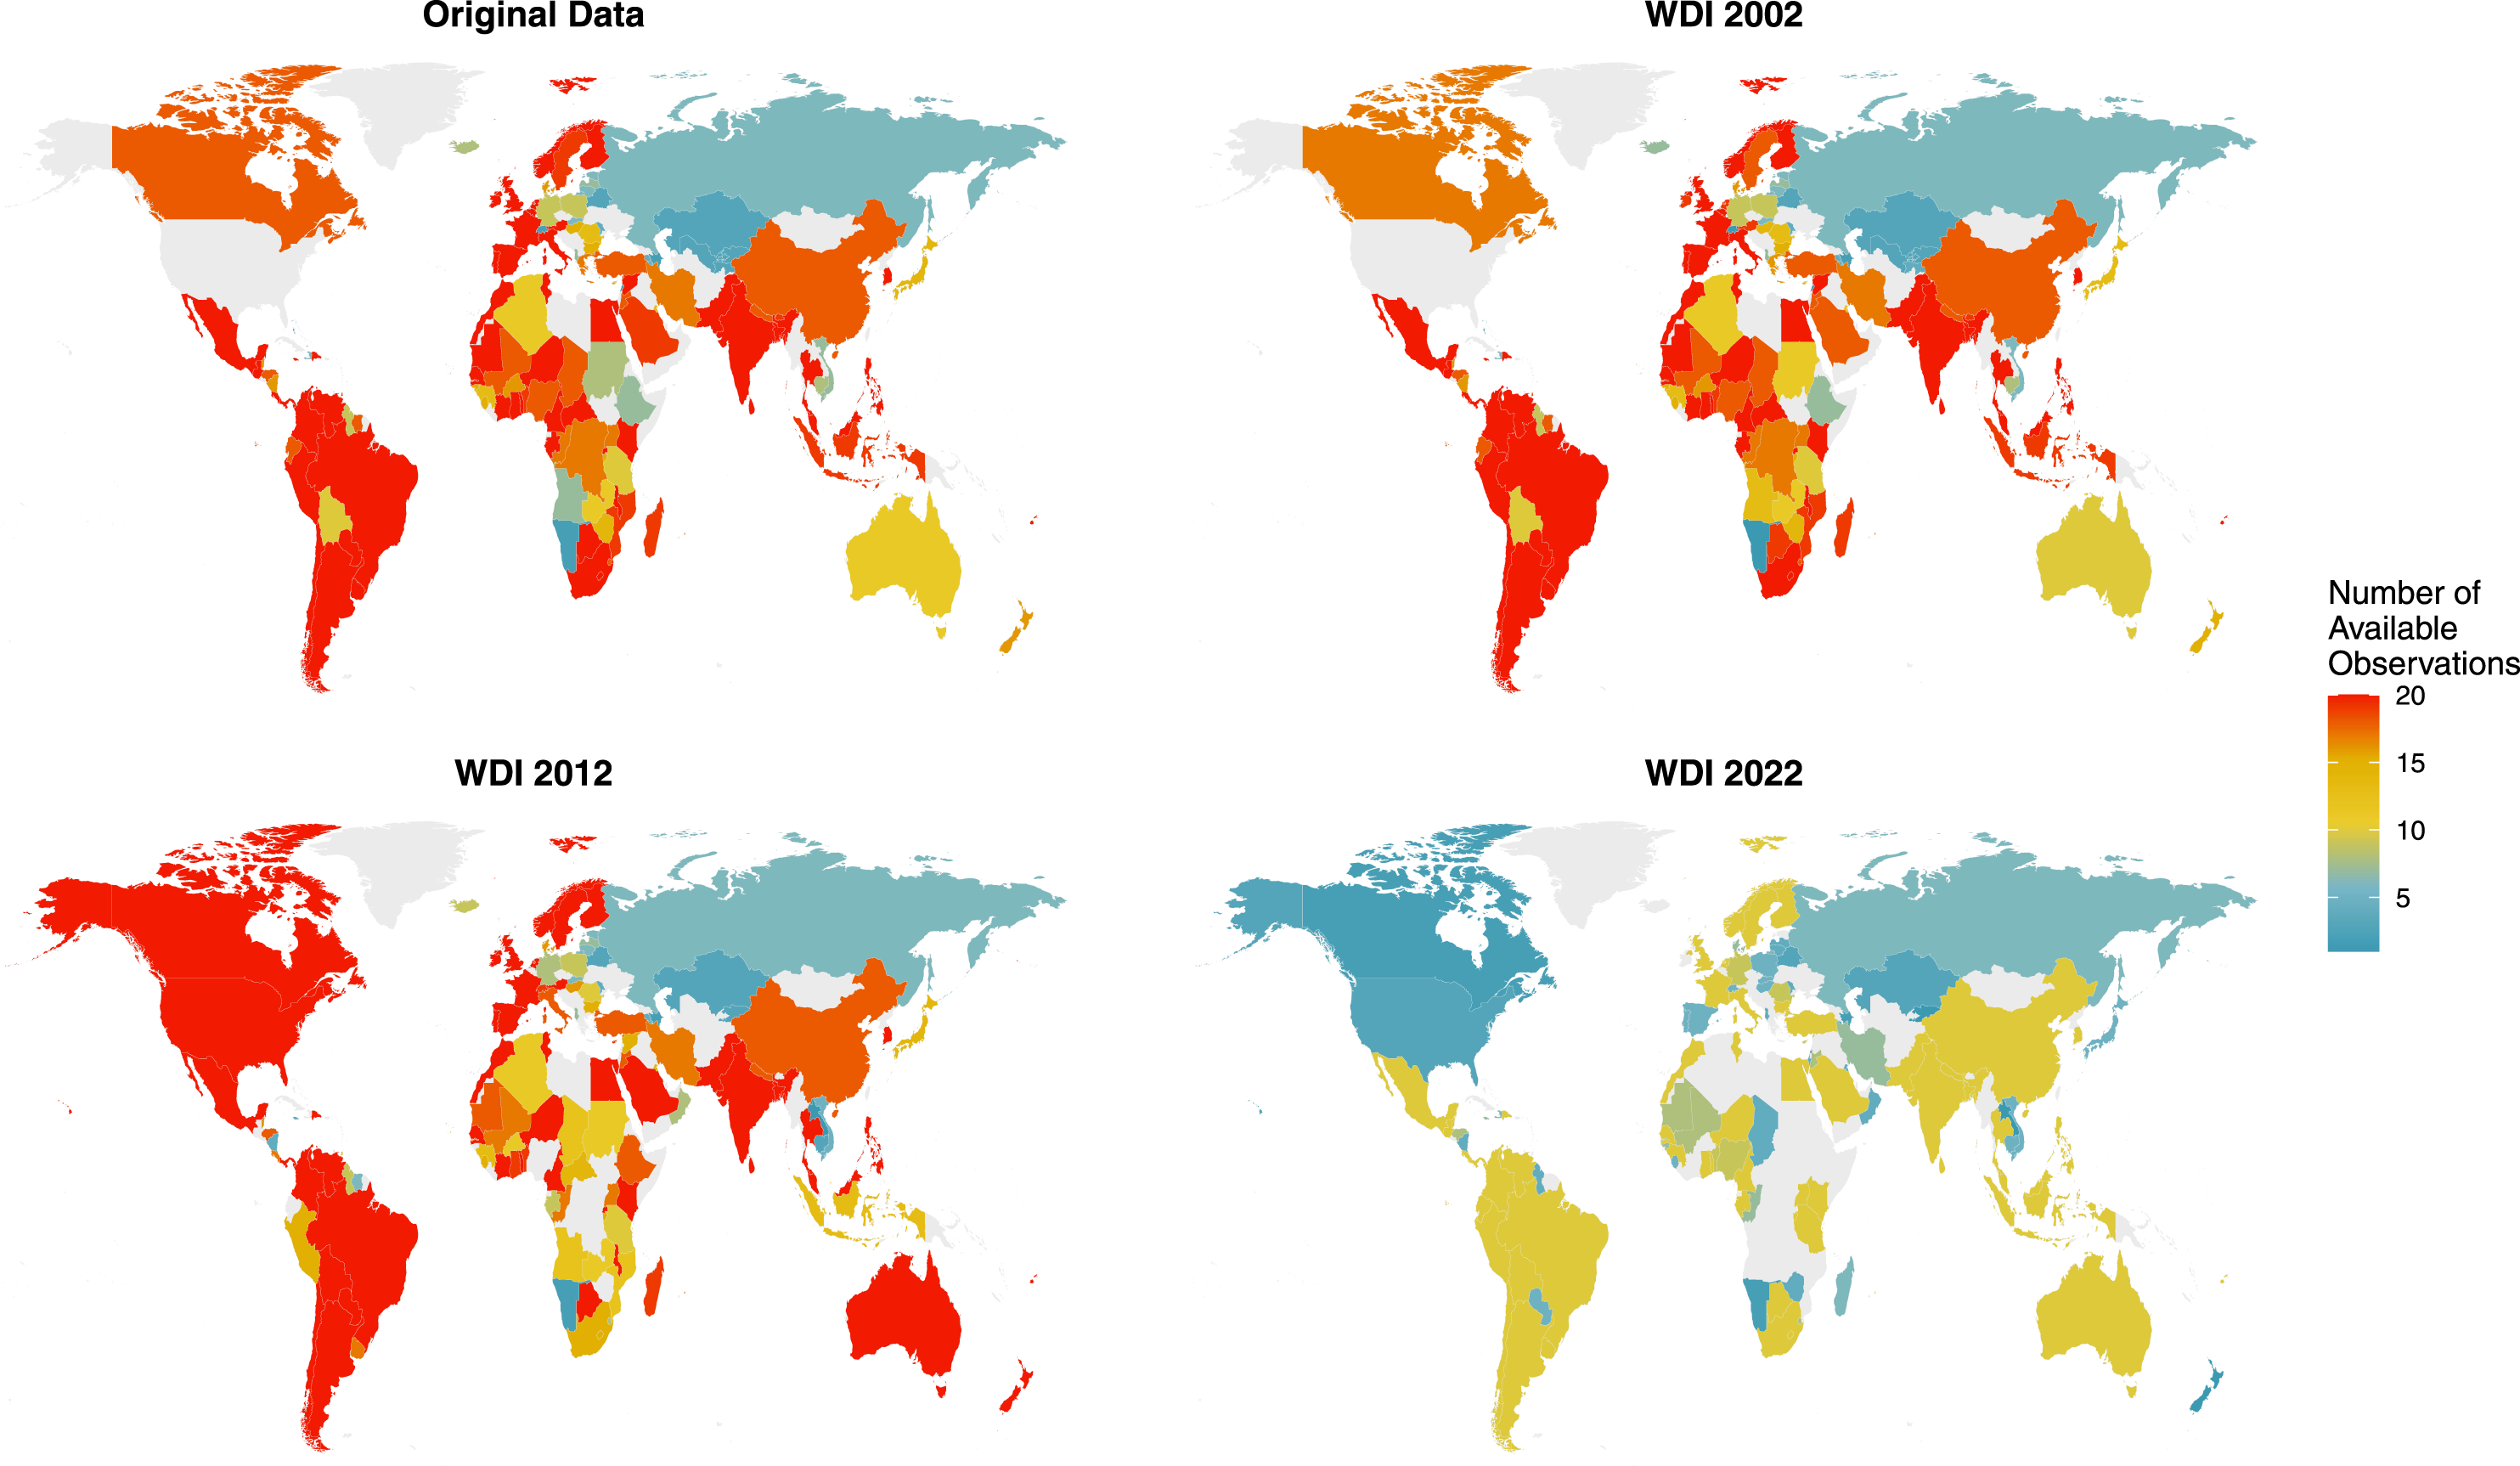
A survey of published studies
To gauge the prevalence of vintaged data in political science, I assembled all 459 research articles and research notes published in International Organization between 2005 and 2020, including special issues. Of these studies, 173 conducted a cross-country statistical analysis using contemporary macroeconomic variables, like GDP growth, unemployment, inflation, or trade. 1
Relevant studies published in International Organization according to data source, 2005–2020.

Among the studies that mention their data source, 106 use the WDI. Some combine multiple sources. To construct their GDP variable, Goldstein et al. (2007, 50) “turned first to the 2005 edition of the World Bank’s World Development Indicators …then extended the series backwards to 1946, using U.S. dollar figures from the Penn World Tables, the United Nations, the Oxford Latin American Economic History Database, and the IMF International Financial Statistics. In a few cases, we used the GDP indices from Maddison …to complete the data set.” Mansfield and Reinhardt (2008, 636, footnote 61) use GDP data “from a hierarchy of sources, starting with the World Bank’s World Development Indicators, the OECD’s Monthly Statistics of International Trade, UNCTAD’s Handbook of Statistics On-Line, the IMF’s World Economic Outlook, the Penn World Table version 6.1, and the IMF’s International Financial Statistics.” Yet, WDI, Penn World Table (PWT), and Maddison figures are quite different from each other—even if the underlying data are the same—due to differences in currency conversions or PPP adjustments. Ram and Ural (2014) identify 33 countries for which GDP estimates from the WDI and the PWT differ by at least 25%. It is unclear if authors combining multiple sources are aware of these differences or address potential discrepancies.
Instead of providing a direct source, 21 articles refer readers to Gleditsch (2002), who collected GDP, trade, and population data from PWT version 5.6, imputing missing observations and providing additional estimates from the CIA’s World Factbook. Others refer readers to Fearon and Laitin (2003), who used WDI data to extend PWT estimates for GDP growth. However, the data compiled by Gleditsch and Fearon and Laitin rely on older PWT and WDI vintages, which have larger measurement errors. Many authors do not know the true nature of the data underlying their empirical analyses, since they did not collect these data themselves.
Though 86.13% of all articles mention their data source, only 68.79% mention their data vintage, indicating a release date or version number (“World Development Indicators 2006” or “Penn World Table 5.6”). Given the differences between data vintages, this information should always be provided.
Empirical consequences of data vintaging
To show that even rigorous research is vulnerable to data vintaging, I use different sources and vintages to replicate three of the surveyed studies, selected following three criteria. First, they had to be transparent about their sources and vintages, allowing me to locate equivalent variables elsewhere. Second, these had to be older studies, ensuring that there were more recent comparable data. Third, supplementary materials (both data and replication code) had to be publicly available, allowing me to estimate the models exactly as published. Since the International Organization website does not provide supplementary materials for issues before 2011, my selection was restricted to authors who provided this information on their own websites.
De Soysa and Neumayer (2005)
Using data for 135 countries between 1980 and 2000, 2 de Soysa and Neumayer (2005, 732) show that economic globalization has a positive and statistically significant effect on sustainable development, defined as a state’s “ability to maintain (increase) the aggregate value of manufactured, human, and natural capital.” In eliminating price distortions and promoting an efficient allocation of resources across borders, globalization minimizes waste.
The outcome, genuine savings (% of GNI), combines six WDI variables. 3 The key independent variable, trade (% of GDP), comes from the WDI, as do six control variables: current GNI per capita in PPP; agriculture (% of GDP); GDP per capita growth (%); population; population density; and urban population (% of the total population). The random effects generalized least squares model also controls for regime type, fuel exporter status, political constraints, stability of the political system, occurrence of a currency crisis or a civil war, and number of peace years since 1946.
All WDI variables come from the 2002 release, though data for Angola and Sudan come from the 2003 release “because their values seem to be reported with errors” (de Soysa and Neumayer, 2005, 740, footnote 56). Upon closer inspection of the 2002 data, the genuine savings rate for Angola and Sudan is exceptionally low, but the World Bank (2023) did not flag these countries as problematic, and more recent releases report similarly extreme values. Even if the 2002 vintage suffers from measurement error and the 2003 vintage does not, there is no evidence that this error is limited to Angola and Sudan.
The effect of trade dependence on genuine savings (random effects GLS), 1980–1999.
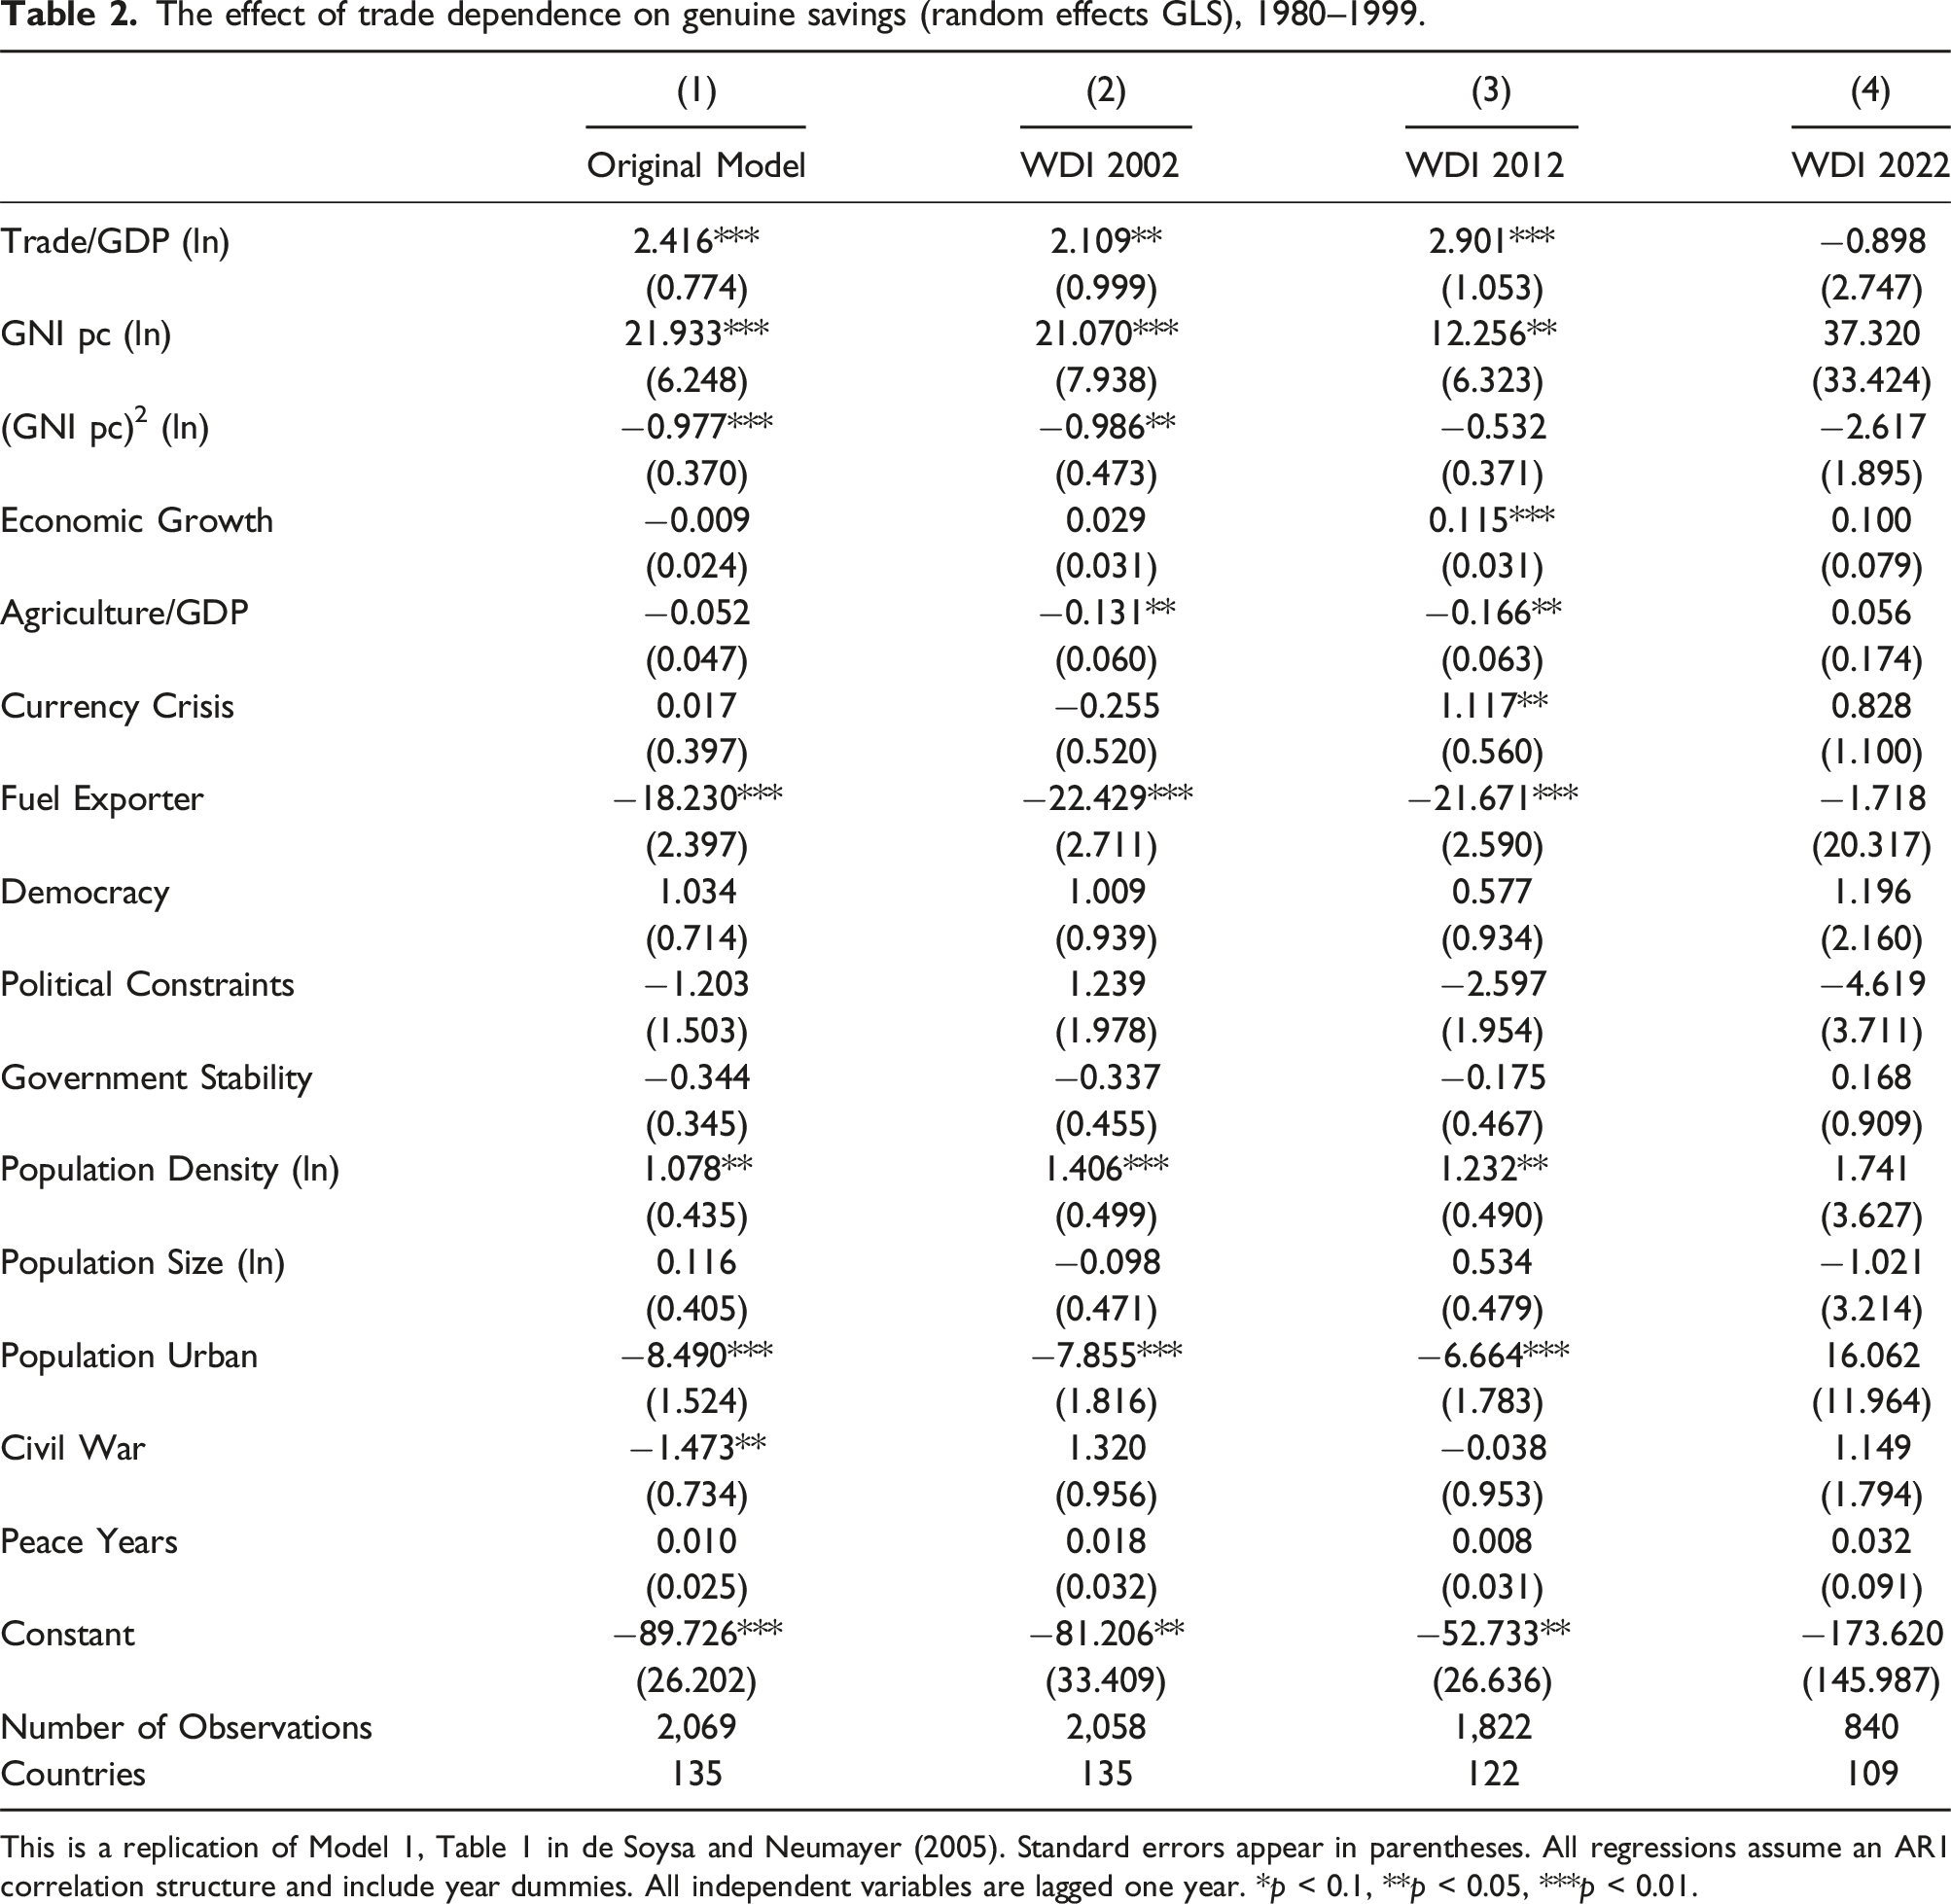
This is a replication of Model 1, Table 1 in de Soysa and Neumayer (2005). Standard errors appear in parentheses. All regressions assume an AR1 correlation structure and include year dummies. All independent variables are lagged one year. *p < 0.1, **p < 0.05, ***p < 0.01.
Models 1 to 3 confirm these expectations and support de Soysa and Neumayer’s finding: countries that trade more tend to have a higher genuine savings rate. The coefficient for Trade/GDP is smallest when using 2002 data and largest when using 2012 data. Since the exact point estimate is not robust to using different vintages, the interpretation of results should focus on the direction and statistical significance of the effects.
The original results are not robust to using 2022 data: in Model 4, the coefficient for Trade/GDP is negative and not statistically significant. This is because PPP indicators were revised after 2014 to adopt newer ICP benchmarks. Consequently, “PPP data are now provided only from 1990, as the longer the time period between the estimate and the benchmark, the greater the risk of inaccuracy” (World Bank, 2023). If the authors used 2022 data, they would not find support for their argument—not because this argument is wrong, but because the sample covered by each vintage affects one’s empirical conclusions. The number of observations shrinks from 2069 in Model 1 to 840 in Model 4. These observations are not evenly lost across all countries, as shows. Recent vintages might be closer to the “truth,” but if “truthful” values are not available for all countries, the sample—and the empirical results—will be biased.
The effect of trade dependence on genuine savings (random effects GLS), including only observations available from all sources, 1980–1999.

This is a replication of Model 1, Table 1 in de Soysa and Neumayer (2005). Standard errors appear in parentheses. All regressions assume an AR1 correlation structure and include year dummies. All independent variables are lagged one year. *p < 0.1, **p < 0.05, ***p < 0.01.
Vreeland (2008)
Many studies only derive their control variables from the WDI, not their main variables. This is still empirically consequential: since different vintages cover different countries and years, vintaged control variables affect the sample size. Moreover, coefficients tend to be biased downward when there are measurement errors on the right-hand side, attenuating the “true” effect that would appear had variables been measured correctly (Hausman, 2001). Researchers might be underestimating the substantive importance of their findings, as the second replication shows.
Using data on 109 dictatorships between 1985 and 1996, Vreeland (2008) finds that multiparty dictatorships are more likely to torture opponents and more likely to enter the United Nations Convention Against Torture (CAT) than one-party or no-party dictatorships. When power is shared, there is more room to disagree with the ruling party. Since at least some dissent is tolerated, defection is more common, as is the punishment of defectors. But interest groups can force the regime to make concessions—and entering the CAT is one concession. The focus on dictatorships is valuable: autocrats overstate their growth rates and do not revise these figures (Martínez, 2022), so there could be fewer discrepancies between WDI releases than in the previous replication.
I replicate the first part of Vreeland’s argument: multiparty dictatorships are more likely to engage in torture. The outcome is a five-point ordinal scale of torture, ranging from one (no allegations of torture) to five (torture is prevalent or widespread), and the estimated model is an ordinal logit. The main explanatory variable, Parties, takes the value of one if more than one party exists legally, and zero otherwise. Four control variables come from the WDI: GDP per capita in 1995 PPP dollars, GDP growth (%), population, and trade (% of GDP). The study also controls for communist regimes and the occurrence of a civil war.
Vreeland uses 2004 WDI data, combined with PWT 6.1. I compare the original data to three WDI releases: 1998 (the earliest release for which all required years are available), 2004 (without PWT additions), and 2018. These vintages report GDP per capita with 1987, 1995, and 2011 as the base year, respectively.
The effect of multiple parties on torture in dictatorships (ordinal logit), 1985–1996.

This is a replication of Model 1, Table 1 in Vreeland (2008). Robust standard errors appear in parentheses. *p < 0.1, **p < 0.05, ***p < 0.01.
Model 4 indicates that the original results are not robust to using 2018 data. The number of observations shrinks from 694 (Model 1) to 403 (Model 4) because the World Bank ceased to provide data before 1990 after revising PPP indicators in 2014. This should not be taken as evidence against the original findings: since the CAT was opened for signature in 1984, the reduced sample drops crucial years and only covers a fraction of the 109 dictatorships included in the original study. Figure 3 reiterates that researchers using different vintages would draw inferences from different samples, as the missing observations are not the same. Even if only the control variables are vintaged, their inclusion might shape our substantive conclusions about the relationship between other unvintaged variables. Available Observations by Country, 1985–1996.
The effect of multiple parties on torture in dictatorships (ordinal logit), including only observations available from all sources, 1985–1996.

This is a replication of Model 1, Table 1 in Vreeland (2008). Robust standard errors appear in parentheses. *p < 0.1, **p < 0.05, ***p < 0.01.
Goldstein et al. (2007)
The final replication looks at variation across different data sources, not just different releases of the same source. According to Rose (2004), formal membership in the General Agreement on Tariffs and Trade (GATT) and the World Trade Organization (WTO) did little to increase trade. However, Goldstein et al. (2007) argue that the GATT/WTO created rights and obligations even for countries that had not attained formal membership, like colonies and newly independent states. Using dyadic data from 1946 to 2004, the authors introduce a measure of participation that goes beyond formal members to include nonmember participants; using this measure, formal members and nonmember participants trade more than nonparticipants.
I do not replicate Goldstein et al.’s main results, but rather a gravity model used to establish Rose’s original finding, without the novel measure of GATT/WTO participation. The outcome is the value of imports (in 1967 USD) from country i to country j. The key explanatory variables indicate the existence of a unilateral or bilateral GATT/WTO membership. Besides the standard gravity variables (the distance between i and j as well as the product of their GDP), the model controls for participation in preferential trade agreements (PTA) or in the Generalized System of Preferences (GSP), currency unions, land area, colonial ties, shared language or border, and whether the two countries are islands or landlocked.
Combining data from multiple sources into one single variable appears to be standard practice to maximize coverage. This study is no different. The main source for Log Product Real GDP (in 1967 USD) is the 2005 WDI, complemented by version 6.1 of the PWT and the 2003 Maddison Project, which report GDP in 2000 USD, 1996 USD, and 1990 international dollars, respectively. It is not clear how these data were rescaled to 1967 USD, as the Maddison Project does not provide nominal GDP data that would enable such calculations. Therefore, I use WDI, PWT, and Maddison data in their raw form, without changing the base year.
The effect of GATT/WTO membership on trade (ordinary least squares), 1946–2004.

This is a replication of Model 1, Table 1 in Goldstein et al. (2007). Robust standard errors, clustered by directed dyad, appear in parentheses. All regressions include year dummies. *p < 0.1, **p < 0.05, ***p < 0.01.
Figure 4 confirms that different sources cover different periods, but this alone cannot explain the discrepancies between results. Table 7 shows that these discrepancies persist when the analysis includes only the 202,819 country-year pairs common to all three sources. This is because measures like real GDP, GDP growth, and trade to GDP rely on nominal GDP information that differs across sources due to currency conversions or PPP adjustments. Compared to the PWT, the WDI consistently overestimates the size of developed economies and underestimates the economy of small nations. Just as researchers using different vintages might draw inferences from different samples, the choice of one source over another can affect researchers’ conclusions. Available Observations by Country, 1946–2004. The effect of GATT/WTO membership on trade, including only observations available from all sources (ordinary least squares), 1946–2004. This is a replication of Model 1, Table 1 in Goldstein et al. (2007). Robust standard errors, clustered by directed dyad, appear in parentheses. All regressions include year dummies. *p < 0.1, **p < 0.05, ***p < 0.01.

Conclusions
Vintaged data are ubiquitous in political science. However, 31.21% of the studies published in International Organization from 2005 to 2020 do not mention their vintage, while 13.87% do not mention their source. Besides sharing their replication code and data, researchers should disclose their sources and vintages, as de Soysa and Neumayer (2005), Vreeland (2008), and Goldstein et al. (2007) do.
Even rigorous findings might disappear if re-estimated using different data. To identify potential sources of imprecision, researchers can consult the WDI’s Data Updates and Errata, which describe “additions, deletions, and changes in codes, descriptions, definitions, sources and topics” (World Bank, 2023). Plotting the distribution of variables can help identify extreme values. A plot of GDP growth over time would reveal that Equatorial Guinea’s economy grew 18.2% in 2000. Using case knowledge, researchers can assess whether this is a “true” outlier—the result of increased oil production—or a product of human error—in which case Equatorial Guinea would appear in the Data Updates and Errata (it does not).
Researchers should strike a balance between maximizing coverage and using the most recent data. Unless working with pre-1950 data, one should favor recent PWT or WDI releases, which are revised more frequently than Maddison data. But there are trade-offs: more recent series might have worse coverage or cover an entirely different sample, as the replication of Vreeland (2008) illustrates. Depending on the sample of interest, older releases are preferable, even if further away from the “truth.”
Finally, researchers should avoid mixing different vintages or sources. If a vintage or source suffers from inherent measurement error, this error must be consistent across all observations. Off-the-shelf datasets are very convenient, but their use does not absolve researchers from thinking about the quality of their data and, ultimately, the robustness of their findings.
Supplemental Material
Supplemental Material - New data, new results? How data sources and vintages affect the replicability of research
Supplemental Material for New data, new results? How data sources and vintages affect the replicability of research by Iasmin Goes in Research & Politics
Footnotes
Acknowledgements
I would like to thank Gabriella Gricius for research assistance and Kerice Doten-Snitker, Matthew Hitt, Daniel Weitzel as well as participants of the 2022 ACUNS-UN Workshop, the 2022 DVPW-ÖGPW-SVPW International Political Economy Conference, and the University of Vienna’s Government Department speaker series for helpful comments. In particular, thanks to Indra de Soysa, Judith Goldstein, Eric Neumayer, Douglas Rivers, Michael Tomz, and James Vreeland for supporting my replication of their work.
Declaration of conflicting interests
The author(s) declared no potential conflicts of interest with respect to the research, authorship, and/or publication of this article.
Funding
The author received no financial support for the research, authorship, and/or publication of this article.
Correction (June 2025):
Supplemental Material
Notes
References
Supplementary Material
Please find the following supplemental material available below.
For Open Access articles published under a Creative Commons License, all supplemental material carries the same license as the article it is associated with.
For non-Open Access articles published, all supplemental material carries a non-exclusive license, and permission requests for re-use of supplemental material or any part of supplemental material shall be sent directly to the copyright owner as specified in the copyright notice associated with the article.