
Abstract
The severe acute respiratory syndrome coronavirus 2 (SARS-CoV-2) is neutral. It does not discriminate: the outbreak affects all countries. Yet, countries with better governance detect and report COVID-19 cases an average of 34 days earlier than countries with low governance scores. They also report a significantly higher number of cases, and more deaths but lower death-per-case ratios. Analyzing the statistical relationship between the good governance indicators devised by the World Bank with data pertaining to COVID-19 (to May 10, 2020), we present some initial yet strong statistical evidence that countries with higher levels of good governance based on the Worldwide Governance Indicators report more (cases, deaths), report earlier, and are more effective at reducing fatalities. These findings remain robust after controlling for population size, population density, old-age population, and the number of tourist arrivals. Countries with better governance are more successful in treating the disease and in reducing its deadliness. Good governance matters.
Insofar as data quality is a function of how well governments work, the available COVID-19 data provide us with a rare opportunity to argue for the case of good governance and institutional quality. While tentative and based on very broad indicators available as of May 10, 2020, we hope this early note on our ongoing analysis may prove very useful in deepening our understanding of the causes and consequences of good governance and pinpointing where to investigate further and more specifically in the future. We contend that the number and timing of reported COVID-19 cases and deaths represents a useful proxy for the level of good governance.
COVID-19 and Good Governance
Why has the coronavirus hit rich countries first? Unless one is willing to speculate that COVID-19 has anarchic tendencies and targets only well-functioning governments, or that COVID-19 attacks only affluent societies in an effort to reduce inequality within and between countries, or that it avoids warmer climates (where, incidentally, tourists from affluent societies enjoy spending their holidays) for reasons yet to be understood, then one should look elsewhere for a more compelling explanation. While we do not offer one here, since it is too early to reach definitive conclusions, our analysis of the co-relation between good governance and coronavirus data is providing a promising starting point. Among several indexes that try to quantify institutional quality and governance, the Worldwide Governance Indicators (WGI) represent the best-known effort to track, measure, and rank broadly the quality of governance across time and countries (Kraay, Zoido-Lobaton, and Kaufmann 1999). We grouped similar countries together into four groups with respect to their most recent WGI scores 1 in Table 1 and then collated and examined the daily COVID-19 data from the European Center for Disease Prevention and Control (ECDC) and other statistical databases for the countries in each group. 2
Overview of Worldwide Governance Indicators and COVID-19 Data to May 10, 2020.
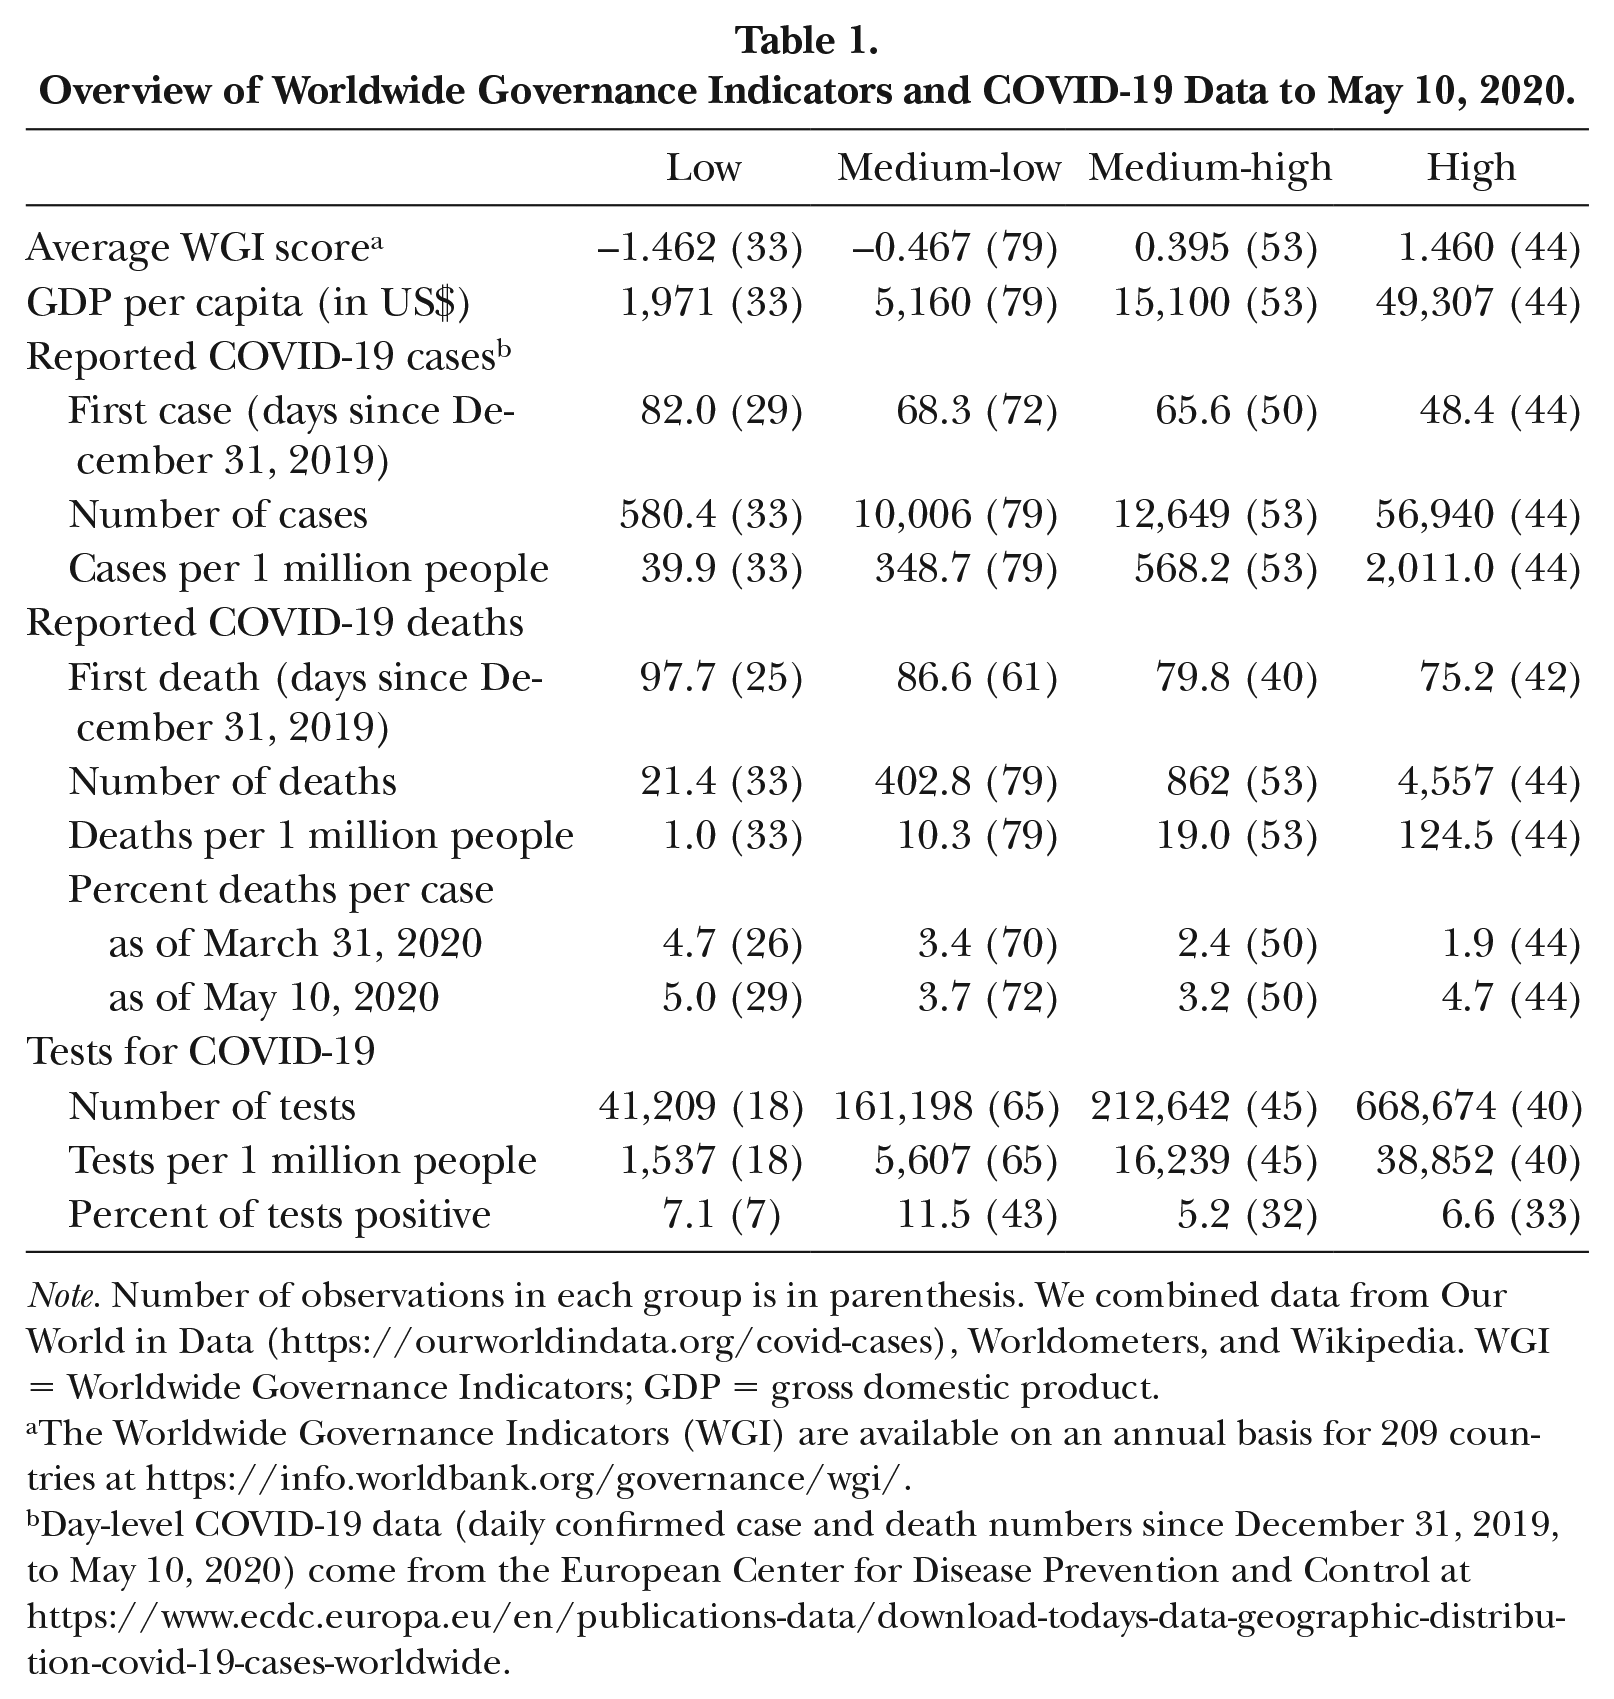
Note. Number of observations in each group is in parenthesis. We combined data from Our World in Data (https://ourworldindata.org/covid-cases), Worldometers, and Wikipedia. WGI = Worldwide Governance Indicators; GDP = gross domestic product.
The Worldwide Governance Indicators (WGI) are available on an annual basis for 209 countries at https://info.worldbank.org/governance/wgi/.
Day-level COVID-19 data (daily confirmed case and death numbers since December 31, 2019, to May 10, 2020) come from the European Center for Disease Prevention and Control at https://www.ecdc.europa.eu/en/publications-data/download-todays-data-geographic-distribution-covid-19-cases-worldwide.
Some striking tendencies emerge from the broad overview we present in Table 1. The countries with better functioning governments, following the WGI scores, reported more COVID-19 cases than countries in which the quality of government is not as good. They also had more cases and deaths per million people. High-WGI countries reported the following:
The first case 33.6 days earlier;
The first death 22.5 days earlier;
Ninety-eight times more cases and 213 times more deaths in total;
Fifty times more cases and 125 times more deaths per million people;
than the low-score countries. They also conducted 16.2 times more tests in total, and 25.3 times more tests per one million people than low-score countries. Countries with higher WGI scores tested earlier for COVID-19, tested more extensively, found and reported more cases, and found more cases per million. The countries that had not confirmed a single case of COVID-19 as of May 10, 2020, were North Korea, Turkmenistan, Lesotho, Solomon Islands, Vanuatu, Samoa and American Samoa, Kiribati, Micronesia, Tonga, Marshall Islands, Palau, Tuvalu, and Nauru. The majority of these countries have low WGI scores.
Interestingly, however, the percentage of deaths-per-case ratio has come closer between the four WGI groups, especially since the beginning of April 2020. The testing data, though incomplete, 3 indicated that the percentage of positive cases out of all the tests performed moved rather closer together across the different groups after March 31, 2020. Hence, given the ratio of positive cases out of the total number of tests, one could easily assume that if low governance countries had performed more tests, they would have reported more cases. The suggestion here is that the ability to detect COVID-19 is a clear function of how well a government works.
The case of North Korea is, in this respect, emblematic. North Korea is located between China and South Korea. As of May 10, 2020, China reported more than 80,000 cases, South Korea recorded more than 10,000, but North Korea reported none. 4 How credible is it that a country located in that area did not have a single case of coronavirus? Or take a less extreme example: Singapore and India reported their first cases within the same week (Singapore on January 24, 2020, and India on January 30). They share a similar distance from Wuhan, China, but Singapore has a population of around 5.6 million people compared to 1.4 billion people in India. As of May 10, 2020, Singapore reported 3,839 cases per million while India tallied just 45.6 cases per million. 5 Likewise, one can look into the data from Africa (especially sub-Saharan Africa), South America, and the Pacific island nations to raise very similar questions and concerns. The fact that in many such jurisdictions little-to-no cases were reported provides little-to-no indication of whether these countries were spared by the pandemic, whether they did not have the means to test for COVID-19, or whether, for whatever reason, they underreported the number of cases.
Tracking the First Case
The first question we address is how fast did countries track the COVID-19 virus? The question is different from analyzing the total number of cases but important for two reasons. First, the countries where COVID-19 was detected at an earlier stage were the first ones to experience the outbreak. Therefore, we can reasonably expect them to have more cases than countries that experienced the outbreak at a later stage. Second, as of May 10, 2020, while we expect the number of cases to continue increasing everywhere, the date in which the first case was reported is going to remain unchanged. Simply put, one set of data is subject to change and the other is not. This allows us to tackle the COVID-19/good governance nexus from two different angles, providing us with a better insight as to whether reporting of when the first case is reported is a function of good governance as compared with how many cases were being recorded.
To develop a proper understanding of the COVID-19/good governance nexus using the first reported date, we need to control for the factors that might be responsible for the spread of the virus around the globe. In this respect, some factors can reasonably be expected to have a more significant impact on the spread of the disease than others. The population density, the size and the age structure of the population, the connectivity of the country to international travels, in addition to the physical distance to Wuhan, China, where the virus was believed to originate, can all affect the spread of the coronavirus. All other things being equal, countries with a larger population will have more cases than countries with a smaller population; in countries with a higher population density, people are more likely to contract the disease than in countries with a sparser population; countries with a larger share of elderly citizens may have more cases because older citizens are known to be in the higher risk category; international travels can be an obvious vector of the disease since travelers can carry the diseases from COVID-19-affected countries to COVID-19-free countries.
In what follows, we use duration models and include the factors noted above as our control variables. Proximity to China was not included in our analysis because it turned out to be inconsequential in the spread of the disease. The epicenters of the virus as of May 10, 2020—where we observe more than 100,000 cases in, for instance, Italy, Spain, France, Germany, the United Kingdom, Turkey, Russia, the United States, Brazil, and Iran—did not share a common pattern in terms of proximity to China.
In our analysis, the survivor function is defined as the probability of zero COVID-19 cases past day t, which is the number of days since December 31, 2019. In this context, the first reported case of COVID-19 is defined as the hazard. Including the countries that have not reported any cases as of May 10, 2020 (14 out of 209), data are right-censored. First, we plot the Kaplan–Meier survivor curves in Figure 1, which are used to estimate survivor probabilities and percentiles. We use the same groups as before (Table 1), but merge the two medium categories together, since they overlap. The left panel of Figure 1 illustrates the variations in the date of the first reported case with respect to WGI scores. We discuss the right panel in Figure 1 shortly, in its relation to our estimation results in Table 2.
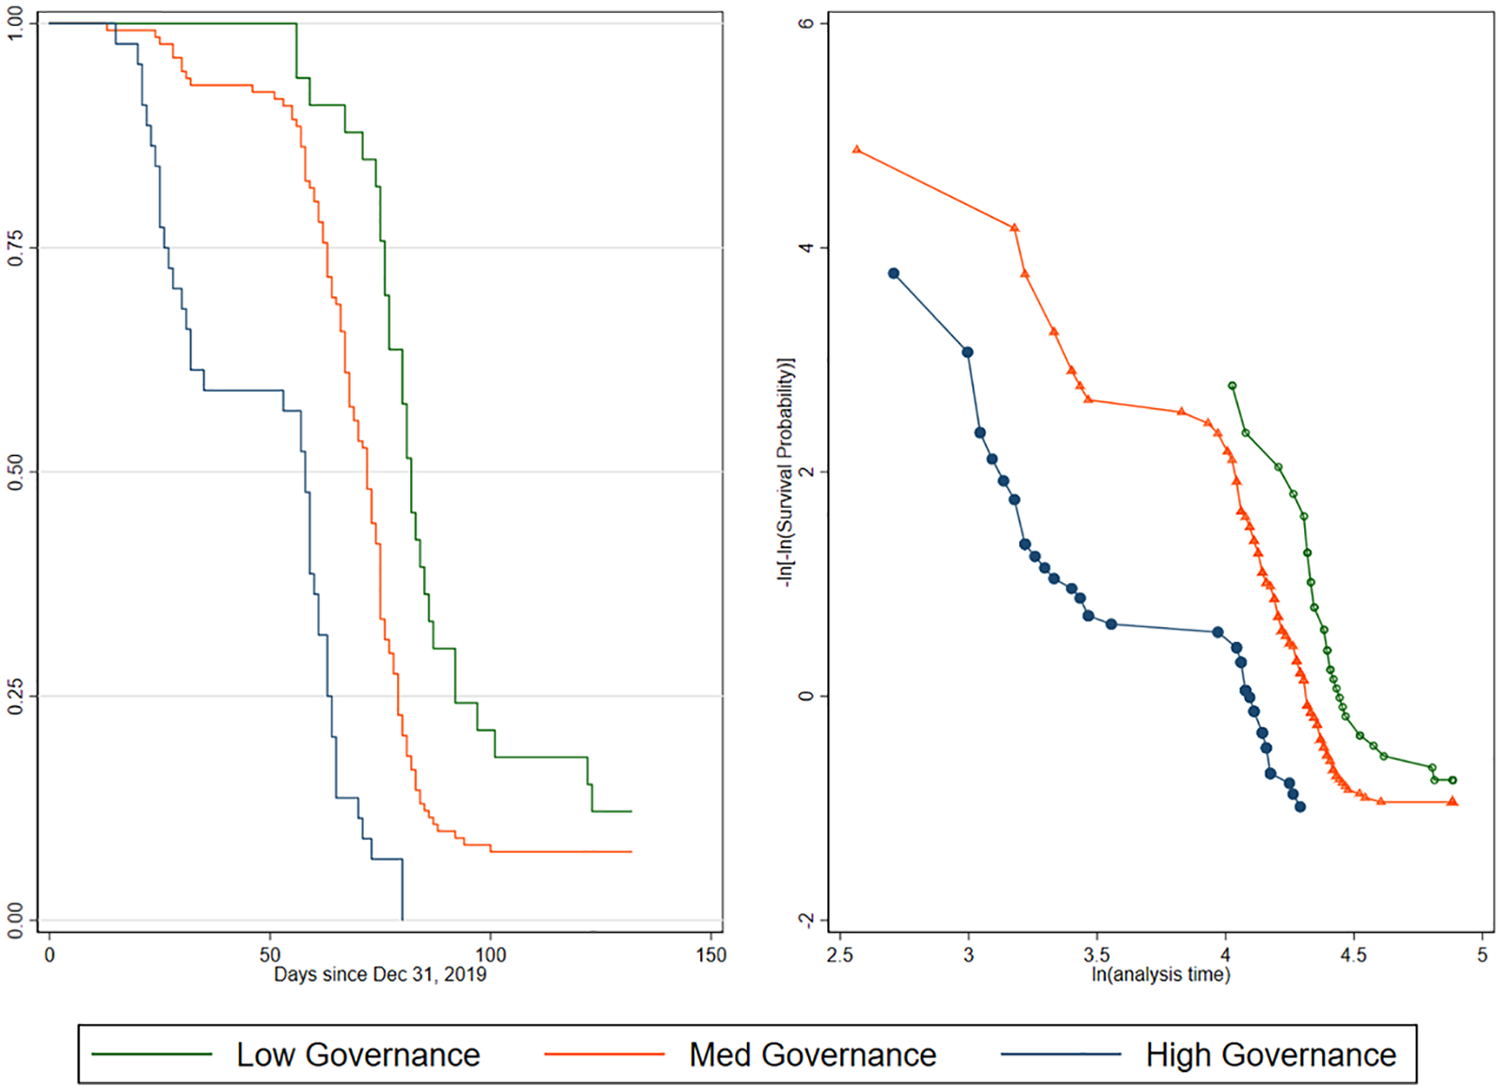
Kaplan–Meier Survival Estimates for the First Reported Case.
Cox Proportional Hazard Estimation for the Day of the First Confirmed COVID-19 Case.
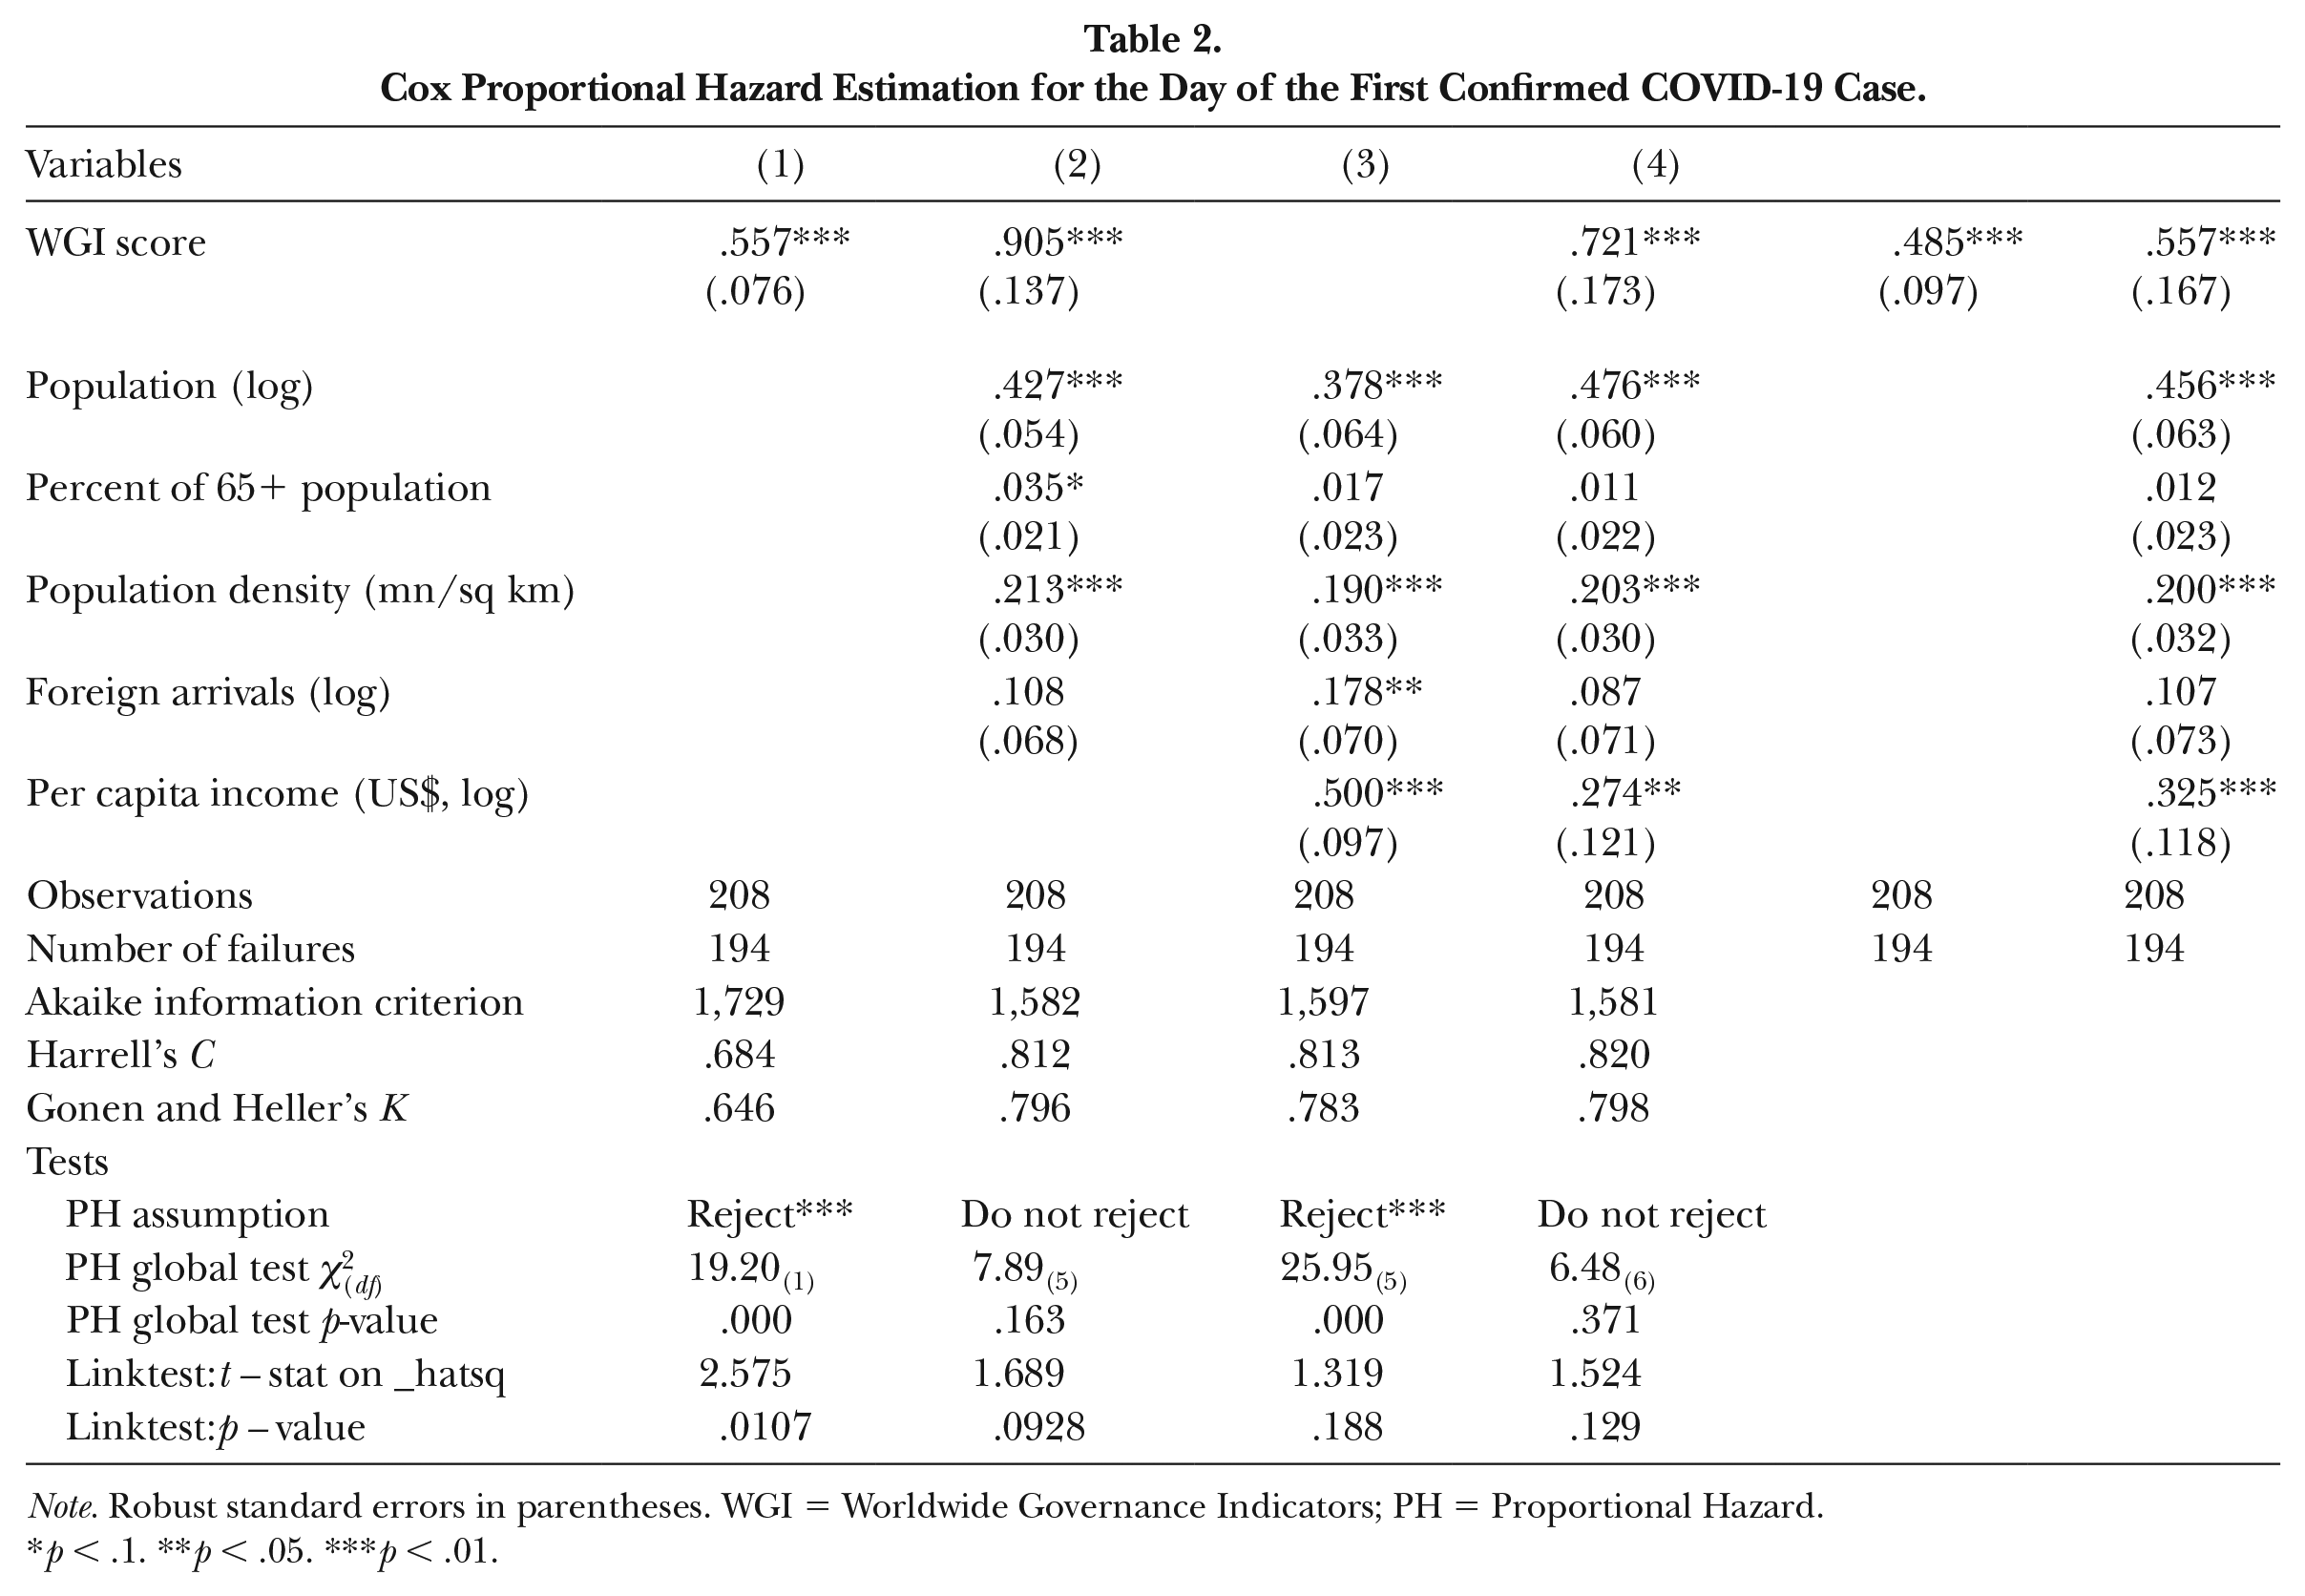
Note. Robust standard errors in parentheses. WGI = Worldwide Governance Indicators; PH = Proportional Hazard.
p < .1. **p < .05. ***p < .01.
The visual inspection of the difference between the three governance groups in the left panel of Figure 1 is compelling. Moreover, we calculate that the 95 percent confidence intervals for the median survival time do not overlap: (31, 61) days for the high governance group, (68, 75) for the medium, and (77, 86) days for the low governance group. Similarly, extended means (Klein and Moeschberger 2010) across governance score groups are 48.4, 76.5, and 95.6 days, respectively.
The Kaplan–Meier curves in the left panel of Figure 1 illustrate the difference across groups of countries based on WGI scores. To include the impact of the other factors we discussed above, we utilize the standard Cox (1972) proportional hazard model:
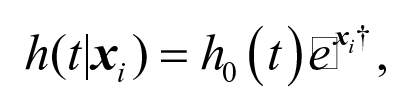
where
After switching the focus of analysis from group of countries to individual countries, we report in Table 2 our estimation results under alternative specifications. In Column 1, we have no control variables. But this specification does not pass the proportional hazard assumption test using Schoenfeld residuals 6 and the specification test using the link test. 7 In Column 2, we control for demographic variables, population size, density of the population, percentage of old age (65+) population, and the number of foreign visitors in 2019. This specification passes both tests of the proportional hazard assumption and model specification. Based on these results, a 1-point increase in the WGI score, which moves a country up to the next category in Table 1, approximately doubles the hazard. Population size and density are also influential factors, but we do not find strong evidence for the percentage of old age population and the number of foreign visitors on the date of the first reported case.
It is well known in the governance literature that WGI scores show a high level of correlation with development indicators (see, for example, Ambraseys and Bilham 2011; Kraay, Zoido-Lobaton, and Kaufmann 1999; Mauro 1995; Rose-Ackerman 2013). This is especially true for low-to-middle income countries. In our data set, we calculate the Pearson coefficient as
Finally, we check the sensitivity of Equation 4 using multiple imputation techniques by incorporating the reported standard errors of the WGI scores. 10 In the last two columns of Table 2, we report multiple imputation results with 1,000 imputations with and without the control variables we discussed above. Specifically, we find that the magnitudes and significance of the coefficients of our explanatory variables remain similar after we include the standard errors in our analysis.
COVID-19 Cases and Deaths
After discussing the factors responsible for the first date on which COVID-19 cases were reported, in this section we switch the focus of our analysis to the number of cases and deaths. This is a more preliminary aspect of our analysis for the basic reason that the number of cases and deaths cover the period up to May 10, 2020, while the COVID-19 pandemic is far from over at the time of writing. More importantly, the data on testing are incomplete and premature, missing the specific characteristics of tests such as sampling method, false positives, and false negatives. We believe it will only be possible to produce a more definitive assessment of the relationship between good governance and the number of cases and deaths after the end of the pandemic.
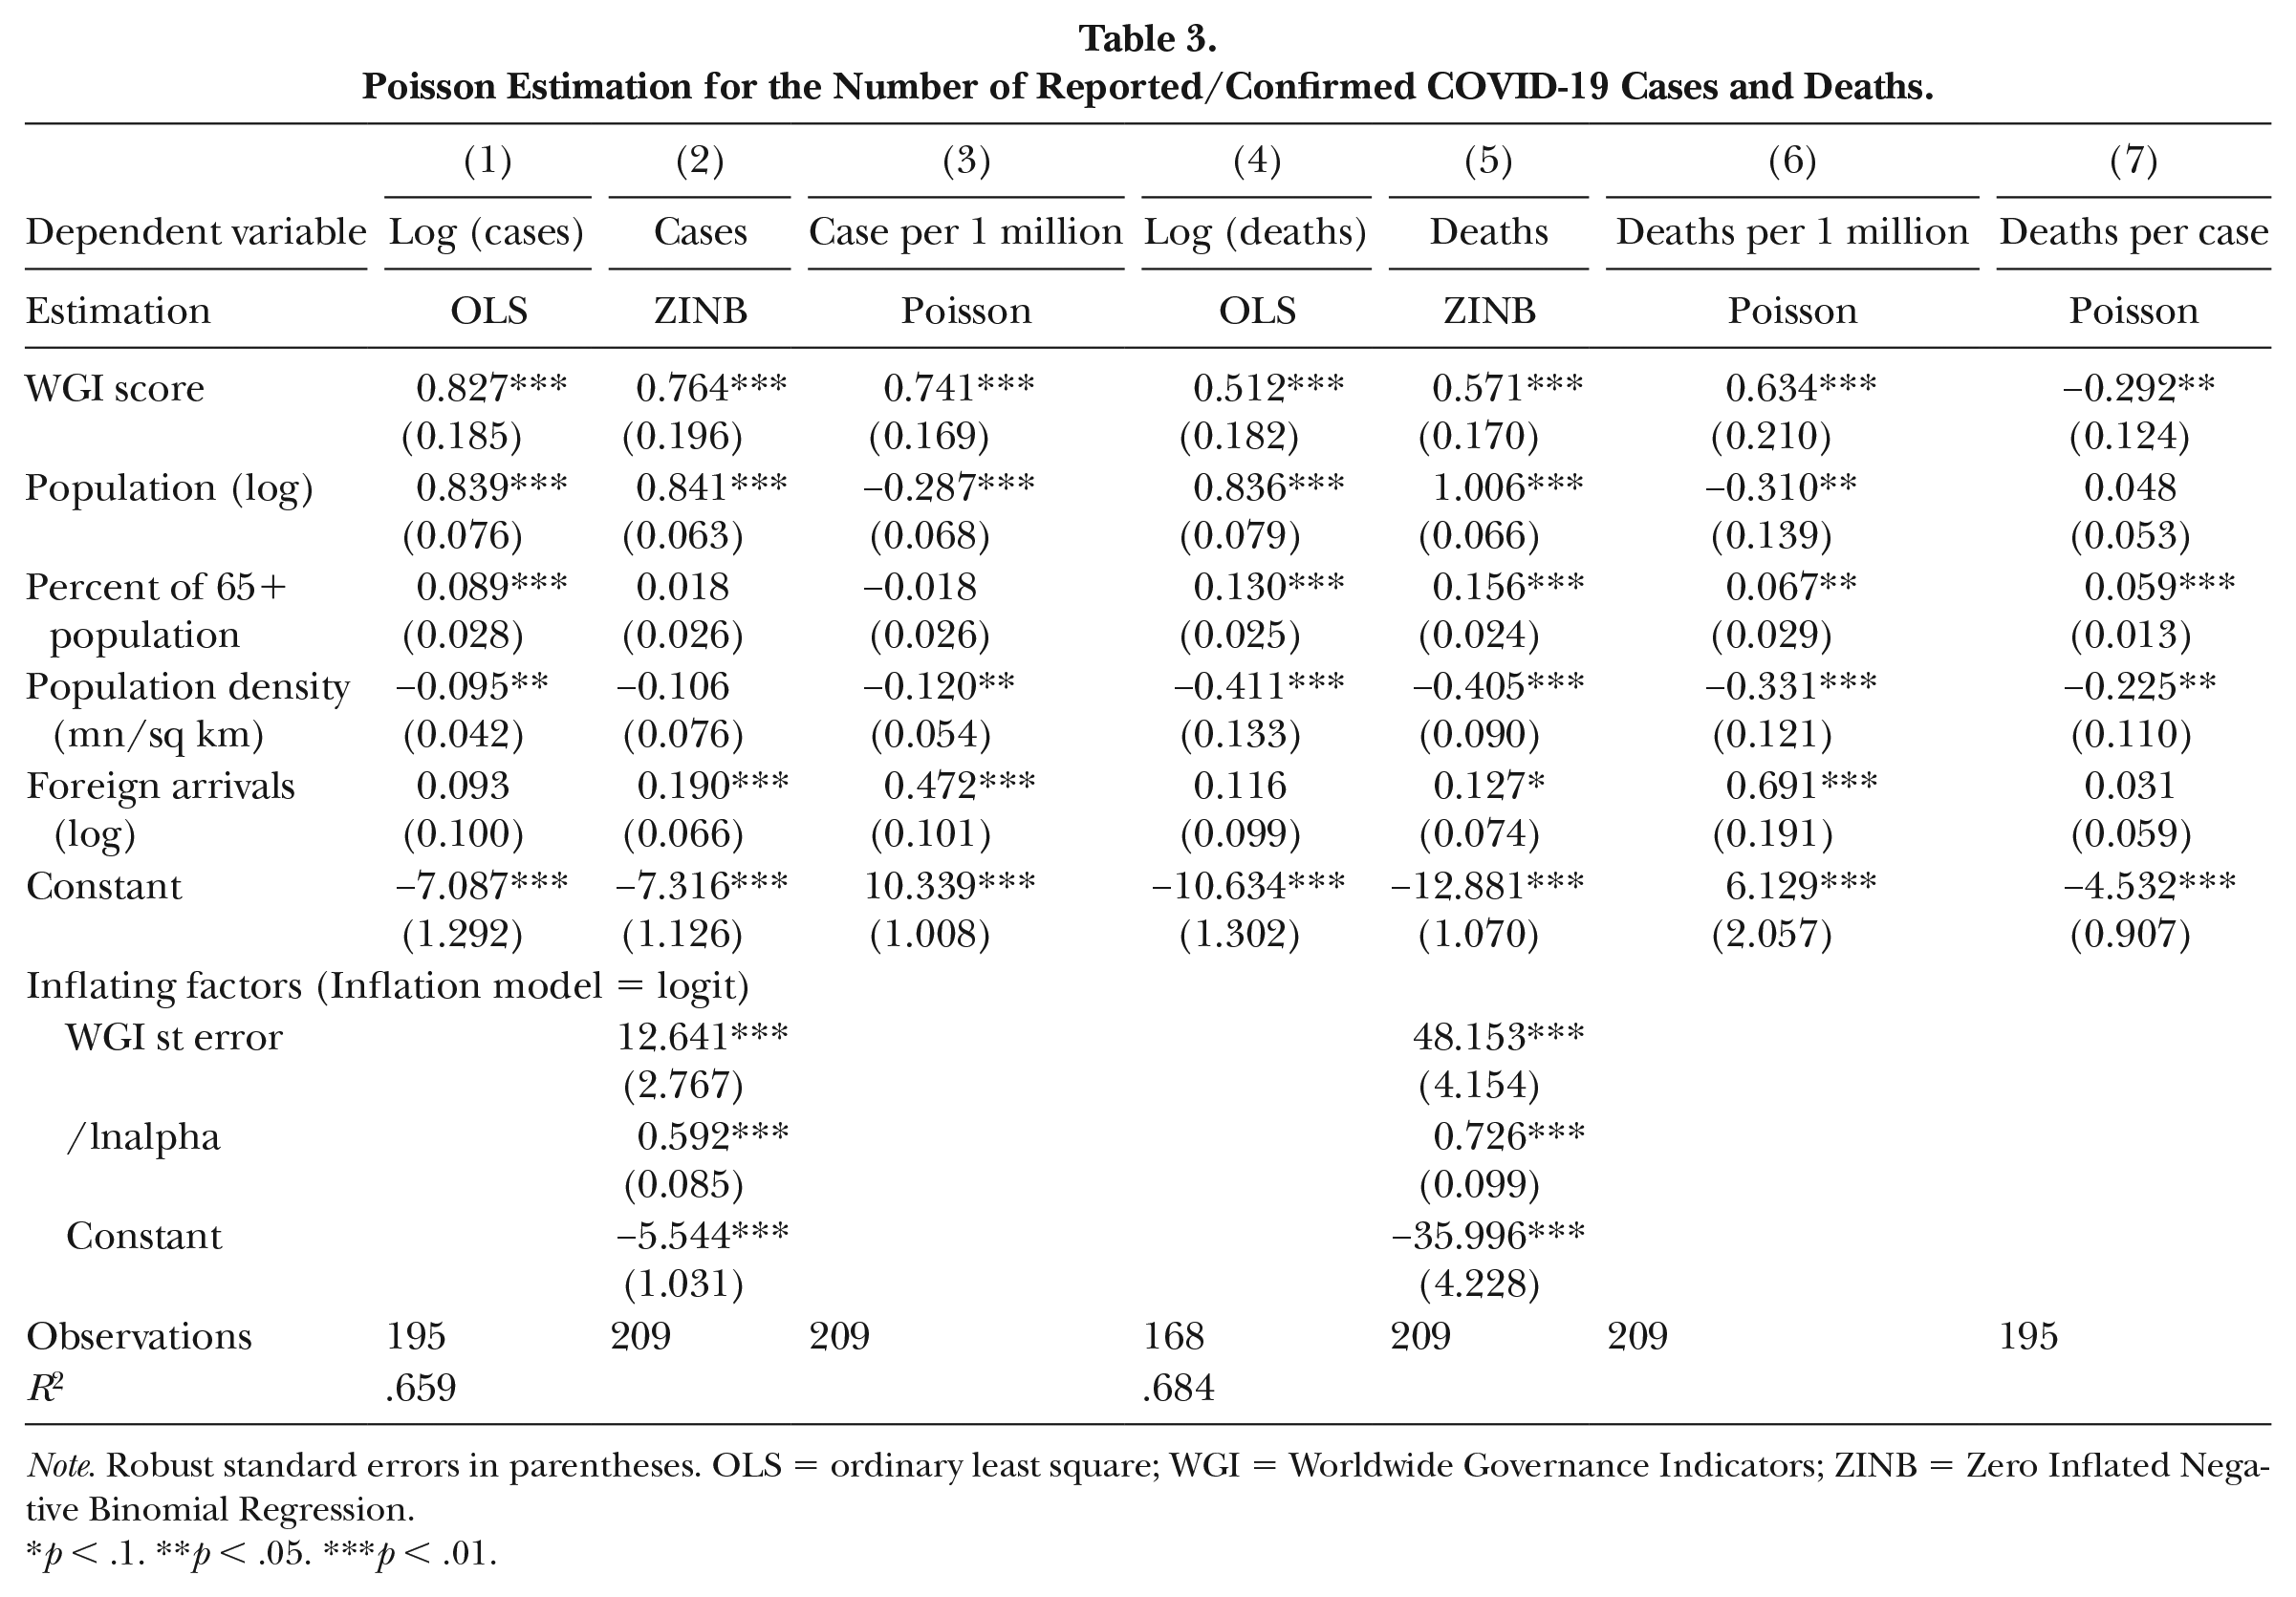
The value of this preliminary analysis is nonetheless far from negligible, for it allows us to make sure that the observations we reported in Table 1 regarding the number of cases and deaths are not accidental. To have a better understanding of the total counts of cases and deaths, we utilize Poisson models, which are more appropriate for count variables. The underlying assumption is that the dependent variable in the model follows a Poisson distribution. It is then possible to use a linear combination of independent variables to explain the variation in the dependent variable. The other reason to use the Poisson model is because of the zero counts, 11 which are excluded in the log-linearized ordinary least square (OLS) estimations. Nonetheless, we report the OLS results in the first column in Table 3 as a benchmark, which are known to be biased estimates (Silva and Tenreyro 2006).
Poisson Estimation for the Number of Reported/Confirmed COVID-19 Cases and Deaths.
Note. Robust standard errors in parentheses. OLS = ordinary least square; WGI = Worldwide Governance Indicators; ZINB = Zero Inflated Negative Binomial Regression.
p < .1. **p < .05. ***p < .01.
Noting that both the numbers of cases and deaths have an excess of zero counts, the second column reports estimation results from zero-inflated negative binomial regression models for the number of cases and deaths. We also use the ratio of cases per one million as the dependent variable and report the results in Column 3 of Table 3. In both cases, the magnitude and the significance of the WGI coefficient are virtually identical.
In Columns 4 to 6 of Table 3, we repeat the estimation procedure using the number of deaths, both in total and as a ratio per one million. In Column 7, we utilize the Poisson model with the ratio of deaths per case as the dependent variable. In all specifications from column (2) to (6) we find that WGI scores are strong, positive, and significant determinants of COVID-19 cases and deaths, however measured. 12 At the same time, WGI scores have a strong and negative impact on the deaths-per-cases ratio in Column 7.
For the total number of cases, population size and foreign arrivals both contribute significantly to the spread of the virus. Standard error of WGI scores inflate the number of zeros. For the number of cases per one million, both population density and population size reduce the spread while foreign arrivals contribute significantly. In all cases, the WGI score increases the number of confirmed cases, a clear indication that cases are severely underreported in low-WGI countries.
The number of deaths also show a strong positive correlation with the WGI scores. In addition to population size and density, the share of old age population becomes a critical determinant in explaining the total number of deaths. Population density reduces the number of deaths, but foreign arrivals increases the number of deaths, both in total and as a ratio of population. However, WGI scores reduce the case fatality rate, possibly thanks to better health care provision in high-WGI countries. Old age population seems to be the most important contributor to the death-per-case ratio.
Concluding Remarks
We hope this early note on our ongoing analysis may prove useful in deepening our understanding of the causes and consequences of good governance and in pinpointing where to investigate further in the immediate future—concerning both quality of governance and interpreting COVID-19 data cross-nationally. The analysis presented here provides empirical evidence that bolsters the oft-repeated claim that good governance matters. It also raises important questions regarding the reliability, comparability, and usefulness of COVID-19 data across levels of governance. Hence, further research is much needed to illuminate how underreporting in low-income countries shapes (and will shape) public policy on health. All in all, countries with better governance report more cases because they perform more tests—which, in itself, is a good indicator of good governance—and because they are more transparent about what they find. Countries with low governance scores report fewer-to-no cases, either because they do not test their citizens or because they do not report the results of such tests.
Good governance matters in a second, and possibly more important, respect because countries with better governance are more successful in treating the disease and in reducing its deadliness. These findings hold true after controlling for the other important factors such as size, density, and age structure of the population, and the number of tourist arrivals, which are generally accepted to be the main drivers of the pandemic.
Our findings in this note are consistent with a large body of literature that supports the view that good governance and development go hand-in-hand (cf. Ambraseys and Bilham 2011; Kraay, Zoido-Lobaton, and Kaufmann 1999; Mauro 1995; Rose-Ackerman 2013). This co-relation could be due to the fact that good governance is a prerequisite for sustained economic growth and development, to the fact that only affluent countries can afford to have well-functioning governments, or to the fact that good governance and socio-economic development are a function of some other condition. Furthermore, they could also be cause and consequence of one another—which is definitely an area that entreats further important statistical research.
WGI scores as measurements of government effectiveness are, however, not perfect. Facing increasing scrutiny and criticism—due to the problems of aggregation and cross-validation (Knack 2006), the lack of transparency in how they are constructed, to hidden biases, and for their practical uselessness (Oman and Arndt 2010), and to the lack of “construct validity” (Thomas 2009) and other measurement errors (Ko and Samajdar 2010)—the developers of WGI have responded and revised their methodologies (Kaufmann, Kraay, and Mastruzzi 2007).
Finally, the fact that poor countries produce poor data and, worse, corrupt countries generate corrupt data (Jerven 2013), poses more problems for the WGI in large N analyses. The data quality is not homogeneous across countries. Rather, it is a function of, and subordinately a proxy for, quality of government. The findings we present here support this criticism. If the COVID-19 data are strongly associated with governance scores and if the data about the number of COVID-19 cases are not perfectly accurate, precise, and reliable, especially in countries with low governance scores, then one has to wonder about the precision with which the level of good governance is estimated in such jurisdictions. Simul stabunt, simul cadent.
Footnotes
Appendix
1
The Worldwide Governance Indicators (WGI) are available on an annual basis for 209 countries at ![]() . The WGI scores range from −2.5 to +2.5. We created four categories based on how countries fare in terms of government effectiveness: low governance countries are those with score below −1, countries with high governance have a score higher than 1, while countries with a score between −1 and 0 were categorized as having medium-low governance and those with a score between 0 and +1 were categorized as having medium-high governance. On a technical note, we checked the sensitivity of our results with respect to the selection of cutoff points for categories using the reported standard errors of WGIs.
. The WGI scores range from −2.5 to +2.5. We created four categories based on how countries fare in terms of government effectiveness: low governance countries are those with score below −1, countries with high governance have a score higher than 1, while countries with a score between −1 and 0 were categorized as having medium-low governance and those with a score between 0 and +1 were categorized as having medium-high governance. On a technical note, we checked the sensitivity of our results with respect to the selection of cutoff points for categories using the reported standard errors of WGIs.
3
The data on tests from various sources (Wikipedia and Worldometers) for 166 countries had no common standard of reporting as of May 10, 2020.
4
5
See the WHO Dashboard mentioned above in footnote 4.
6
The violation of the proportional hazard assumption means that the hazard ratio is not constant over time and, therefore, an alternative model needs to be specified. Visually, when the proportional hazard assumption holds, the plotted lines are reasonably parallel.
7
When the specification fails the link test, what is known as the link error, the dependent variable does not properly relate to the covariates and needs to be transformed.
9
Visual scatter plots for each covariate are in Figure A2 in the ![]() .
.
11
There are two main reasons for zero counts: (1) the countries may actually have zero cases or deaths or (2) they may fail to track and announce actual cases or deaths.
12
See also the visual scatter plots in Figure A3 in the ![]() .
.