
Abstract
The quality of online survey data is sometimes seen as inferior compared to probabilistic face-to-face surveys. Extending existing research beyond the commonly studied cases, we analyse six European countries, comparing data from a representative online survey fielded for the 2019 EP elections to the European Social Survey 9 and EB 91.5. We assess the effects of survey mode in terms of representativeness compared to validated benchmarks, as well as with inferences about party identification and vote choice. While we do find some differences in the marginal distributions compared to sociodemographic and electoral benchmarks, the inferential models when using online survey data as compared to face-to-face surveys are not substantially different.
Background
Decreasing response rates and high costs of face-to-face and telephone interviews have strengthened public opinion scholars’ reliance on nonprobability online surveys over the last years (Callegaro et al., 2014). This research note aims to contribute to the growing evidence about sampling methodology by analysing the effects of survey mode on representativeness compared to population benchmarks as well as inferences about party identification and voting behaviour in six European countries. We use data from a representative online survey fielded in the context of the European Parliament elections of Spring 2019 in Belgium, Germany, Greece, Ireland, Portugal and Spain, and compare it to the most established face-to-face surveys that were fielded at the same time: the European Social Survey 9 (ESS) and the Eurobarometer 91.5 (EB).
Following work from Dassonneville et al. (2020), we compare online survey data that we collected within the ERC MAPLE project 4 to the ‘gold standard’ – face-to-face probability surveys. Obviously, a large number of studies offer systematic comparisons of probability and non-probability samples in the field of electoral research (Ansolabehere and Schaffner, 2014; Breton et al., 2017; Sanders et al., 2007). But the use of online nonprobability samples for the study of electoral behaviour in European Parliament elections has not been investigated before. Turnout in EP elections is substantially lower than in national elections, voters tend to decide later, and often to use those low-stake ‘second order elections’ to punish governments and reward smaller and more radical parties (Schmitt et al., 2020). Hence, electoral behaviour in EP elections is more volatile, making appropriate predictions of vote choice with survey samples harder than in national elections (Giuliani, 2019), making European elections an interesting case to test the validity of online non-probability samples.
We are also able to add countries that are rarely studied in this context (Greece, Ireland, Portugal and Spain) and contrast them to Belgium and Germany, which are more commonly studied (Bytzek and Bieber, 2016; Dassonneville et al., 2020). This is not just a geographical extension of previous work but also improves our knowledge on online survey use in countries with lower average levels of education (Greece, Spain and Portugal) 1 than the usual cases in North-Western Europe and North America. As online samples have been shown to systematically over-represent younger and more educated citizens (Simmons and Bobo, 2015), countries with relatively low levels of educational attainment are a bigger challenge.
Our two-wave online survey was fielded before and after the EP elections with 1000 respondents per country and aims to be representative in terms of gender (2 categories), age (3 categories) and education (3 categories). The fieldwork in six countries was executed by Qualtrics, a survey company that recruits its participants from their own market research panels. 2 As a comparison, we chose the European Social Survey (ESS) Round 9 from 2018/19, because it is considered as the highest quality survey in Europe, as well as the Eurobarometer (EB) 91.5, because it was fielded in exactly the same time period as the second wave of our survey (June–July 2019) and includes the EP elections vote recall, which allows us to compare survey results to verified election results. The EB 91.5 also covers Greece, which the ESS does not. Table A1 in the online appendix shows more information on the three survey samples.
Our analysis consists of two parts: In the first section, we compare the raw unweighted survey data to validated population benchmarks. In the second section, we use the different surveys to make a range of simple statistical inferences, explaining party identification, turnout and vote choice, this time using weighted data.
Validated benchmarks: How representative is online survey data?
We first evaluate the representativeness of the online survey data in comparison with the two face-to-face surveys concerning validated sociodemographic benchmarks in the target population (voting age population in the six countries). For a limited number of relevant sociodemographic variables – gender, age and education levels – survey samples can be compared to the official data on population parameters, obtained from the Census 2011. Even though under- or over-representation of certain groups in survey samples can be corrected by using weights, it is still important to approximate the population characteristics as close as possible in the raw data, as large weights can distort the results (Dassonneville et al., 2020). Figure 1 shows the differences between sample means and sociodemographic benchmarks for all three surveys, the ESS9, the EB 91.5 and the online survey, with 95% confidence intervals. Sociodemographic benchmarks. Notes: % of difference between sample means and population benchmarks (voting age population), with 95% confidence intervals. Benchmarks (Census, 2011) are set to 0, positive differences mean oversampling, negative differences mean undersampling. Estimates are based on raw (unweighted) data. Tables to the figures are in the online appendix (Table A2).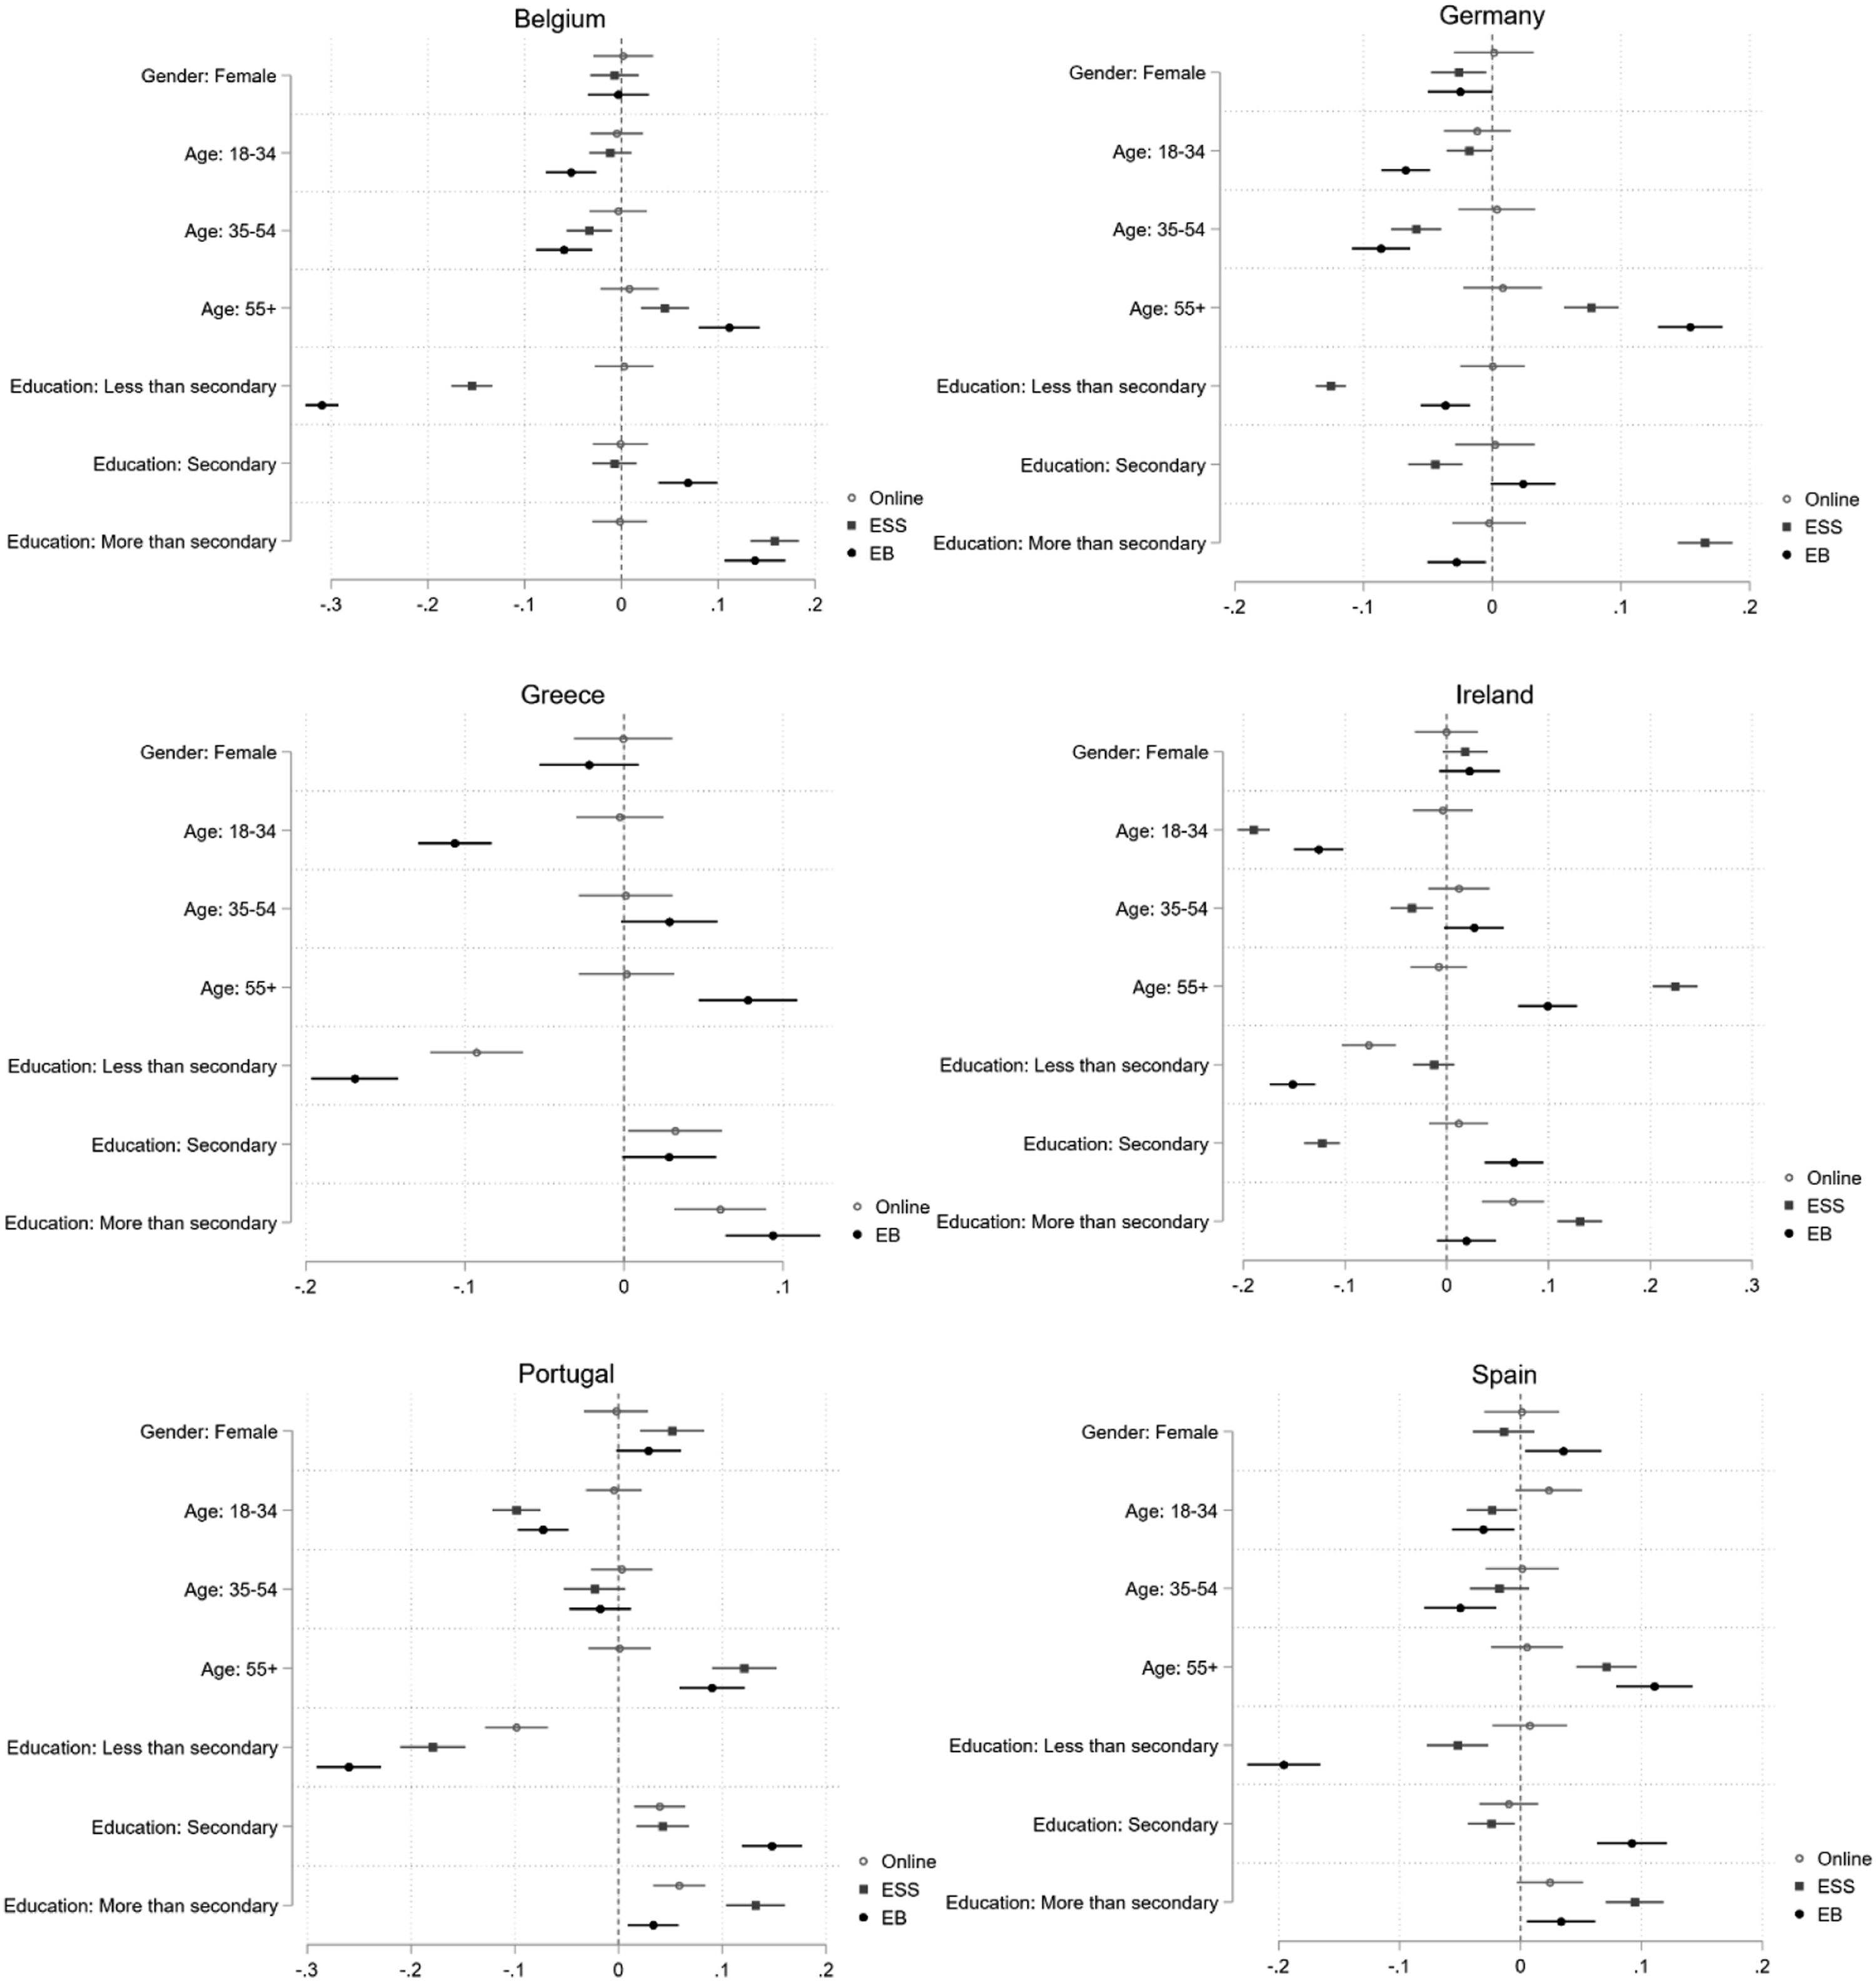
Overall, we see that the online survey data are not less representative than the face-to-face surveys: in all six countries the online sample is closer to the benchmarks for gender, age and education than the ESS and especially the EB. While the online survey data slightly misses the benchmarks for education in Portugal, Ireland and Greece, the two face-to-face surveys are even less representative. The ESS and the EB have similar problems to the online survey, by oversampling high education and undersampling low education. They also tend to oversample old and undersample young people, a problem the online survey data does not have.
The next validated benchmark we use is to verify survey representativeness the elections results from the European Parliament elections of May 2019. As the EB91.5 is a post-electoral survey, while the ESS9 is not, this analysis only compares the EB to the online survey. Election results are expected to show larger differences in their marginal distributions, given that survey answers indicating vote choice are more likely to be insincere or wrong than sociodemographic criteria. We use two indicators of electoral behaviour – turnout and vote choice for all major parties. Figure 2 shows the differences between reported vote choice and official election results, with 95% confidence intervals. Election results. Notes: % of difference between reported vote choice and official election results, with 95% confidence intervals. Benchmarks (EP elections 2019, source: https://www.europarl.europa.eu/election-results-2019) are set to 0, positive differences mean overestimations, negative differences mean underestimations. Estimates are based on raw (unweighted) data. Tables to the figures are in the online appendix (Table A3).
We observe that survey estimates of election results are indeed more biased than population benchmarks. Both surveys – the EB 91.5 and the online survey – differ from the official results in all six countries, sometimes substantially, for example, in over-estimating turnout. In Greece, Portugal and Spain, the online survey shows higher differences from the benchmarks than the EB does. This implies that either the EB sampling is more representative when it comes to voting behaviour (if not for population benchmarks), or that respondents replied more truthfully in a face-to-face survey.
Comparing inferences: How reliable are analyses based on online survey data?
Another crucial difference between the survey samples is that participation in non-probability-based survey is, by definition, non-random. For example, non-probability survey opt-in sampling has been found to attract citizens with higher political interest (Schoen and Faas, 2005; Simmons and Bobo, 2015). Hence, representativeness apart, the most important issue especially in electoral research is causal inferences: if we use online non-probability samples in our analyses, do we come to the same conclusion than if we were to use probability samples? Or do systematic biases in key variables, observed or unobserved, lead to divergent results and conclusions?
To test this, we make a range of simple bivariate regressions, predicting party identification (using the ESS9) as well as turnout and vote choice (using the EB 91.5). Given that the ESS9 does not contain vote choice for the EP elections, while the EB 91.5 does not have data on party identification, we make these analyses separate, comparing each face-to-face survey to the online survey. We use all the predictors that were comparable across the three surveys, which are gender, age, education, left-right placement and evaluations of the economy 3 , recoded to a 0–1 scale. For summary statistics of all variables, see Table A4 in the online appendix. For each substantive predictor (sociodemographics and political attitudes), we add an interaction term with a dummy identifying the online survey, to see if the non-probability sample would lead to systematically different results.
Explaining party identification (comparison with the ESS9).

Notes: Estimates of and logistic regression analyses. All variables are recoded to a 0 to 1 scale. Party identification is coded as 1 if respondents identify with the party in question, and 0 if they identify with any other party. In countries where there is more than one party in the government, identification with the government parties is tested separately. Only parties with more than 50 cases in each survey are included. The data are weighted with socio-demographic weights. Significance levels: * p < 0.05, ** p < 0.01, *** p < 0.001. Interaction coefficients in bold are still significant after applying a Bonferroni correction for multiple testing. Data sources: ESS 9, MAPLE online survey w2.
Explaining voting behaviour (comparison with the EB 91.5).

Notes: Estimates of logistic regression analyses. All variables are recoded to a 0 to 1 scale. Vote recall is coded as 1 if respondents voted for the party in question, and 0 if they voted for any other party, or voted blank. Only parties with more than 50 cases in each survey are included. The data are weighted with socio-demographic weights. Significance levels: * p < 0.05, ** p < 0.01, *** p < 0.001. Interaction coefficients in bold are still significant after applying a Bonferroni correction for multiple testing. Data sources: Eurobarometer 91.5, MAPLE online survey w2.
Conclusions
Comparing a non-probability online sample to two of the most used probability-based European electoral and attitudinal surveys, ESS and EB, we can confirm that overall, representative online surveys are reliable. While our online survey data showed slightly less representativeness compared to the EP 2019 election results than the EB 91.5, its representativeness in terms of population benchmarks is generally better than both the EB 91.5 and the ESS 9. Most importantly, when predicting party identification, turnout, and vote recall, we found that scholars would almost always come to the same conclusions no matter if they were using online or face-to-face survey data. While we only have a limited selection of items that were suitable as predictors for all three surveys, the consistency of these results shows that even if marginal distributions of variables might differ across survey types, the inferences that we draw when comparing the relationships among key behavioural and attitudinal variables are not systematically biased. Hence, inferential models, the most common application of electoral and attitudinal surveys, are not less accurate when based on non-probability online survey data than when based on probability sampling.
Our findings are in line with previous research from the UK (Sanders et al., 2007), the US (Ansolabehere and Schaffner, 2014), Canada (Breton et al., 2017), Germany (Bytzek and Bieber, 2016; Schoen and Faas, 2005) and Belgium (Dassonneville et al., 2020). By extending the scope to countries that have not been previously studied and by testing for the first time the effects of survey more in European instead of national elections, we could confirm that representative online surveys can be viable alternatives to face-to-face surveys in comparative European electoral research.
Supplemental Material
Supplemental Material - Assessing survey mode effects in the 2019 EP elections: A comparison of online and face-to-face-survey data from six European countries
Supplemental Material for Assessing survey mode effects in the 2019 EP elections: A comparison of online and face-to-face-survey data from six European countries by Lea Heyne in Research & Politics.
Footnotes
Declaration of conflicting interests
The author(s) declared no potential conflicts of interest with respect to the research, authorship, and/or publication of this article.
Funding
The author(s) disclosed receipt of the following financial support for the research, authorship, and/or publication of this article: This work was supported by the Fundação para a Ciência e a Tecnologia (EXPL/CPO-CPO/0506/2021) as well as the H2020 European Research Council (ERC-Consolidator Grant, 682125).
Supplemental Material
Supplemental material for this article is available online.
Notes
References
Supplementary Material
Please find the following supplemental material available below.
For Open Access articles published under a Creative Commons License, all supplemental material carries the same license as the article it is associated with.
For non-Open Access articles published, all supplemental material carries a non-exclusive license, and permission requests for re-use of supplemental material or any part of supplemental material shall be sent directly to the copyright owner as specified in the copyright notice associated with the article.