
Abstract
Do individuals reveal their true preferences when asked for their support for an ongoing war? This research note presents the results of a list experiment implemented in the midst of the Russian invasion of Ukraine. Our experiment allows us to estimate the extent of preference falsification with regard to support for the war by comparing the experimental results with a direct question. Our data comes from an online sample of 3000 Russians. Results show high levels of support for the war and significant levels of preference falsification: when asked directly, 71% of respondents support the war, while this share drops to 61% when using the list experiment. Preference falsification is particularly pronounced among individuals using TV as a main source of news. Our results imply that war leaders can pursue peace without fearing a large popular backlash, but also show that high levels of support for war can be sustained even once the brutality of the war has become clear.
Despite the brutality that war produces, measured popular support for wars and war leaders often remains surprisingly high. This could be observed in the war in Syria (Corstange, 2019), and also applies to Russia’s war against Ukraine, where opinion polls have recorded support levels of more than 80% (Levada 2022). Do such high levels of support reflect genuine opinions, or are those responding masking their true sentiments? Theory tells us that the latter is likely the case. Wars often go along with heightened levels of suppression of political opponents (Enterline and Gleditsch 2000). Speaking out, therefore, can be dangerous. The war in Ukraine is no exception. Eight days into the war, the Russian government made it illegal to call the war as such (Troianovski 2022). What is more, scholars have noted a general unwillingness to state opinions that go against the perceived majority opinion. Instead of being part of a dissenting minority, people often prefer to falsify their publicly stated preferences to be in line with what they believe the majority thinks (Kuran 1995). We can expect such preference falsification to be particularly common during war when leaders dominate the information environment. Despite this clear theoretical prediction that preference falsification should be rampant, actually showing that this mechanism is at work is difficult. After all, people are unlikely to admit openly that they are hiding their true preferences if they are hesitant to reveal these preferences in the first place.
We here present the results of a list experiment that allows us to estimate the extent of preference falsification during war. Our experiment was implemented in April 2022, in the midst of the full-scale Russian invasion of Ukraine, among a sample of 3000 Russian online workers. We measure preference falsification by comparing the results from the experiment with a direct question. In the list experiment, respondents in the treatment condition were asked whether they personally supported none, one, two, three, or four of the following things (shown in a random order): (1) monetary monthly transfers for poor Russian families; (2) legalisation of same-sex marriage in Russia; (3) state measures to prevent abortion; and (4) the actions of the Russian armed forces in Ukraine.
Respondents were explicitly asked to only indicate how many of the items they supported, not which one(s). This allowed them to voice their opposition to the war without having to fear detection. The true level of support is derived by comparing the average number of items supported by this treatment group to the number supported by a control group. This control group received a three-item list in which the fourth item (support for the invasion) was left out (see Figure 1). Who was shown the three-item list, and who was shown the four-item list was determined randomly.
2
The difference in the average number of items supported, therefore, provides an estimate of the genuine level of support for the war.
3
In formulating the item probing for support of the war (‘support for military actions’), we adopted a question used by the Levada Center, a reputable Russian opinion survey company that has maintained a degree of independence even during the war. The question avoids calling the war as such (which was made illegal in Russia, see above) but also bypasses the official wording ‘special military operation’, which might suggest closeness to the state (Levada Center, personal communication). Screenshots of the list experiment in treatment (left) and control condition (right). Note: Respondents were either shown the question on the left (with the ‘Actions of the Russian armed forces in Ukraine’ option included) or the question on the right. Original in Russian language (see the Appendix for the original and translated questionnaires).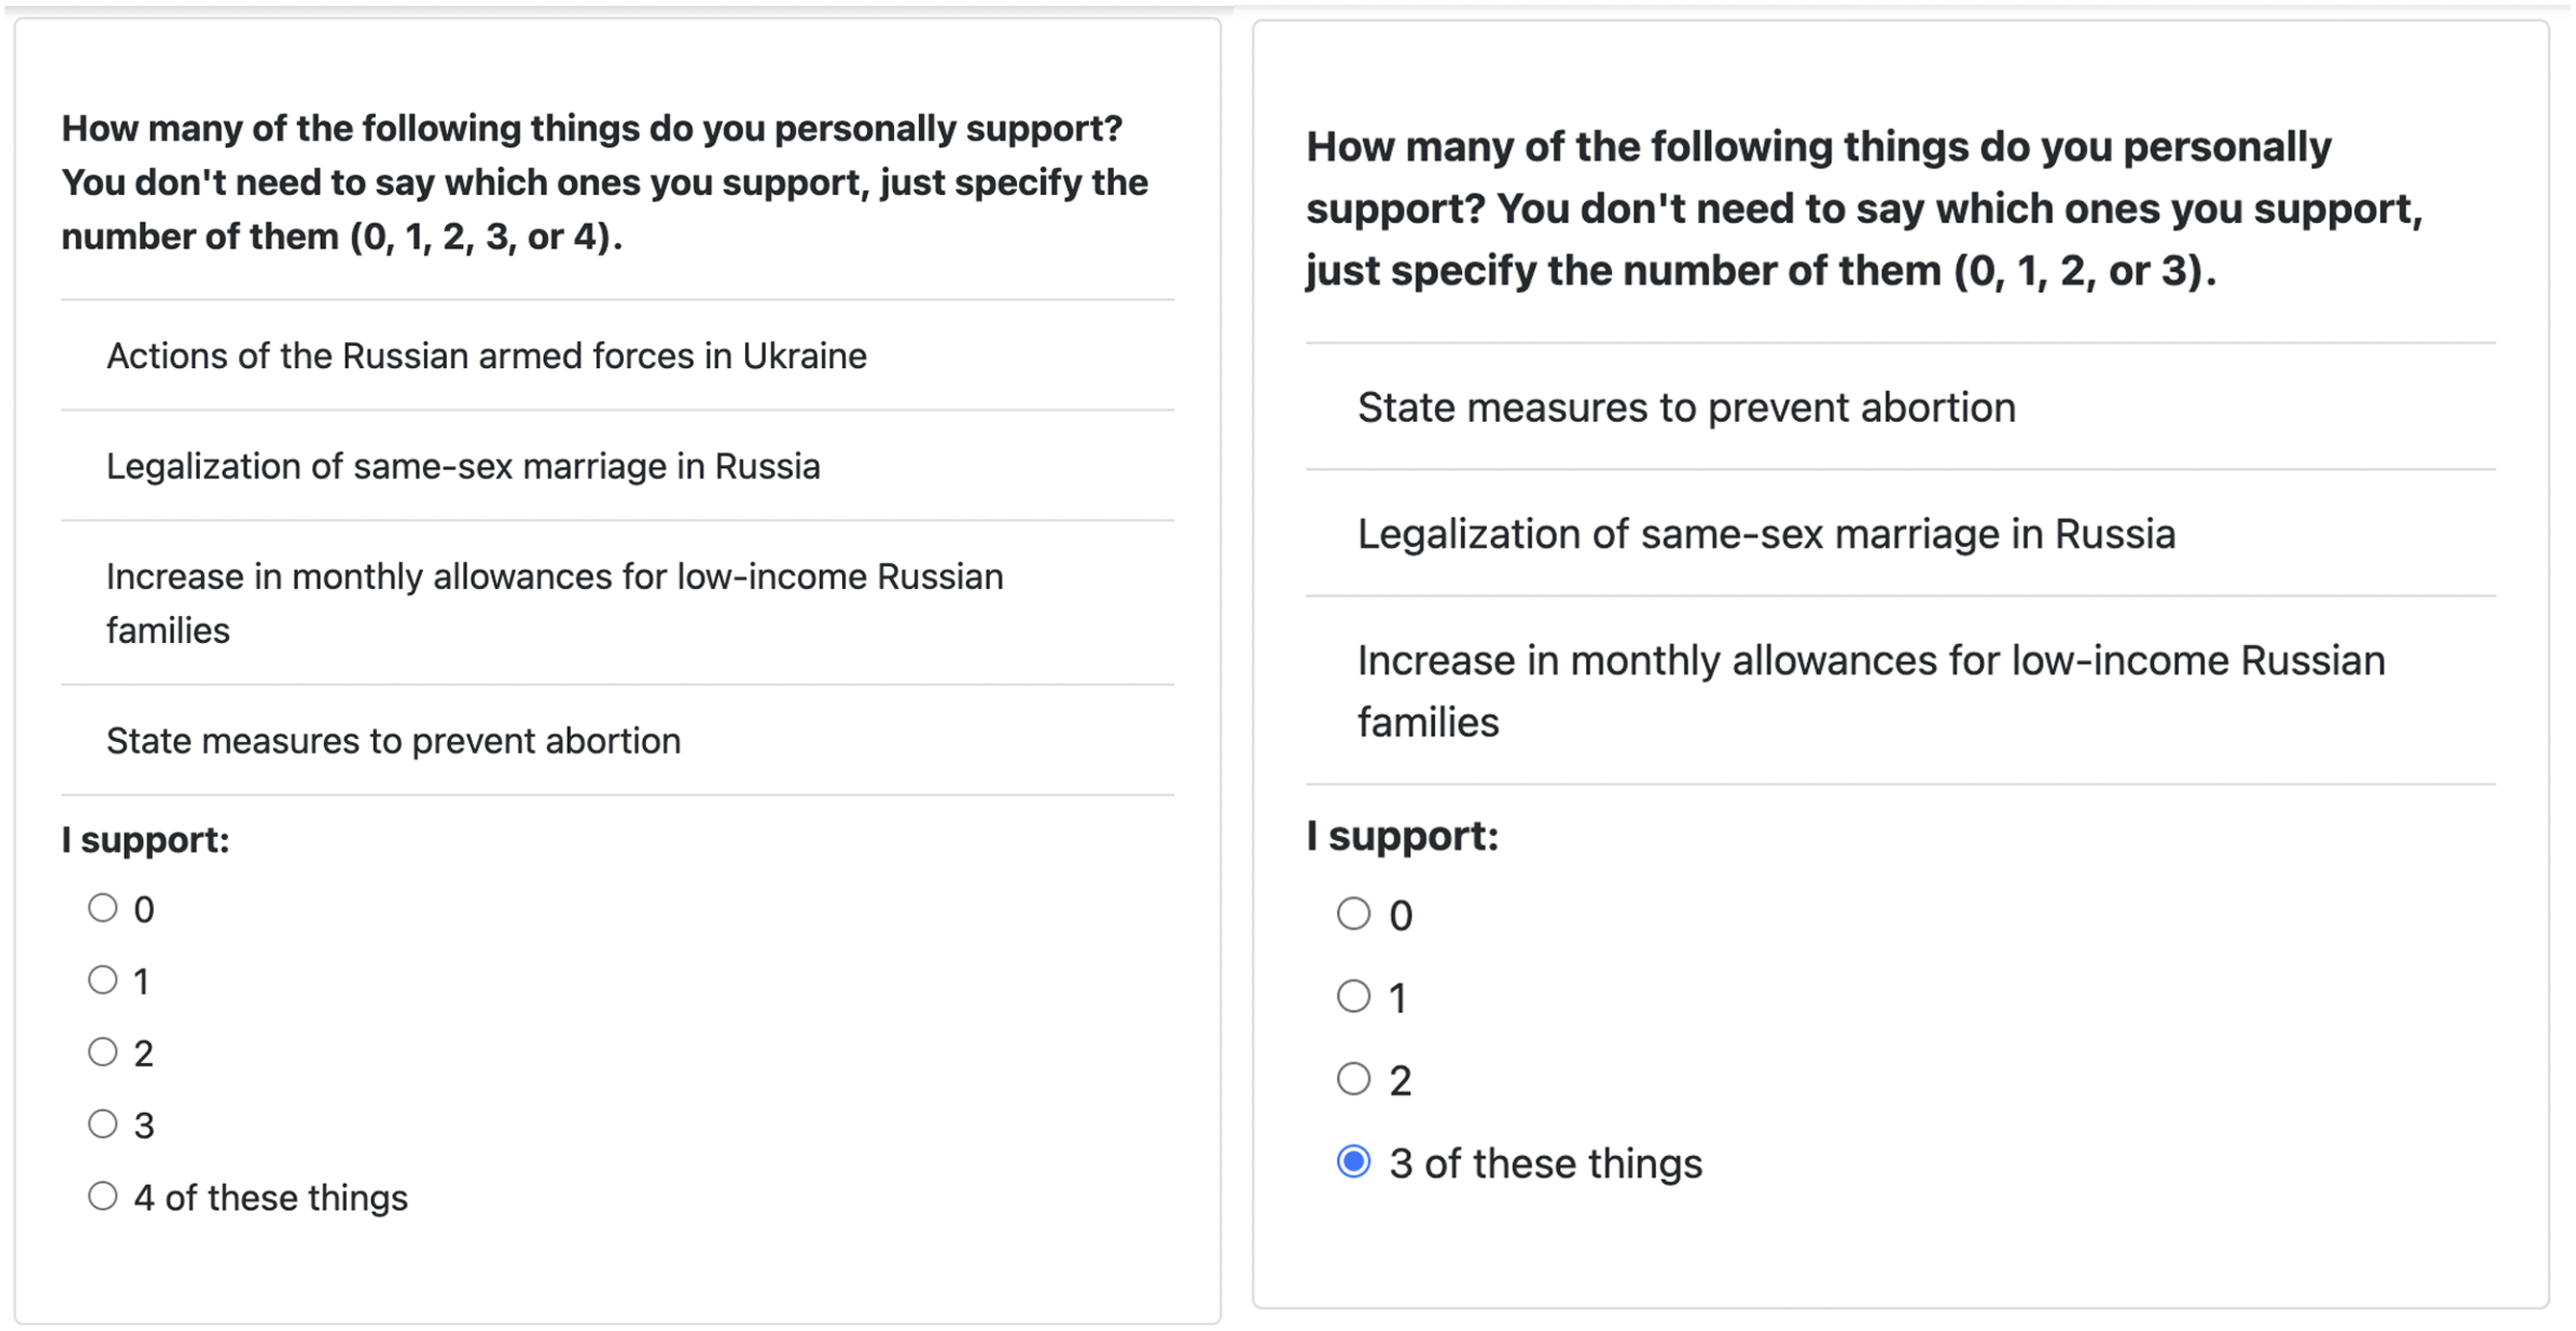
The extent to which people falsify their preferences with regard to the war is measured by comparing (a) the rate of support as determined by the list experiment to (b) the answer to a direct question. After replying to the three-item list, respondents in the control condition were asked “Do you personally support the actions of the Russian armed forces in Ukraine?” The respondents could choose between ‘Yes’ (1) and ‘No’ (0) – options that were shown in random order. We used the wording from the list experiment to formulate a direct question assessing the support for the invasion. This allows us to compare the two different ways of asking and, hence, to quantify the amount of preference falsification among our respondents.
We conducted the list experiment among a sample of 3000 Russians whom we recruited on the online platform Toloka. Toloka is a crowdsourcing platform similar to the US-based Amazon MTurk platform, which has frequently been used by social scientists for conducting experiments (Mullinix et al., 2015), but unlike MTurk, Toloka has a substantial Russian audience. The respondents on the platform are not a perfect mirror image of Russian society, of course. They tend to be younger, more often male, and better educated (Table 1). As such, our respondents are likely more liberal than the population average, meaning that our estimates may represent a lower bound of support for the war.
Results
The goals of our analysis are twofold: we seek, first, to determine the true level of support for the invasion as measured by the list experiment, and second, to assess the presence and strength of preference falsification. The true level of support is estimated as the difference between the means of the treatment and the control group, as is conventional in the analysis of list experiments (Blair and Imai 2012). In the treatment condition, respondents supported an average of 2.03 items, while in the control condition, this figure stood at 1.41.
From the list experiment, we therefore estimate the true level of support to be 61%. In contrast, when asked directly, 71% of our respondents stated that they supported the war, i.e. more than a two-thirds majority (see Figure 2). This difference of 10 percentage points is both substantially large and highly statistically significant (p < 0.01). Our experiment therefore provides clear evidence for preference falsification, even in the context of high overall levels of support for the war. Support for the Russian invasion of Ukraine. Note: Bars show averages, vertical lines show 95% confidence intervals. See Table A1 in the Appendix for regression results.
Summary statistics of respondent sample versus Russian population

Note: Table comparing averages for the sample and the Russian census of 2010, the latest for which detailed figures are available. Census averages are based on the population aged 18 years and older. The underlying figures can be retrieved from https://www.gks.ru/free_doc/new_site/perepis2010/croc/Documents/(in Russian).
Using the framework proposed by Eady (2017), we can assess among which demographic subgroups preference falsification is particularly common. As predictors we include a respondent’s sex, age, level of education, employment status, and TV-watching habits. We assessed TV-watching habits because an important discourse relates Russian popular support to media consumption – espeically of Kremlin-sponsored TV programs, who relate to the invasion with unwavering support (MacFarquhar 2022). The analysis shows that none of the demographic covariates, nor employment status significantly predicts preference falsification. In contrast, TV watching emerges as a very strong predictor (see Figure 3(a)). Predictors of preference falsification. Note: (a) Predictors of preference falsification/misreporting, calculated using the framework proposed by Eady (2017). Predicted values after MLE regression. Raw estimates shown in Table A4 in the Appendix. Markers are point estimates, horizontal lines show 90/95% confidence intervals. (b) Average levels of support for the Russian invasion of Ukraine. Bars show averages, vertical lines show 95% confidence intervals.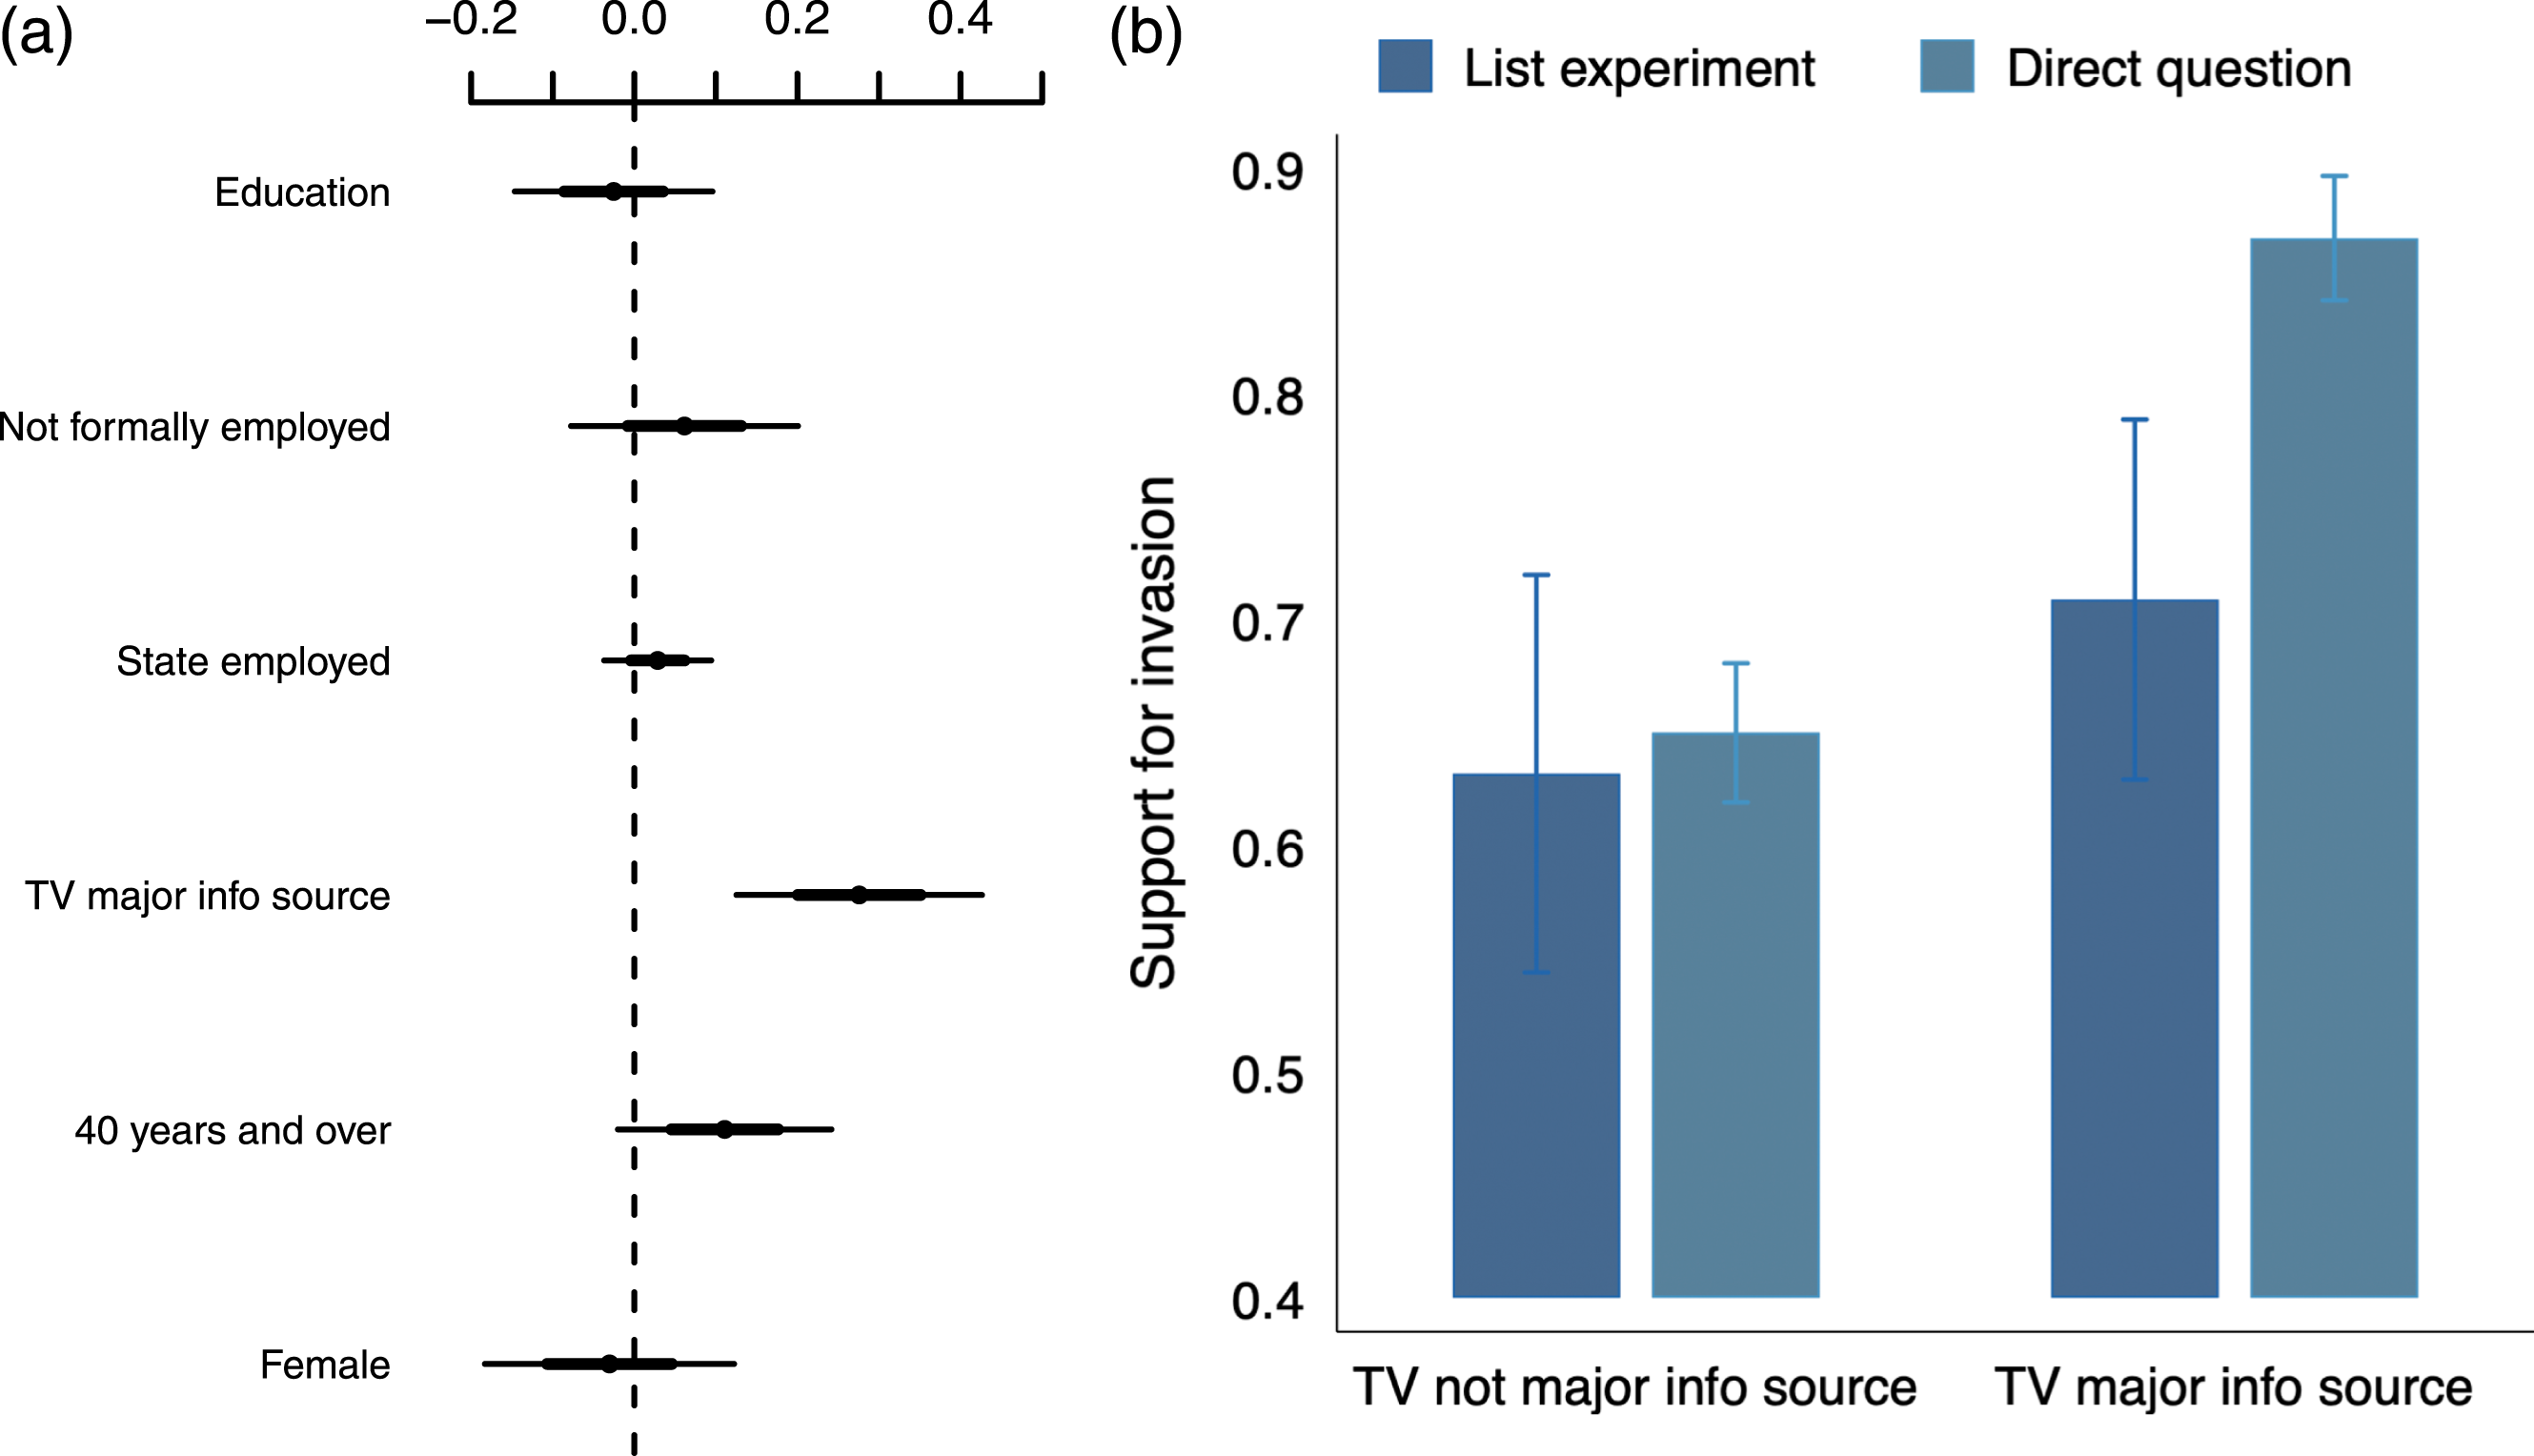
When directly asked, among individuals who self-report that they use TV as the most important way to “learn about news in the country and the world”, no less than 87% say that they support the war. Among those not usually using TV as a primary source of news, this share is 65%. Therefore, on the face of it, state propaganda indeed seems to ‘work.’
However, upon closer inspection, this 22 percentage point difference appears to be largely driven by stronger preference falsification among TV watchers. Shares of support as derived from the list experiment are 71% among TV-news watchers, and 63% among non-watchers. While this difference is still statistically significant (see Table A4), it is substantively much reduced. It appears that TV propaganda mainly has the effect of suggesting to viewers that the general view of the war is more homogeneously positive than it really is, i.e. of changing their beliefs about the beliefs of others. Hence, when asked publicly, in order to conform with what they perceive as the majority position, a vast majority states that they support the war. However, when allowed to state their opinion privately, their levels of support are similar to those less exposed to state-sponsored TV. State TV, as powerful as it may seem, appears to have limited impact on people’s privately held opinions.
Conclusion
Do people tell the full truth when asked about their support for a war while this war is ongoing? Our data, collected in the context of the Russian invasion of Ukraine, show that many do not. Instead, we detect significant levels of preference falsification, meaning that a substantial number of individuals privately oppose the war even while publicly supporting it. While there are no strong differences by demographic group, preference falsification is higher among individuals strongly exposed to state propaganda on TV – even though genuine support is only slightly higher.
How reliable are the estimates presented here? On the one hand, sample selection would suggest that genuine levels of support could be higher than those recorded in our list experiment. As shown, the respondents come from the more liberal part of Russian society, and correcting for this bias drives support rates up. At the same time, there are also reasons to believe that true levels of support for the war are actually lower than shown here. Careful respondents might be reluctant to express their opposition to the war even when given an option to do so privately in the list experiment. This argument is in line with empirical evidence that list experiments reduce response bias but do not eliminate it entirely (Rosenfeld et al. 2016).
Finally, what do our results imply for the prospects for peace – insofar as these depend on popular support? On the one hand, there is reason for optimism. Given that private preferences for a war may often be significantly less supportive than publicly-stated preferences, war leaders can pursue peace without fearing a large popular backlash. At the same time, our results tell a sobering tale. Even at a point where the brutality of war should have become clear to everyone willing to look, genuine support can remain very substantial.
Footnotes
Declaration of conflicting interests
The author(s) declared no potential conflicts of interest with respect to the research, authorship, and/or publication of this article.
Funding
The author(s) received no financial support for the research, authorship, and/or publication of this article.
Notes
Appendix
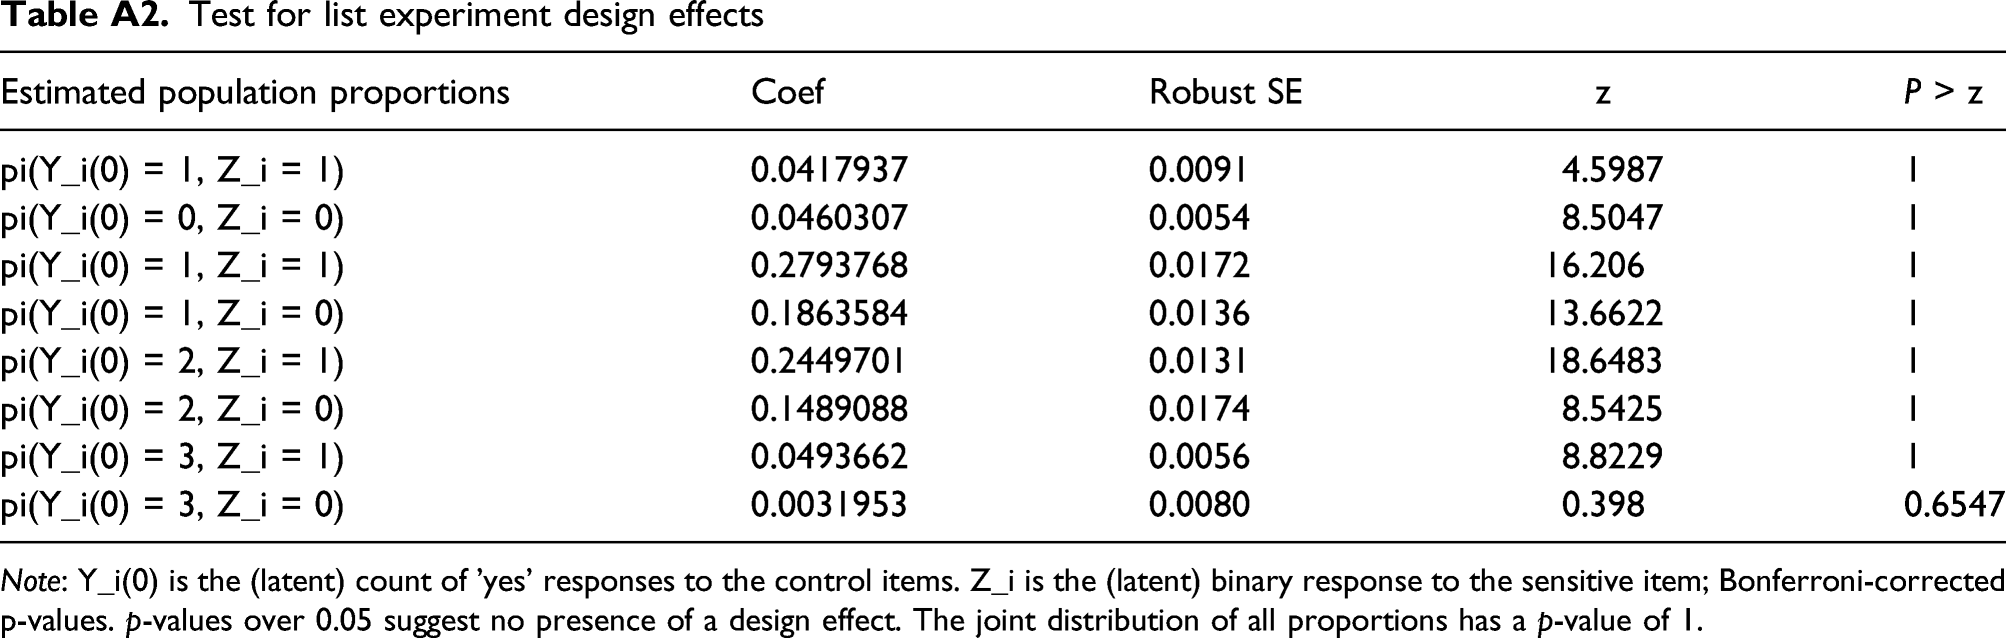
Regression estimates for the list experiment, additionally controlling for demographics Note: OLS regression, standard errors in parentheses, *p < 0.05, **p < 0.01, ***p < 0.001. Test for list experiment design effects Note: Y_i(0) is the (latent) count of 'yes' responses to the control items. Z_i is the (latent) binary response to the sensitive item; Bonferroni-corrected p-values. p-values over 0.05 suggest no presence of a design effect. The joint distribution of all proportions has a p-value of 1. Balance statistics by treatment status Predictors of war-support and preference falsification Note: Results from the ‘misreport’ package provided by Eady (2017), which estimates the joint response to the list experiment and the direct question simultaneously. Model (1) reports results for the sensitive item model, Model (2) reports the results for the misreport model. The coefficients for 23 observations were excluded from the data frame because they violated the monotonicity assumption; *p < 0.05, **p < 0.01, ***p < 0.001.
(1)
(2)
(3)
(4)
Treatment
0.62***
0.62***
0.67***
0.68***
(Estimate list experiment)
(0.03)
(0.03)
(0.03)
(0.03)
Male
—
0.04
—
0.01
—
—
(0.03)
—
(0.03)
Age in 10 years
—
−0.00
—
−0.02
—
—
(0.01)
—
(0.01)
Education
—
−0.04***
—
−0.05**
—
—
(0.01)
—
(0.01)
Constant
1.41***
1.48***
1.42***
1.54***
—
(0.02)
(0.06)
(0.02)
(0.06)
N
3002
3002
3002
3002
R2
0.12
0.12
0.14
0.15
Estimated population proportions
Coef
Robust SE
z
P > z
pi(Y_i(0) = 1, Z_i = 1)
0.0417937
0.0091
4.5987
1
pi(Y_i(0) = 0, Z_i = 0)
0.0460307
0.0054
8.5047
1
pi(Y_i(0) = 1, Z_i = 1)
0.2793768
0.0172
16.206
1
pi(Y_i(0) = 1, Z_i = 0)
0.1863584
0.0136
13.6622
1
pi(Y_i(0) = 2, Z_i = 1)
0.2449701
0.0131
18.6483
1
pi(Y_i(0) = 2, Z_i = 0)
0.1489088
0.0174
8.5425
1
pi(Y_i(0) = 3, Z_i = 1)
0.0493662
0.0056
8.8229
1
pi(Y_i(0) = 3, Z_i = 0)
0.0031953
0.0080
0.398
0.6547

Covariate
Mean overall
SD
Mean Control
SD
Mean treatment
SD
p-value Δ
Male
0.49
(-0.50)
0.49
(-0.50)
0.49
(-0.50)
0.89
Age
36.49
(-11.40)
36.35
(-11.13)
36.63
(-11.67)
0.50
Education
2.03
(-1.16)
2.00
(-1.17)
2.05
(-1.15)
0.25
Employment status
1.16
(-0.91)
1.17
(-0.91)
1.15
(-0.91)
0.60
TV major info source
0.47
(-0.50)
0.48
(-0.50)
0.46
(-0.50)
0.46
N
3002
—
1503
—
1499
—
—

(1)
(2)
Est
SE
Est
SE
Female
−0.222
(0.172)
−0.164
(0.416)
40 years and over
0.299
(0.186)
0.613
(0.395)
Education
−0.213
(0.166)
−0.144
(0.395)
Employment status
−0.252
(0.085)**
0.201
(0.227)
TV major info source
0.747
(0.195)***
1.478
(0.455)**
Intercept
0.548
(0.188)**
−2.062
(0.624)**
N
2981
2981